| Param | Original file | Final file |
|---|---|---|
| Filename | modeM0/AS1A12_097T01_9000005574_40892cztM0_level2.fits | modeM0/AS1A12_097T01_9000005574_40892cztM0_level2_quad_clean.evt |
| Size (bytes) | 385,744,320 | 90,057,600 |
| Size | 367.9 MB | 85.9 MB |
| Events in quadrant A | 2,947,171 | 608,237 |
| Events in quadrant B | 3,361,331 | 614,734 |
| Events in quadrant C | 2,898,401 | 593,459 |
| Events in quadrant D | 4,644,538 | 525,199 |
| Mode M9 | |||
|---|---|---|---|
| Quadrant | BADHDUFLAG | Total packets | Discarded packets |
| A | 0 | 20 | 0 |
| B | 0 | 20 | 0 |
| C | 0 | 20 | 0 |
| D | 0 | 21 | 0 |
| Mode SS | |||
|---|---|---|---|
| Quadrant | BADHDUFLAG | Total packets | Discarded packets |
| A | 0 | 112 | 0 |
| B | 0 | 112 | 0 |
| C | 0 | 112 | 0 |
| D | 0 | 112 | 0 |
| Mode M0 | |||
|---|---|---|---|
| Quadrant | BADHDUFLAG | Total packets | Discarded packets |
| A | 0 | 12161 | 3 |
| B | 0 | 13696 | 2 |
| C | 0 | 12003 | 2 |
| D | 0 | 17644 | 2 |
| Quadrant | Total seconds | Saturated seconds | Saturation percentage |
|---|---|---|---|
| A | 5497 | 24 | 0.436602% |
| B | 5497 | 197 | 3.583773% |
| C | 5497 | 80 | 1.455339% |
| D | 5497 | 338 | 6.148808% |
Noise dominated data is calculated using 1-second bins in cleaned event files. If a bin has >2000 counts, and if more than 50% of those come from <1% of pixels, then it is considered to be noise-dominated and hence unusable.
| Quadrant | # 1 sec bins | Bins with >0 counts | Bins with >2000 counts | High rate bins dominated by noise | Noise dominated (total time) | Noise dominated (detector-on time) | Marked lightcurve |
|---|---|---|---|---|---|---|---|
| A | 7229 | 5498 | 2 | 2 | 0.03% | 0.04% | 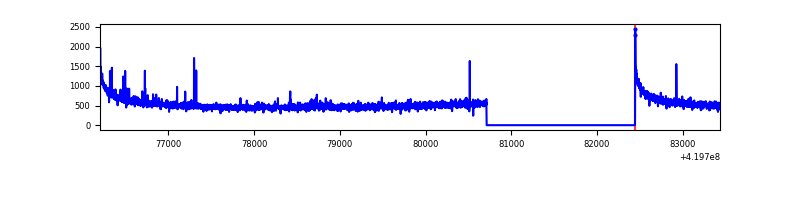 |
| B | 7229 | 5498 | 125 | 125 | 1.73% | 2.27% |  |
| C | 7229 | 5498 | 56 | 56 | 0.77% | 1.02% | 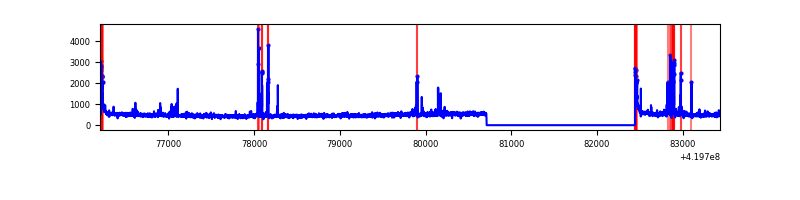 |
| D | 7229 | 5498 | 296 | 296 | 4.09% | 5.38% |  |
Top three noisy pixels from each quadrant. If the there are fewer than three noisy pixels in the level2.evt file, extra rows are filled as -1
| Pixel properties | Quadrant properties | ||||||
|---|---|---|---|---|---|---|---|
| Quadrant | DetID | PixID | Counts | Sigma | Mean | Median | Sigma |
| A | 10 | 83 | 558948 | 4542.19 | 598 | 585 | 122.9 |
| A | 13 | 248 | 33450 | 267.35 | 598 | 585 | 122.9 |
| A | 12 | 189 | 12844 | 99.72 | 598 | 585 | 122.9 |
| B | 5 | 255 | 575916 | 5059.46 | 592 | 576 | 113.7 |
| B | 4 | 171 | 269763 | 2367.19 | 592 | 576 | 113.7 |
| B | 15 | 85 | 87797 | 767.01 | 592 | 576 | 113.7 |
| C | 15 | 214 | 235006 | 1709.15 | 585 | 590 | 137.2 |
| C | 14 | 254 | 170172 | 1236.44 | 585 | 590 | 137.2 |
| C | 0 | 10 | 114423 | 829.97 | 585 | 590 | 137.2 |
| D | 12 | 79 | 701081 | 4956.53 | 572 | 556 | 141.3 |
| D | 2 | 249 | 558362 | 3946.73 | 572 | 556 | 141.3 |
| D | 12 | 128 | 506439 | 3579.35 | 572 | 556 | 141.3 |
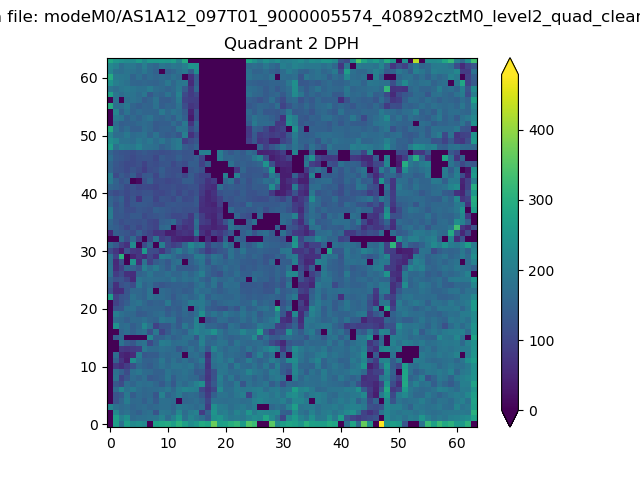
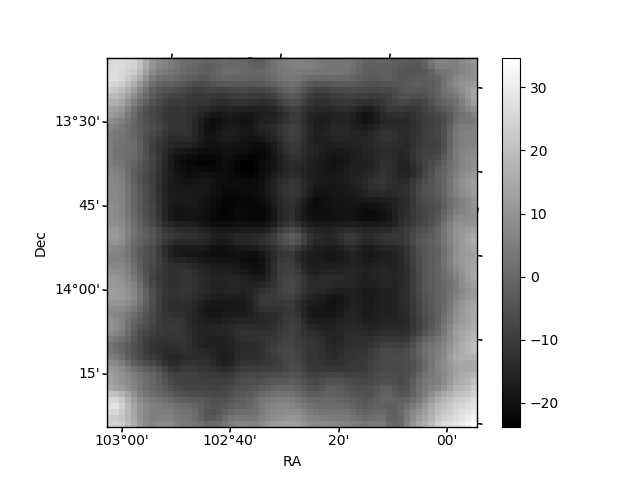
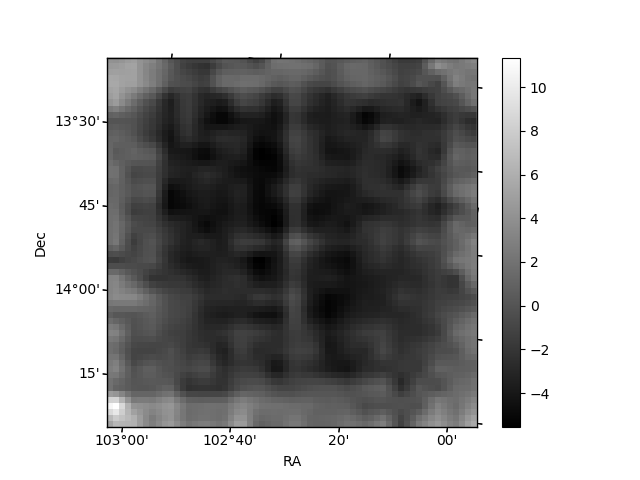
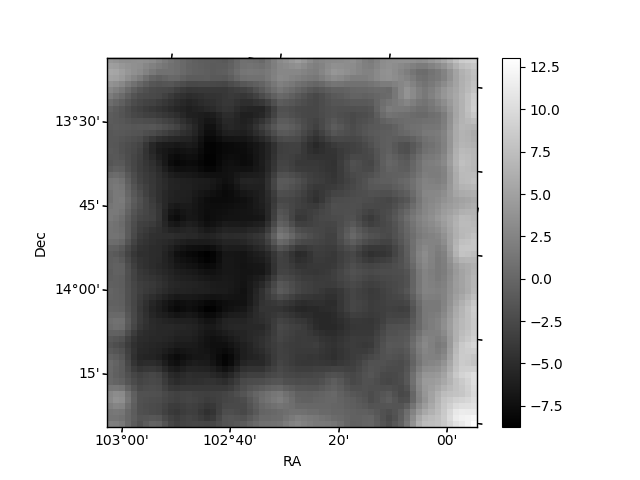
Histogram calculated using DETX and DETY for each event in the final _common_clean file
| Quadrant A |  |
 |
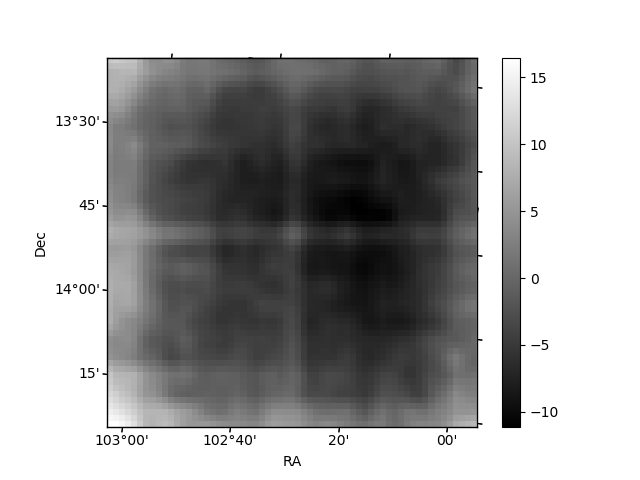
Quadrant B |
|---|---|---|---|
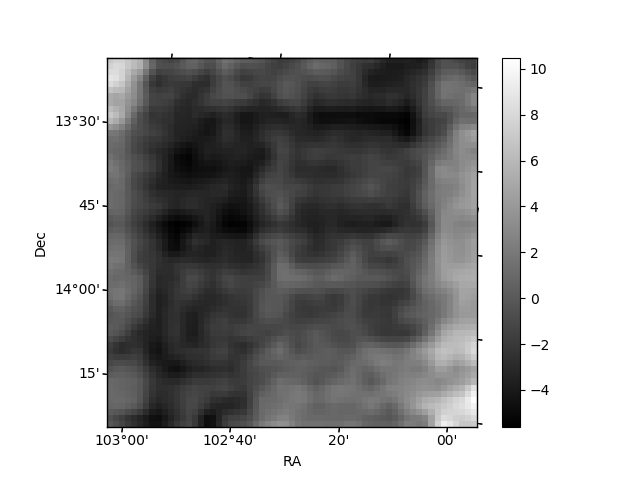
| Quadrant D | 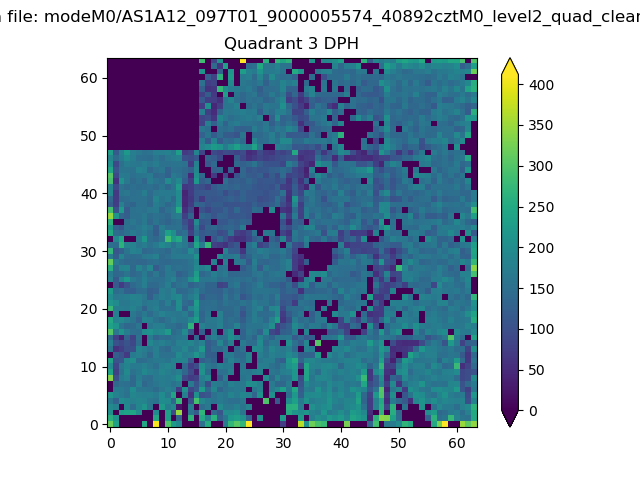 |
 |
Quadrant C |
| Plot type | Count rate plots | Images |
|---|---|---|
| Comparison with Poisson distribution Blue bars denote a histogram of data divided into 1 sec bins. Red curve is a Poisson curve with rate = median count rate of data. |
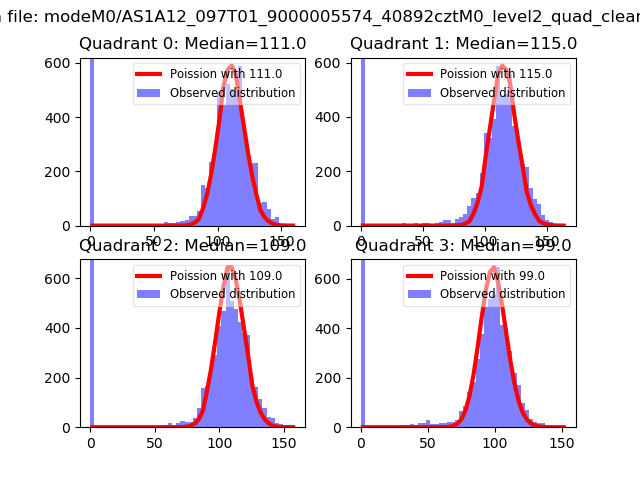 |
 |
| Quadrant-wise count rates Data is divided into 100 sec bins |
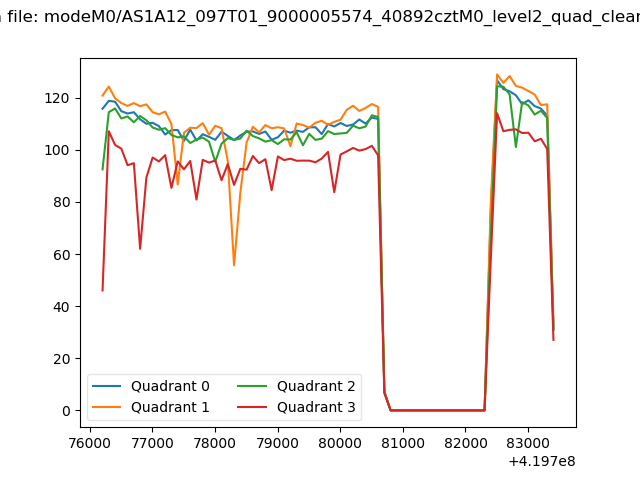 |
|
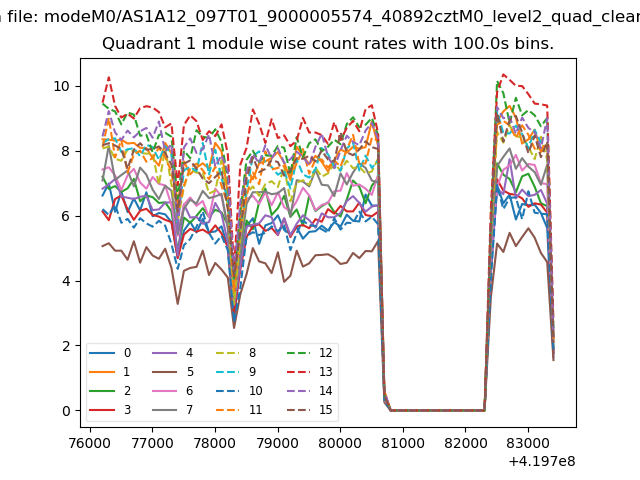
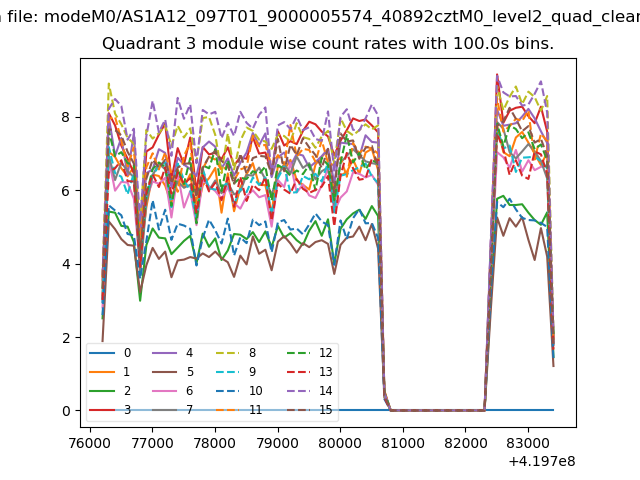
| Module-wise count rates for Quadrant A Data is divided into 100 sec bins |
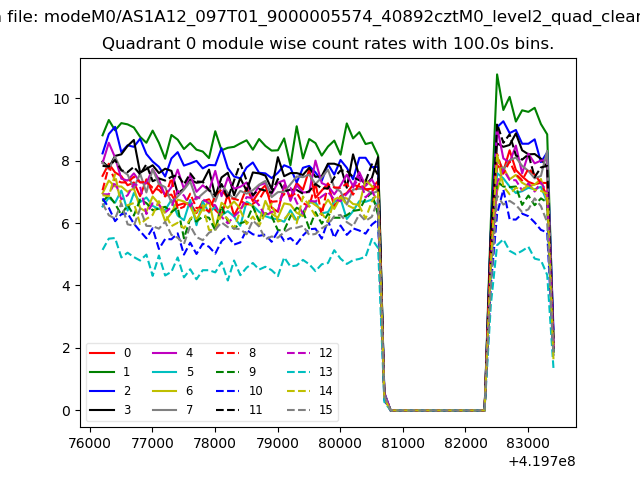 |
 |
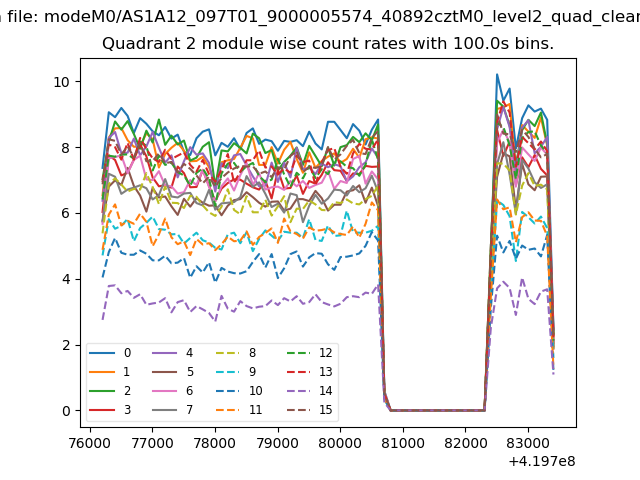
| Module-wise count rates for Quadrant B Data is divided into 100 sec bins |
 |
 |
| Module-wise count rates for Quadrant C Data is divided into 100 sec bins |
 |
 |
| Module-wise count rates for Quadrant D Data is divided into 100 sec bins |
 |
 |
| Parameter | Plot |
|---|---|
| CZT HV Monitor | 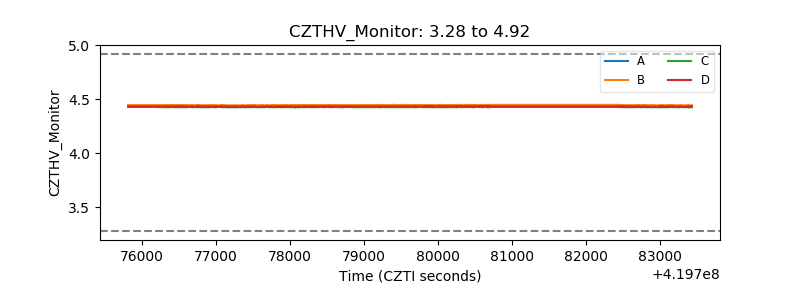 |
| D_VDD | 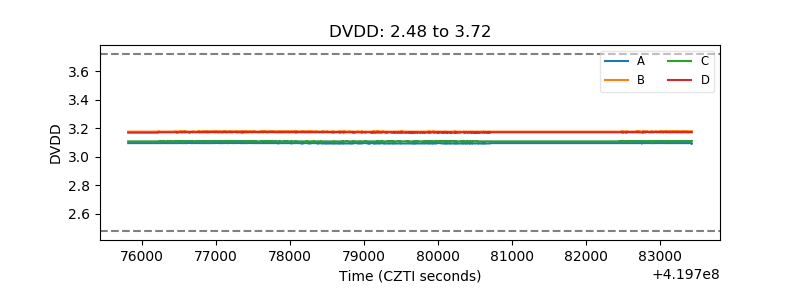 |
| Temperature 1 | 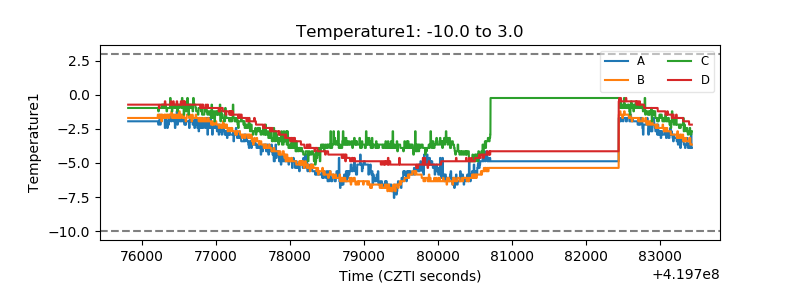 |
| Veto HV Monitor | 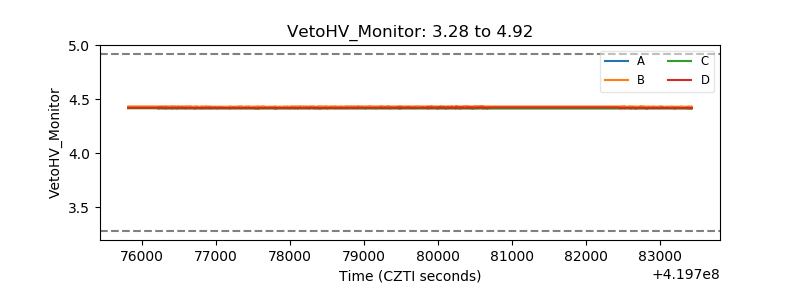 |
| Veto LLD | 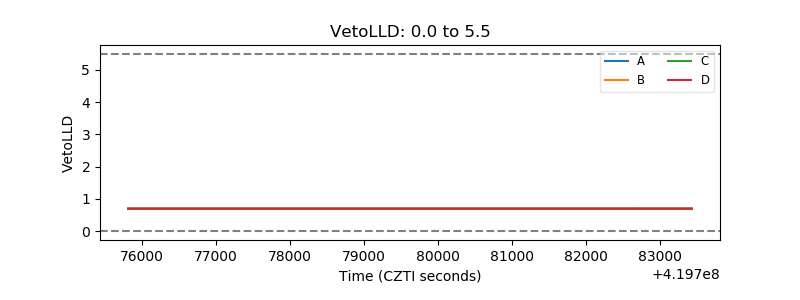 |
| Alpha Counter | 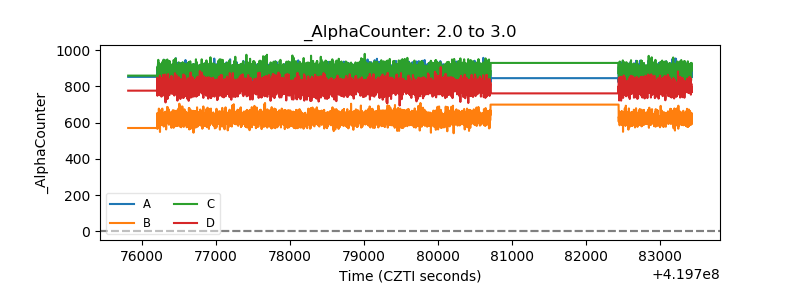 |
| _CPM_Rate | 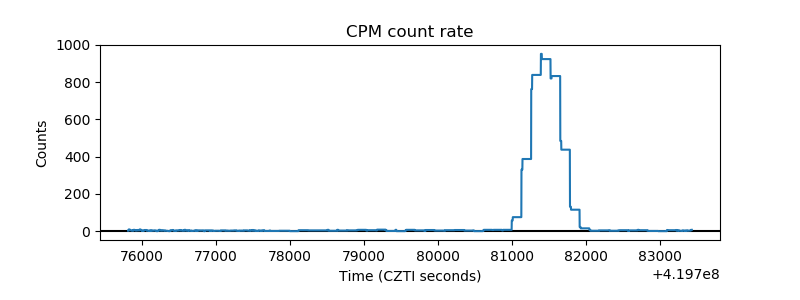 |
| CZT Counter | 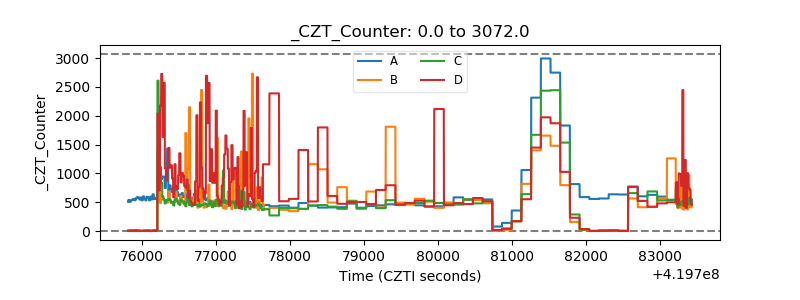 |
| +2.5 Volts monitor | 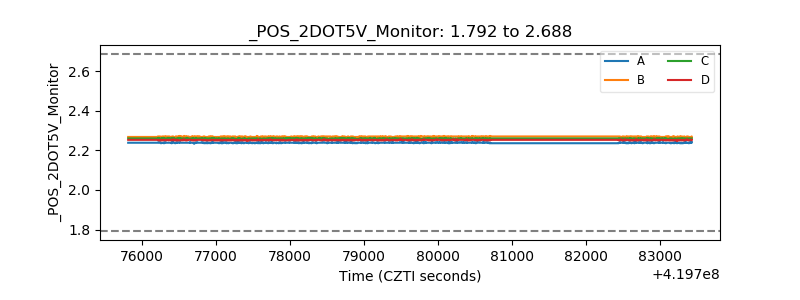 |
| +5 Volts monitor | 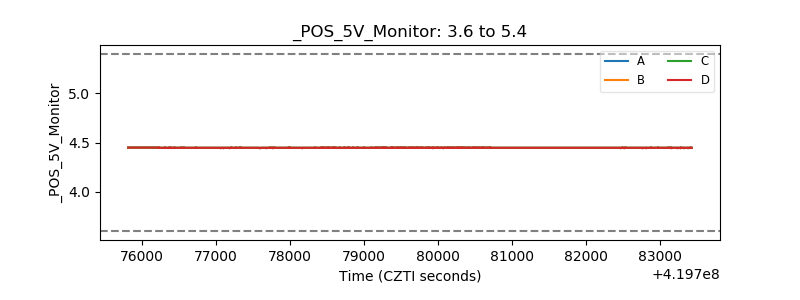 |
| _ROLL_ROT | 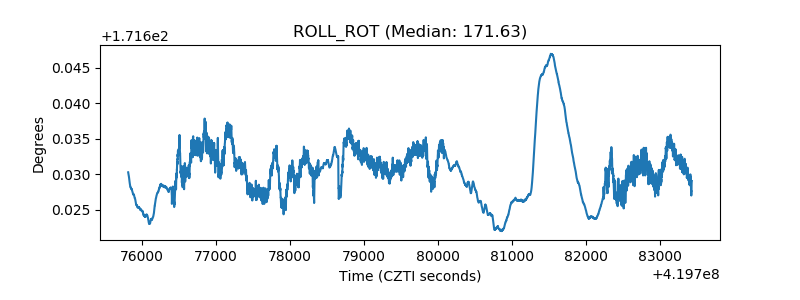 |
| _Roll_DEC | 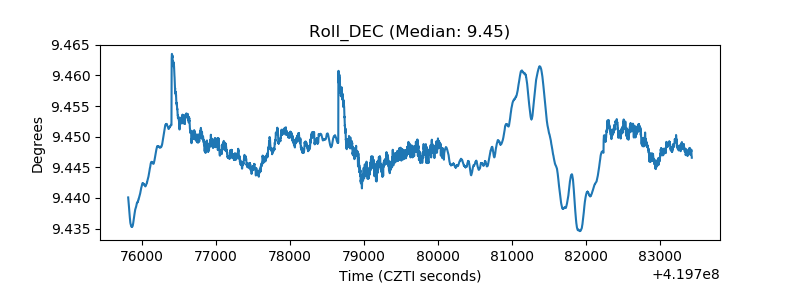 |
| _Roll_RA | 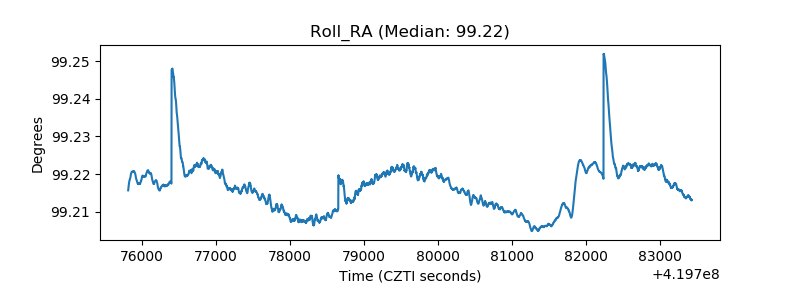 |
| Veto Counter | 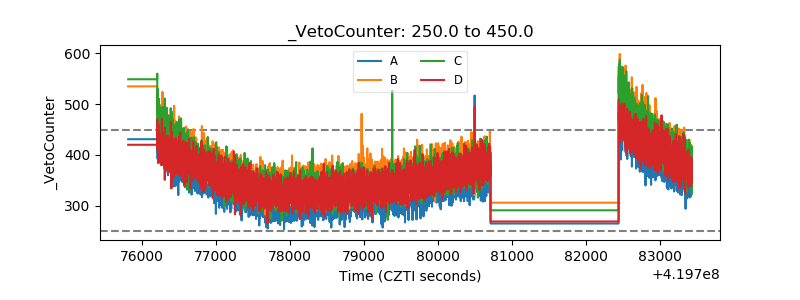 |