| Param | Original file | Final file |
|---|---|---|
| Filename | modeM0/AS1A12_097T01_9000005574_40893cztM0_level2.fits | modeM0/AS1A12_097T01_9000005574_40893cztM0_level2_quad_clean.evt |
| Size (bytes) | 1,998,990,720 | 434,756,160 |
| Size | 1.9 GB | 414.6 MB |
| Events in quadrant A | 14,229,612 | 2,949,351 |
| Events in quadrant B | 20,697,896 | 2,905,557 |
| Events in quadrant C | 13,395,235 | 2,921,774 |
| Events in quadrant D | 23,573,146 | 2,515,744 |
| Mode M9 | |||
|---|---|---|---|
| Quadrant | BADHDUFLAG | Total packets | Discarded packets |
| A | 0 | 80 | 0 |
| B | 0 | 80 | 0 |
| C | 0 | 80 | 0 |
| D | 0 | 80 | 0 |
| Mode SS | |||
|---|---|---|---|
| Quadrant | BADHDUFLAG | Total packets | Discarded packets |
| A | 0 | 554 | 0 |
| B | 0 | 554 | 0 |
| C | 0 | 554 | 0 |
| D | 0 | 554 | 0 |
| Mode M0 | |||
|---|---|---|---|
| Quadrant | BADHDUFLAG | Total packets | Discarded packets |
| A | 0 | 58607 | 7 |
| B | 0 | 80004 | 8 |
| C | 0 | 57234 | 6 |
| D | 0 | 88838 | 6 |
| Quadrant | Total seconds | Saturated seconds | Saturation percentage |
|---|---|---|---|
| A | 27196 | 73 | 0.268422% |
| B | 27195 | 2068 | 7.604339% |
| C | 27195 | 159 | 0.584666% |
| D | 27195 | 2198 | 8.082368% |
Noise dominated data is calculated using 1-second bins in cleaned event files. If a bin has >2000 counts, and if more than 50% of those come from <1% of pixels, then it is considered to be noise-dominated and hence unusable.
| Quadrant | # 1 sec bins | Bins with >0 counts | Bins with >2000 counts | High rate bins dominated by noise | Noise dominated (total time) | Noise dominated (detector-on time) | Marked lightcurve |
|---|---|---|---|---|---|---|---|
| A | 38171 | 27202 | 20 | 20 | 0.05% | 0.07% | 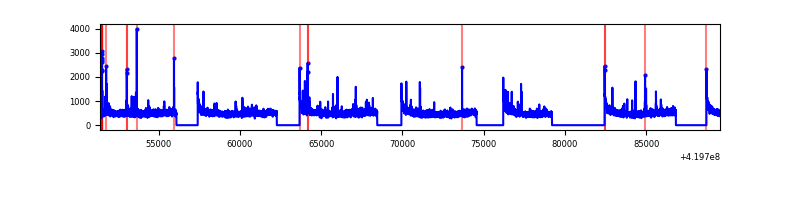 |
| B | 38171 | 27201 | 1454 | 1454 | 3.81% | 5.35% | 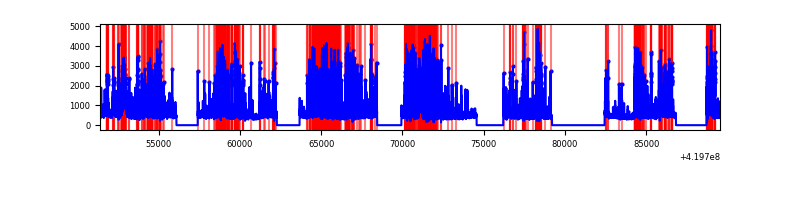 |
| C | 38171 | 27201 | 119 | 119 | 0.31% | 0.44% | 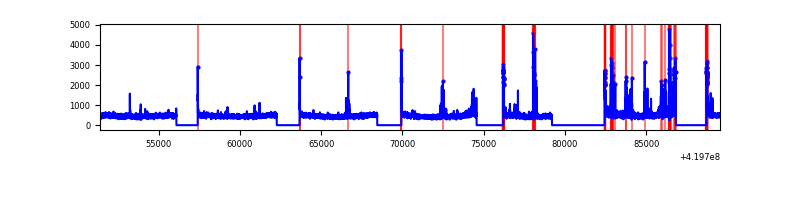 |
| D | 38171 | 27201 | 1925 | 1925 | 5.04% | 7.08% | 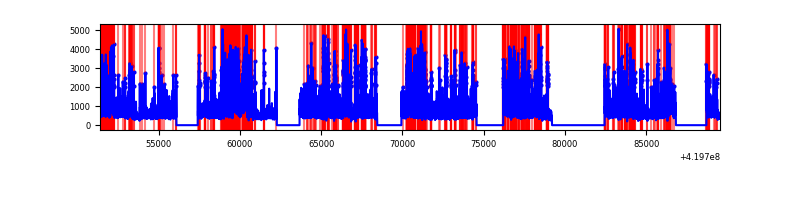 |
Top three noisy pixels from each quadrant. If the there are fewer than three noisy pixels in the level2.evt file, extra rows are filled as -1
| Pixel properties | Quadrant properties | ||||||
|---|---|---|---|---|---|---|---|
| Quadrant | DetID | PixID | Counts | Sigma | Mean | Median | Sigma |
| A | 10 | 83 | 2368819 | 3935.25 | 2950 | 2888 | 601.2 |
| A | 13 | 248 | 197436 | 323.59 | 2950 | 2888 | 601.2 |
| A | 2 | 79 | 119303 | 193.63 | 2950 | 2888 | 601.2 |
| B | 5 | 255 | 5303111 | 9637.66 | 2880 | 2791 | 550.0 |
| B | 4 | 171 | 2476902 | 4498.72 | 2880 | 2791 | 550.0 |
| B | 0 | 229 | 495080 | 895.14 | 2880 | 2791 | 550.0 |
| C | 15 | 214 | 1141685 | 1697.28 | 2892 | 2912 | 670.9 |
| C | 14 | 254 | 560812 | 831.52 | 2892 | 2912 | 670.9 |
| C | 0 | 10 | 261747 | 385.78 | 2892 | 2912 | 670.9 |
| D | 12 | 79 | 3591757 | 5279.91 | 2788 | 2714 | 679.8 |
| D | 12 | 233 | 2594498 | 3812.82 | 2788 | 2714 | 679.8 |
| D | 12 | 128 | 2108251 | 3097.5 | 2788 | 2714 | 679.8 |
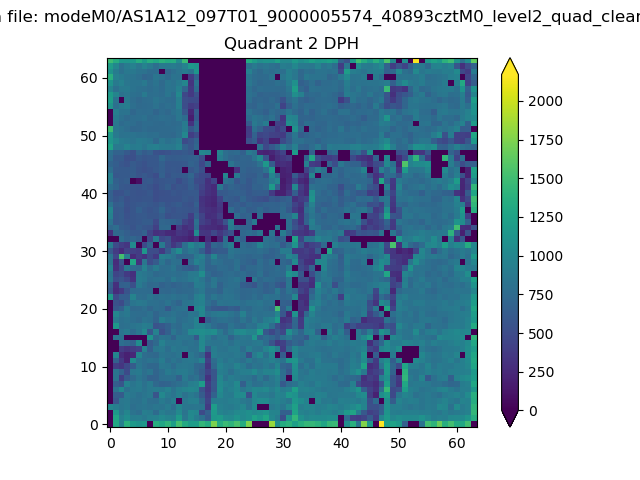
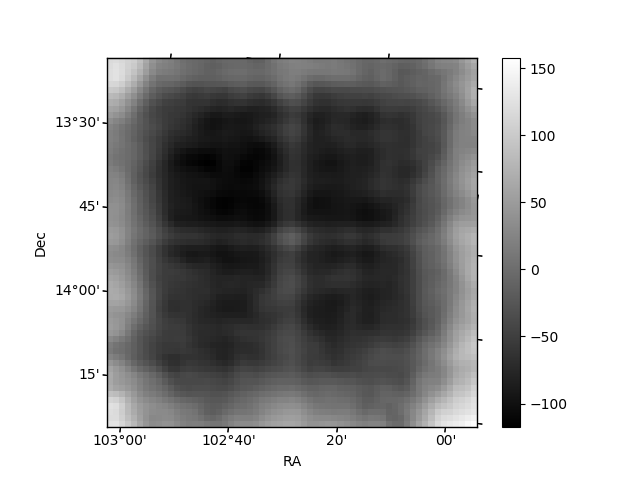
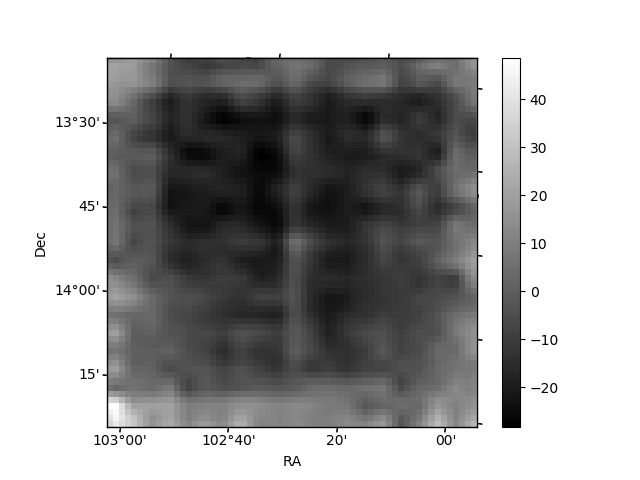
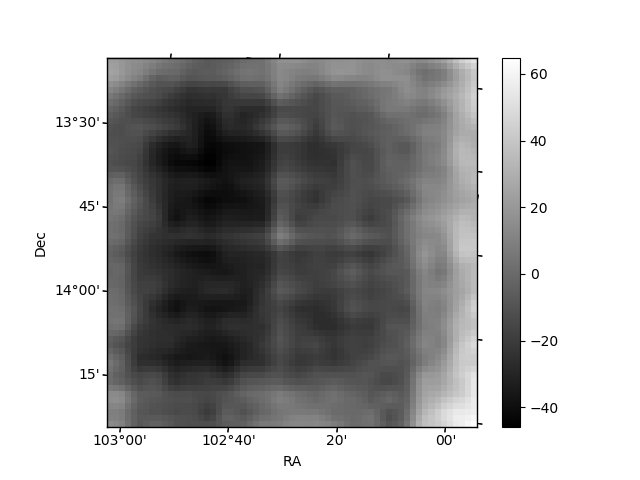
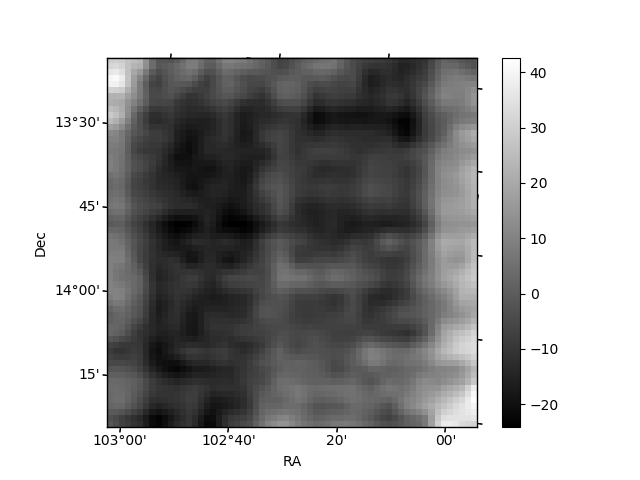
Histogram calculated using DETX and DETY for each event in the final _common_clean file
| Quadrant A | 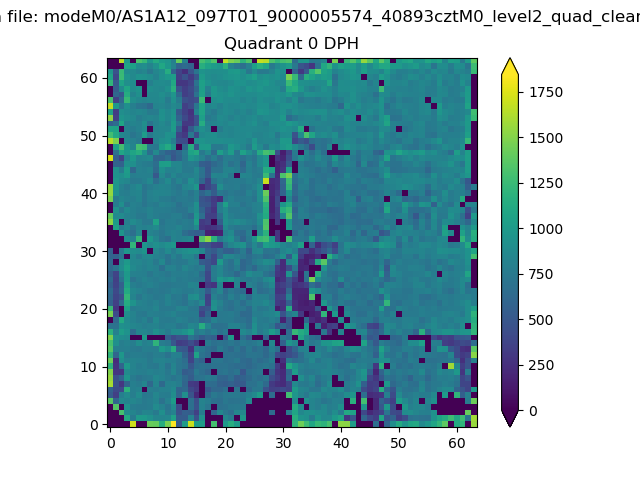 |
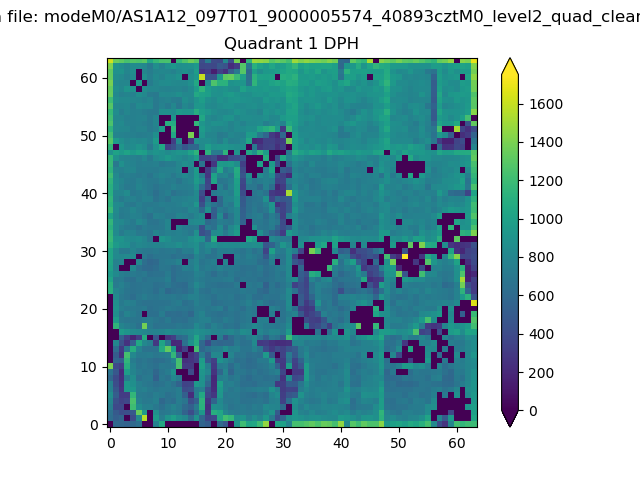 |
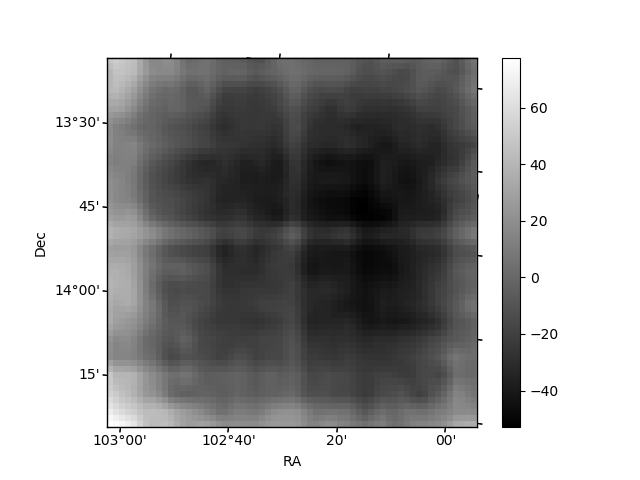
Quadrant B |
|---|---|---|---|
| Quadrant D | 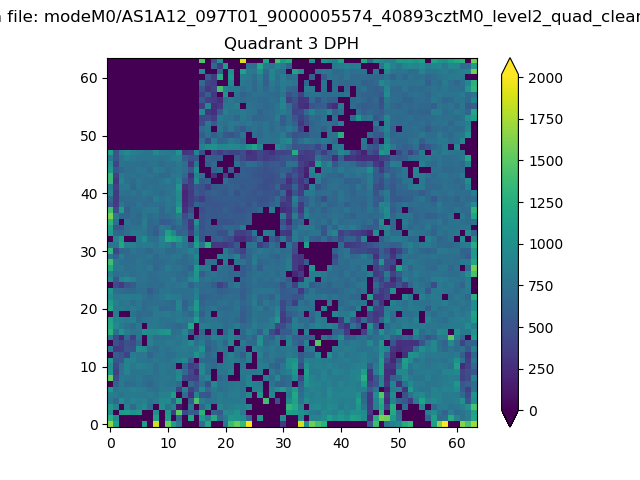 |
 |
Quadrant C |
| Plot type | Count rate plots | Images |
|---|---|---|
| Comparison with Poisson distribution Blue bars denote a histogram of data divided into 1 sec bins. Red curve is a Poisson curve with rate = median count rate of data. |
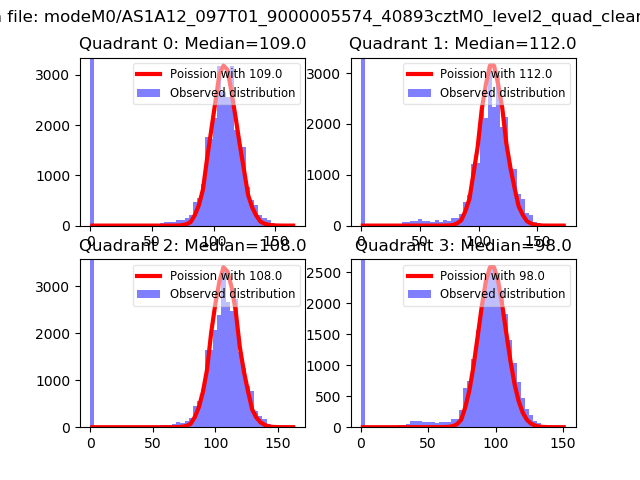 |
 |
| Quadrant-wise count rates Data is divided into 100 sec bins |
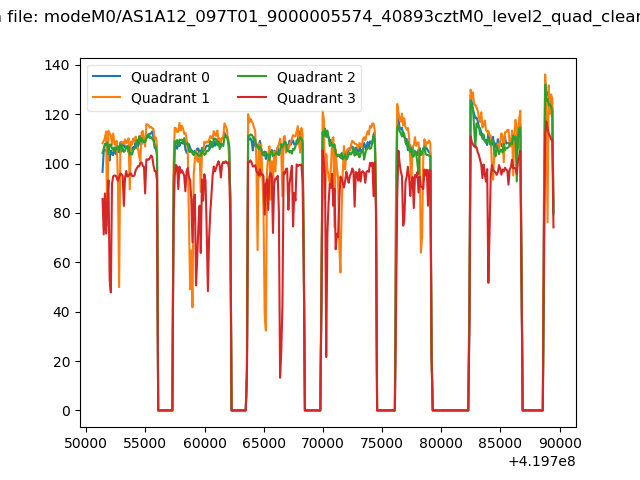 |
|
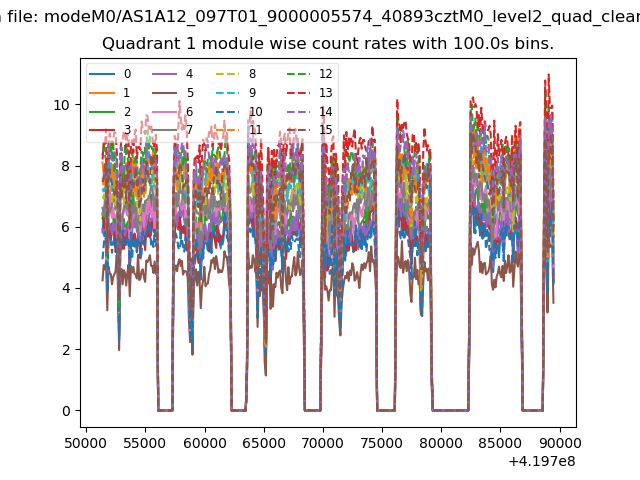
| Module-wise count rates for Quadrant A Data is divided into 100 sec bins |
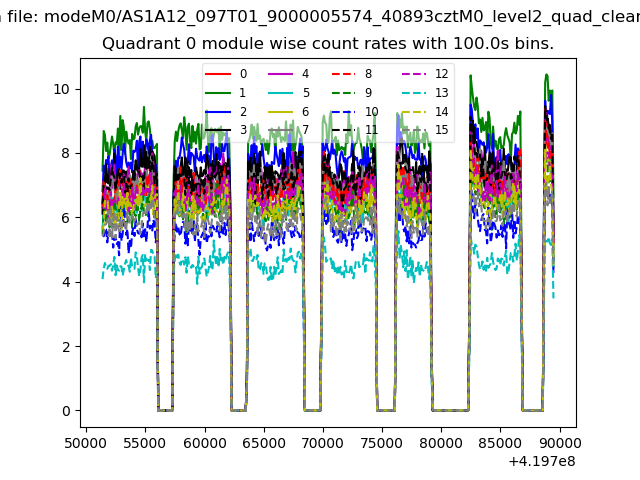 |
 |
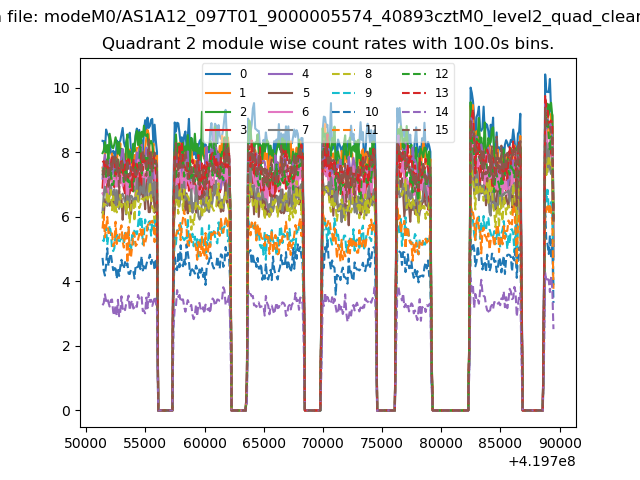
| Module-wise count rates for Quadrant B Data is divided into 100 sec bins |
 |
 |
| Module-wise count rates for Quadrant C Data is divided into 100 sec bins |
 |
 |
| Module-wise count rates for Quadrant D Data is divided into 100 sec bins |
 |
 |
| Parameter | Plot |
|---|---|
| CZT HV Monitor | 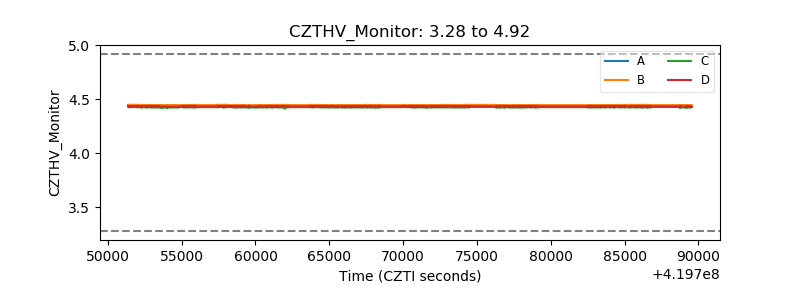 |
| D_VDD | 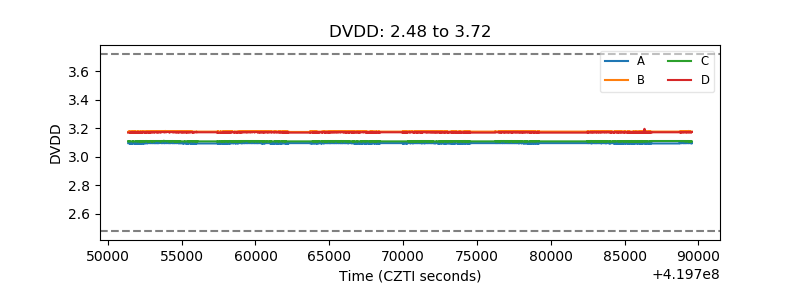 |
| Temperature 1 | 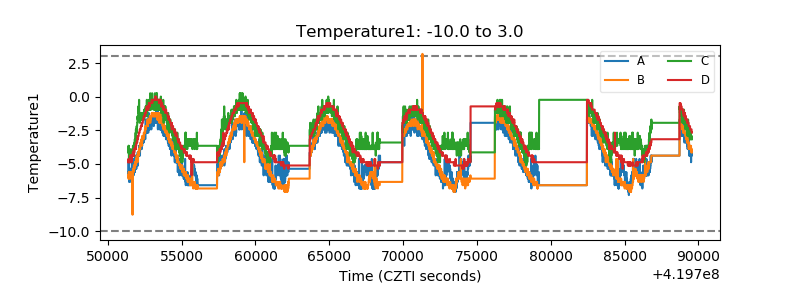 |
| Veto HV Monitor | 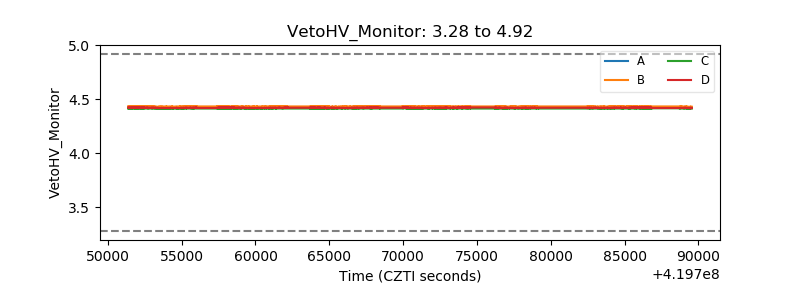 |
| Veto LLD | 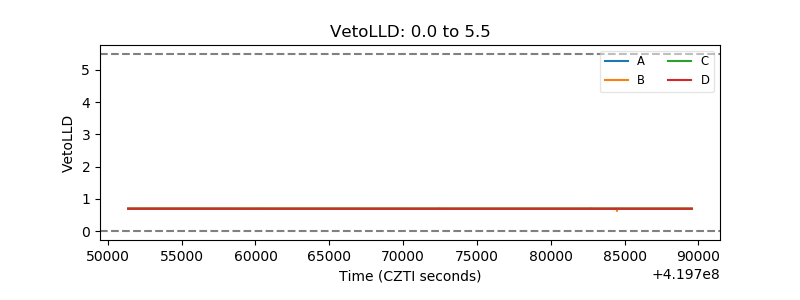 |
| Alpha Counter |  |
| _CPM_Rate |  |
| CZT Counter | 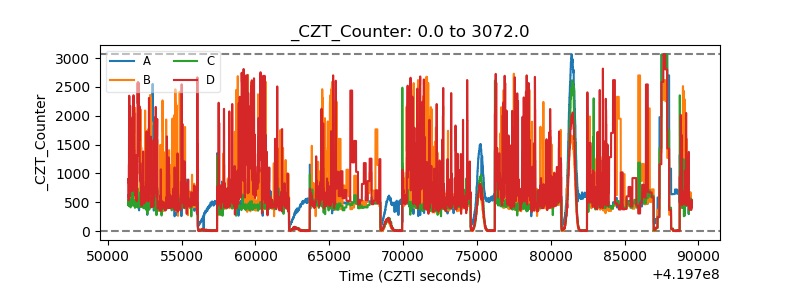 |
| +2.5 Volts monitor | 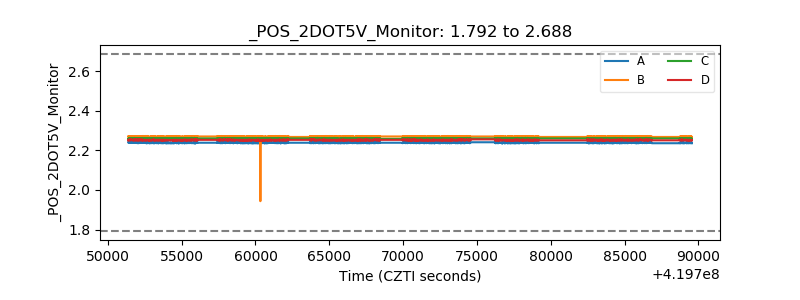 |
| +5 Volts monitor |  |
| _ROLL_ROT | 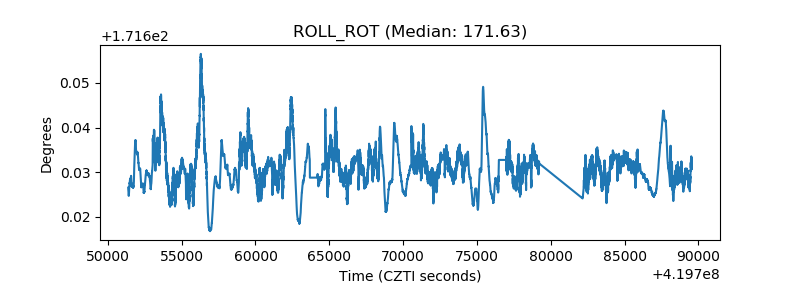 |
| _Roll_DEC | 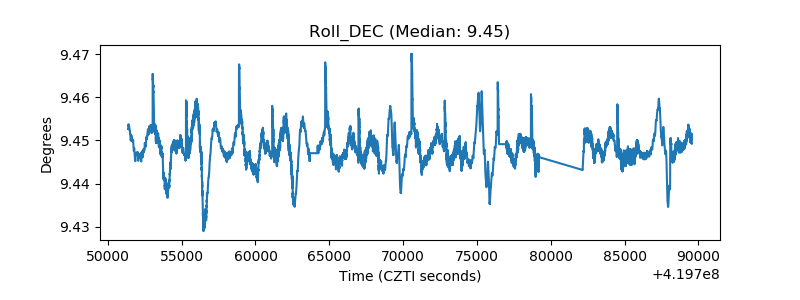 |
| _Roll_RA | 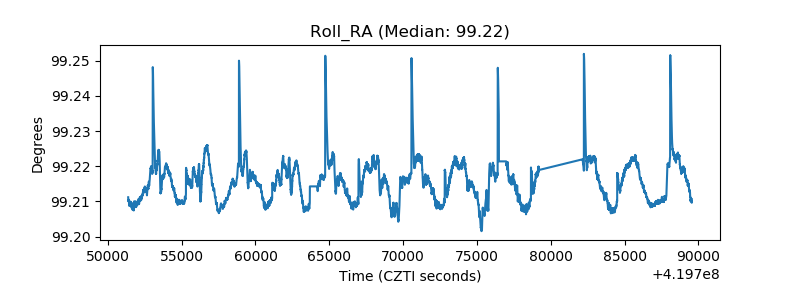 |
| Veto Counter | 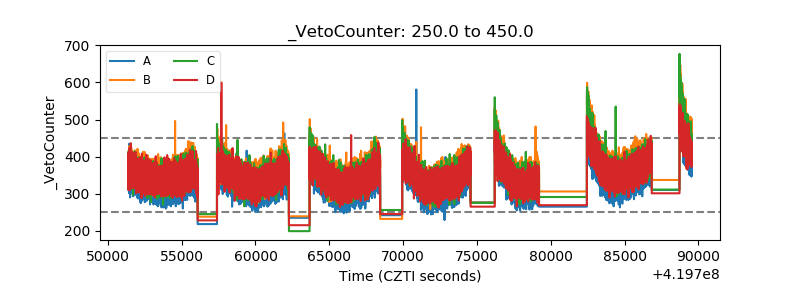 |