| Param | Original file | Final file |
|---|---|---|
| Filename | modeM0/AS1A12_097T01_9000005574_40894cztM0_level2.fits | modeM0/AS1A12_097T01_9000005574_40894cztM0_level2_quad_clean.evt |
| Size (bytes) | 356,535,360 | 88,361,280 |
| Size | 340.0 MB | 84.3 MB |
| Events in quadrant A | 2,839,105 | 600,916 |
| Events in quadrant B | 3,377,505 | 606,444 |
| Events in quadrant C | 2,775,602 | 586,090 |
| Events in quadrant D | 3,810,546 | 526,792 |
| Mode M9 | |||
|---|---|---|---|
| Quadrant | BADHDUFLAG | Total packets | Discarded packets |
| A | 0 | 21 | 0 |
| B | 0 | 21 | 0 |
| C | 0 | 21 | 0 |
| D | 0 | 22 | 0 |
| Mode SS | |||
|---|---|---|---|
| Quadrant | BADHDUFLAG | Total packets | Discarded packets |
| A | 0 | 102 | 0 |
| B | 0 | 102 | 0 |
| C | 0 | 102 | 0 |
| D | 0 | 102 | 0 |
| Mode M0 | |||
|---|---|---|---|
| Quadrant | BADHDUFLAG | Total packets | Discarded packets |
| A | 0 | 11484 | 3 |
| B | 0 | 13354 | 2 |
| C | 0 | 11270 | 2 |
| D | 0 | 14787 | 2 |
| Quadrant | Total seconds | Saturated seconds | Saturation percentage |
|---|---|---|---|
| A | 5076 | 17 | 0.334909% |
| B | 5076 | 226 | 4.452325% |
| C | 5076 | 67 | 1.319937% |
| D | 5076 | 185 | 3.644602% |
Noise dominated data is calculated using 1-second bins in cleaned event files. If a bin has >2000 counts, and if more than 50% of those come from <1% of pixels, then it is considered to be noise-dominated and hence unusable.
| Quadrant | # 1 sec bins | Bins with >0 counts | Bins with >2000 counts | High rate bins dominated by noise | Noise dominated (total time) | Noise dominated (detector-on time) | Marked lightcurve |
|---|---|---|---|---|---|---|---|
| A | 7079 | 5077 | 4 | 4 | 0.06% | 0.08% | 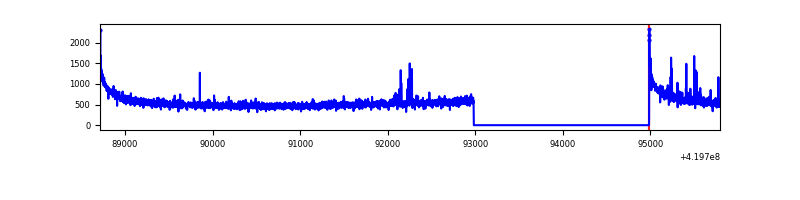 |
| B | 7079 | 5077 | 154 | 154 | 2.18% | 3.03% | 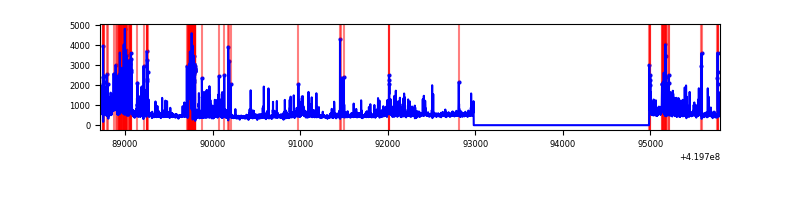 |
| C | 7079 | 5077 | 61 | 61 | 0.86% | 1.20% | 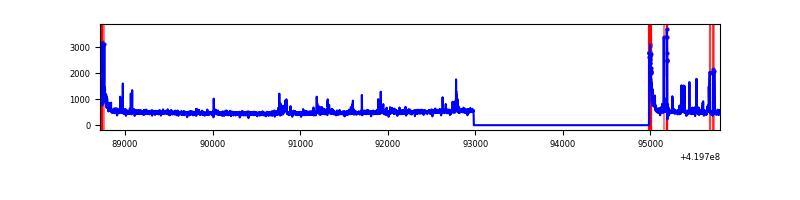 |
| D | 7079 | 5077 | 153 | 153 | 2.16% | 3.01% | 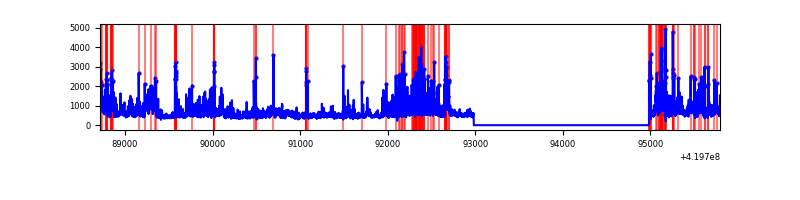 |
Top three noisy pixels from each quadrant. If the there are fewer than three noisy pixels in the level2.evt file, extra rows are filled as -1
| Pixel properties | Quadrant properties | ||||||
|---|---|---|---|---|---|---|---|
| Quadrant | DetID | PixID | Counts | Sigma | Mean | Median | Sigma |
| A | 10 | 83 | 525680 | 4450.08 | 577 | 566 | 118.0 |
| A | 2 | 79 | 49853 | 417.68 | 577 | 566 | 118.0 |
| A | 12 | 189 | 13066 | 105.93 | 577 | 566 | 118.0 |
| B | 4 | 171 | 450536 | 4118.59 | 573 | 558 | 109.3 |
| B | 5 | 255 | 322548 | 2947.13 | 573 | 558 | 109.3 |
| B | 5 | 32 | 246851 | 2254.29 | 573 | 558 | 109.3 |
| C | 15 | 214 | 215080 | 1634.68 | 562 | 568 | 131.2 |
| C | 14 | 254 | 178160 | 1353.34 | 562 | 568 | 131.2 |
| C | 0 | 10 | 146155 | 1109.44 | 562 | 568 | 131.2 |
| D | 12 | 79 | 744871 | 5541.98 | 551 | 536 | 134.3 |
| D | 13 | 249 | 284298 | 2112.76 | 551 | 536 | 134.3 |
| D | 12 | 128 | 188120 | 1396.66 | 551 | 536 | 134.3 |
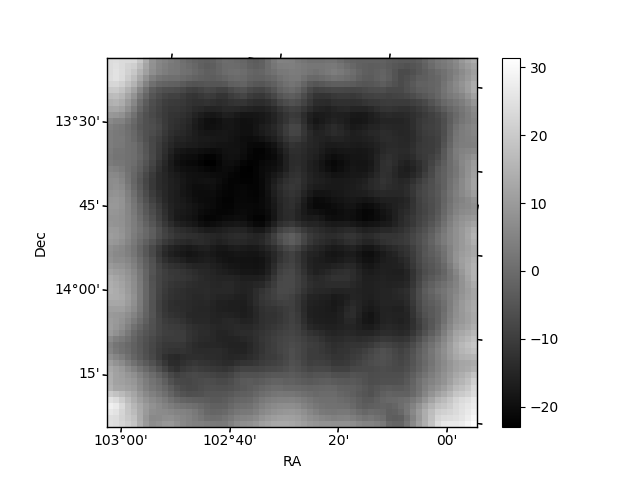
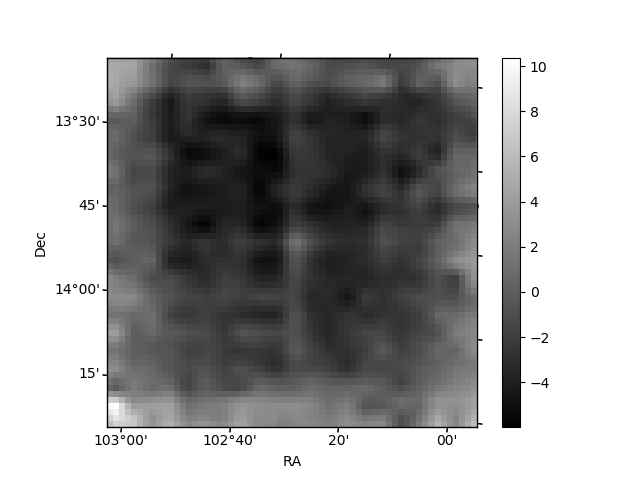
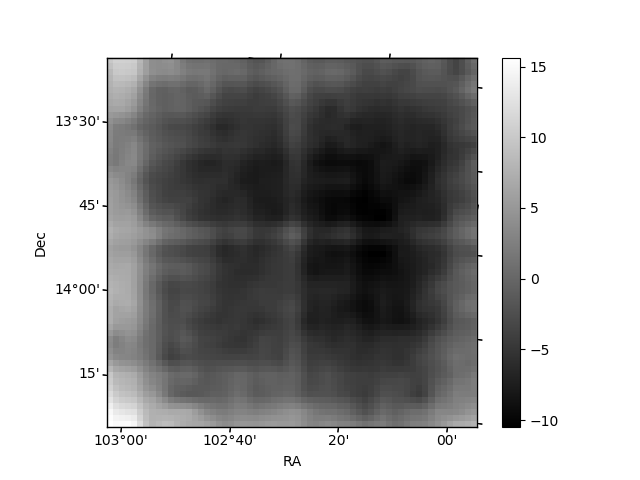
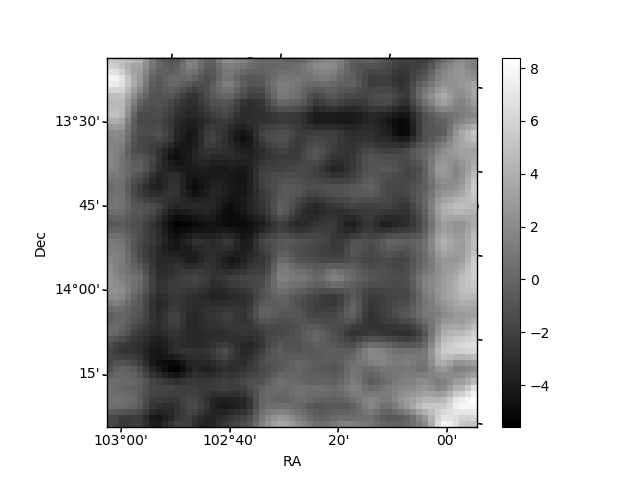
Histogram calculated using DETX and DETY for each event in the final _common_clean file
| Quadrant A | 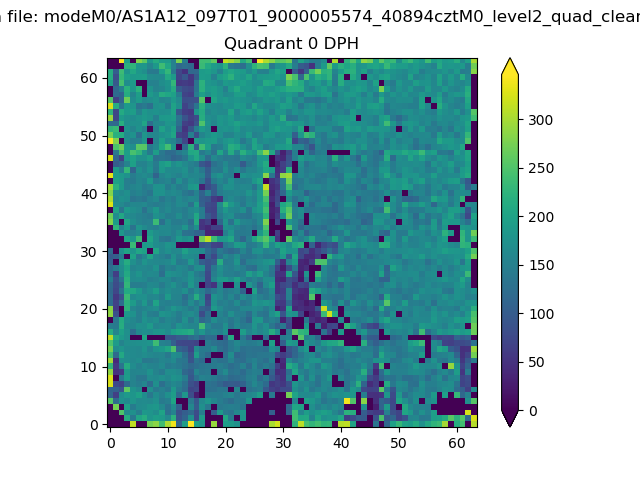 |
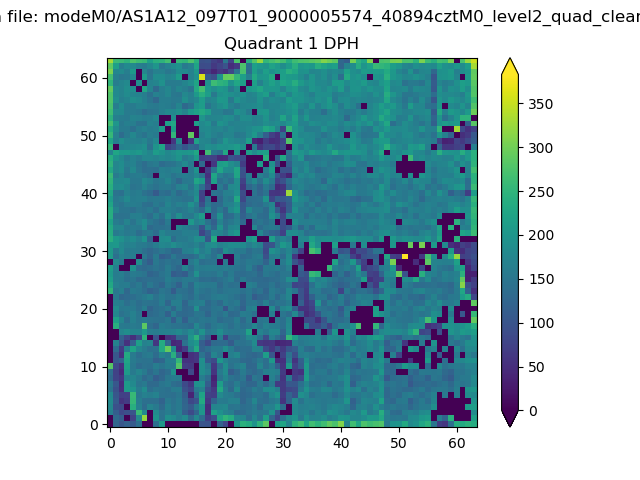 |
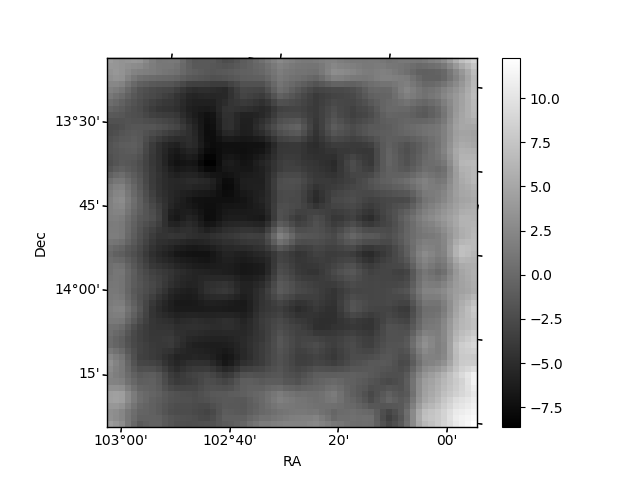
Quadrant B |
|---|---|---|---|
| Quadrant D | 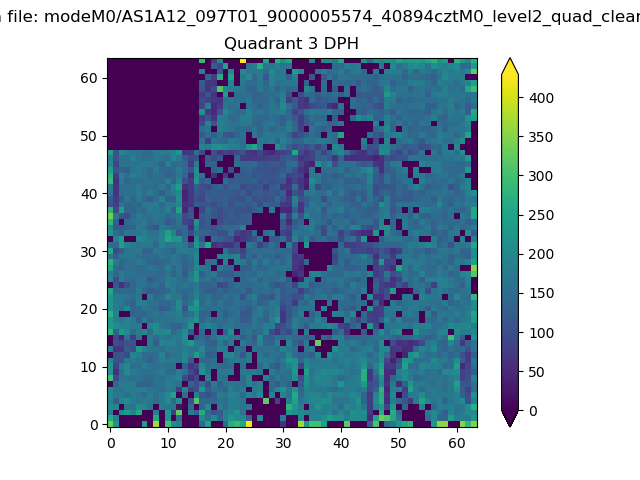 |
 |
Quadrant C |
| Plot type | Count rate plots | Images |
|---|---|---|
| Comparison with Poisson distribution Blue bars denote a histogram of data divided into 1 sec bins. Red curve is a Poisson curve with rate = median count rate of data. |
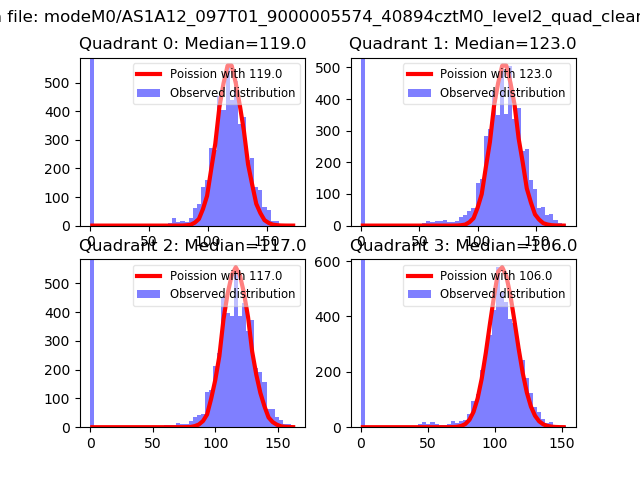 |
 |
| Quadrant-wise count rates Data is divided into 100 sec bins |
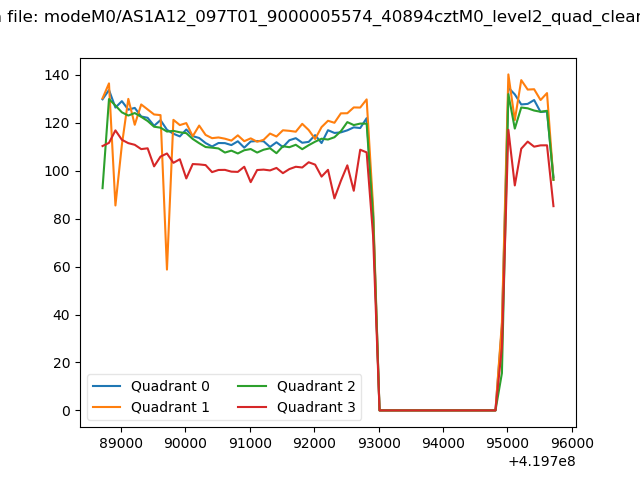 |
|
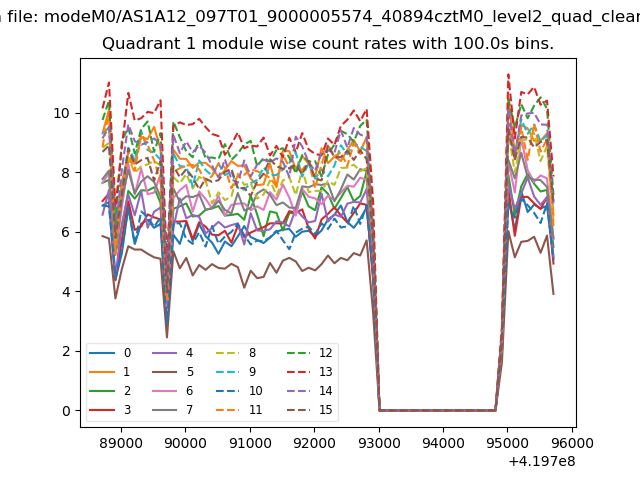
| Module-wise count rates for Quadrant A Data is divided into 100 sec bins |
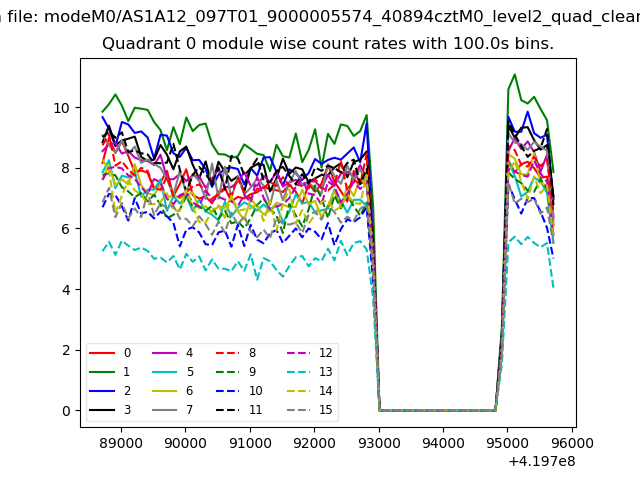 |
 |
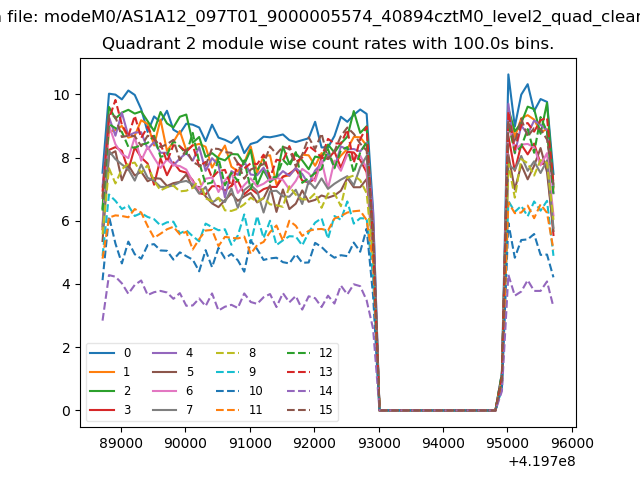
| Module-wise count rates for Quadrant B Data is divided into 100 sec bins |
 |
 |
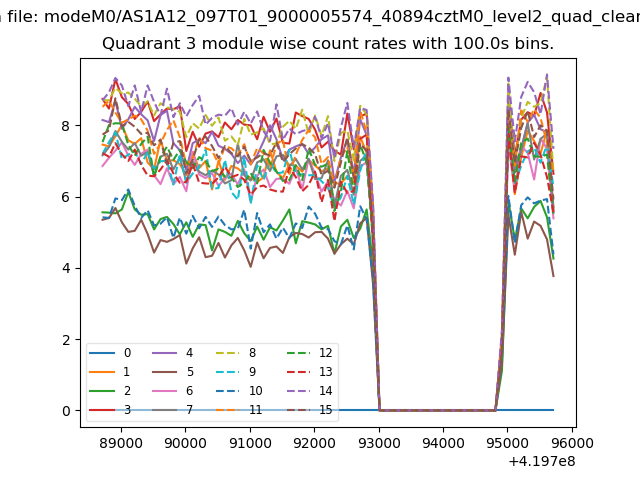
| Module-wise count rates for Quadrant C Data is divided into 100 sec bins |
 |
 |
| Module-wise count rates for Quadrant D Data is divided into 100 sec bins |
 |
 |
| Parameter | Plot |
|---|---|
| CZT HV Monitor | 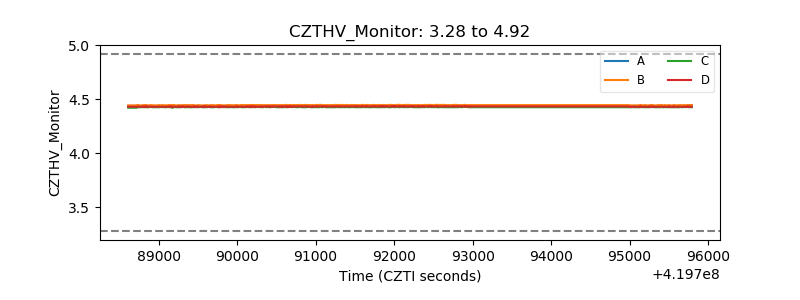 |
| D_VDD | 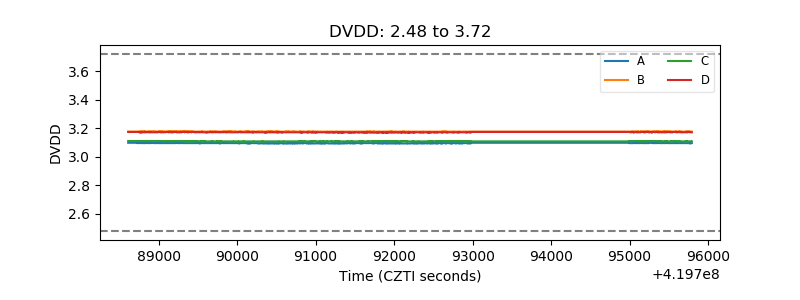 |
| Temperature 1 | 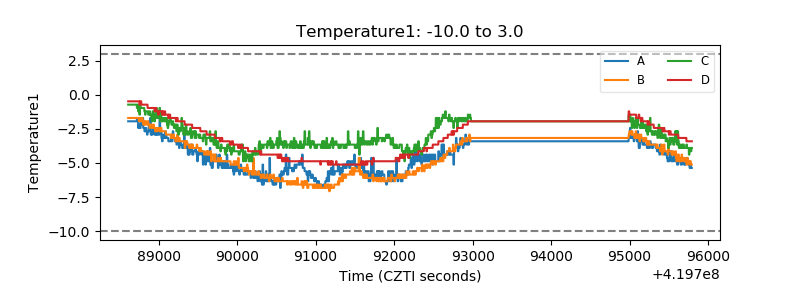 |
| Veto HV Monitor | 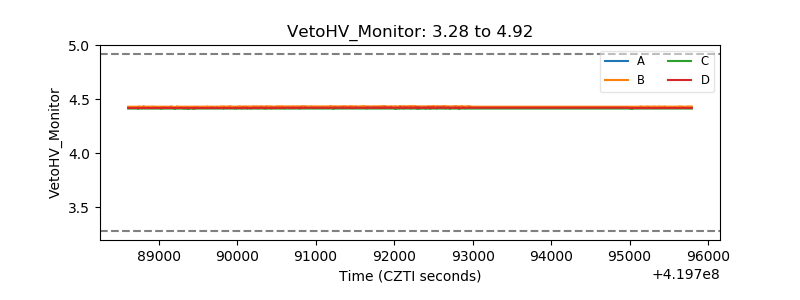 |
| Veto LLD | 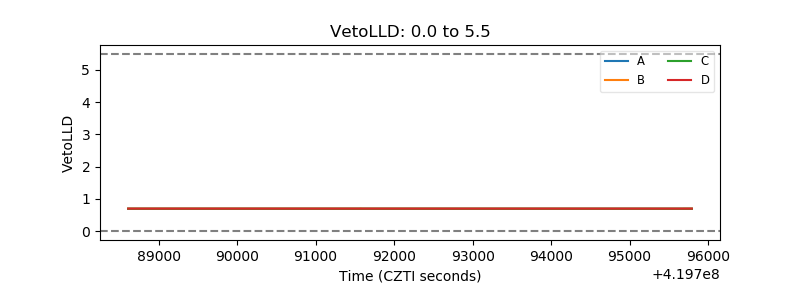 |
| Alpha Counter | 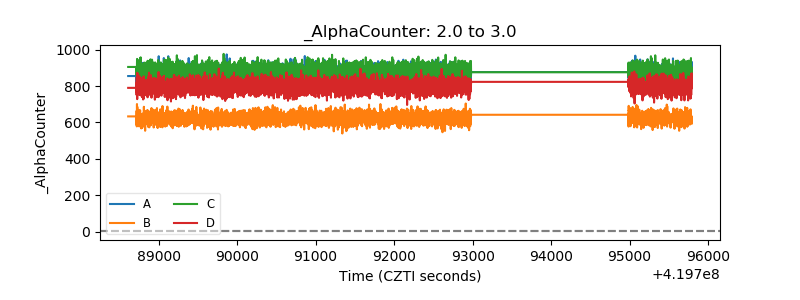 |
| _CPM_Rate | 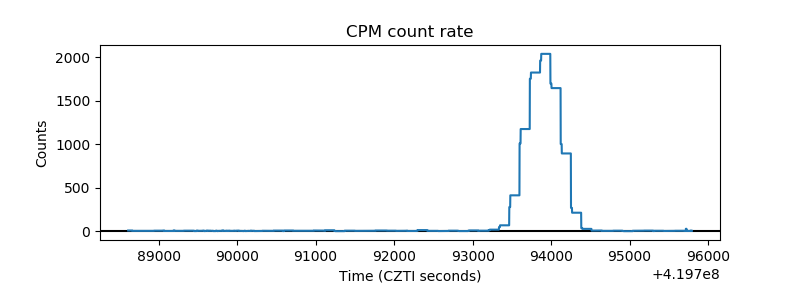 |
| CZT Counter | 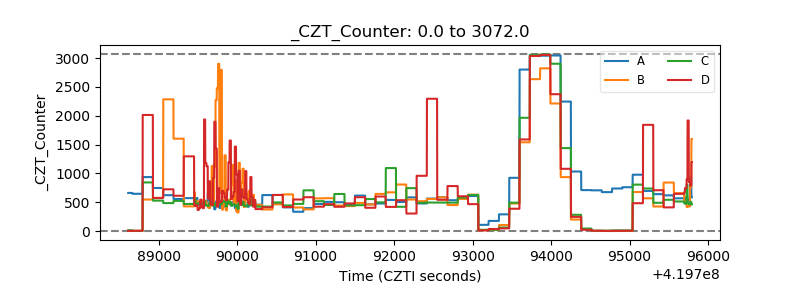 |
| +2.5 Volts monitor | 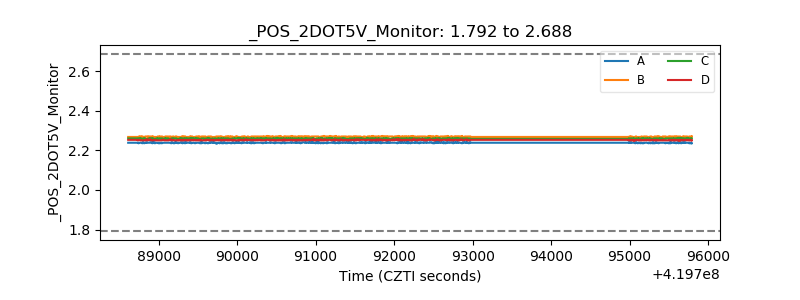 |
| +5 Volts monitor | 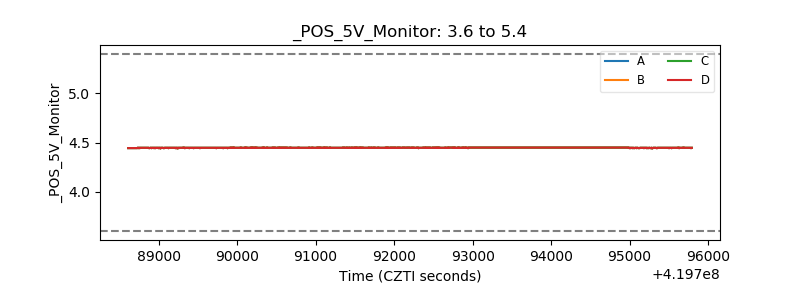 |
| _ROLL_ROT | 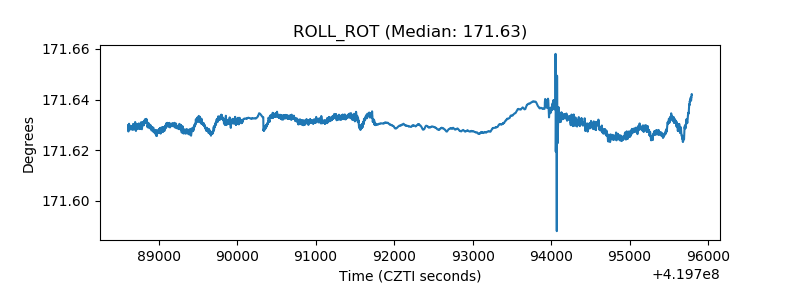 |
| _Roll_DEC | 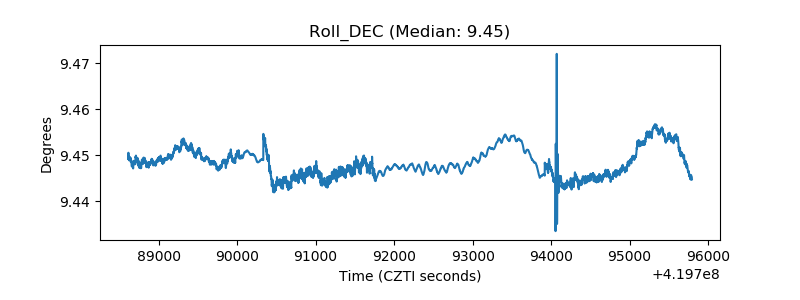 |
| _Roll_RA | 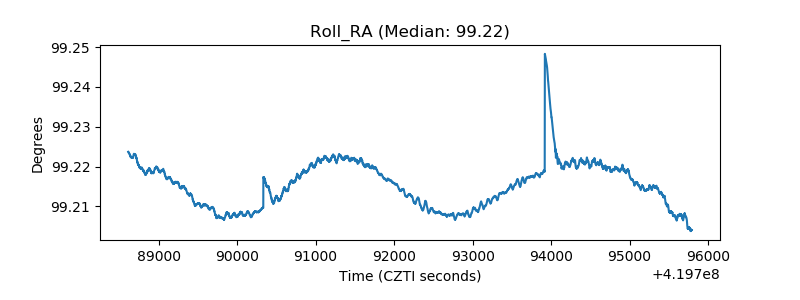 |
| Veto Counter | 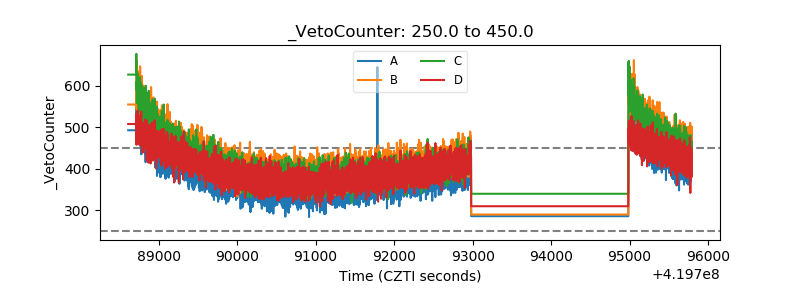 |