| Param | Original file | Final file |
|---|---|---|
| Filename | modeM0/AS1A12_097T01_9000005574_40895cztM0_level2.fits | modeM0/AS1A12_097T01_9000005574_40895cztM0_level2_quad_clean.evt |
| Size (bytes) | 364,947,840 | 86,016,960 |
| Size | 348.0 MB | 82.0 MB |
| Events in quadrant A | 2,799,820 | 586,984 |
| Events in quadrant B | 3,279,353 | 603,190 |
| Events in quadrant C | 2,947,077 | 570,358 |
| Events in quadrant D | 4,100,938 | 499,690 |
| Mode M9 | |||
|---|---|---|---|
| Quadrant | BADHDUFLAG | Total packets | Discarded packets |
| A | 0 | 30 | 0 |
| B | 0 | 30 | 0 |
| C | 0 | 30 | 0 |
| D | 0 | 31 | 0 |
| Mode SS | |||
|---|---|---|---|
| Quadrant | BADHDUFLAG | Total packets | Discarded packets |
| A | 0 | 100 | 0 |
| B | 0 | 100 | 0 |
| C | 0 | 100 | 0 |
| D | 0 | 100 | 0 |
| Mode M0 | |||
|---|---|---|---|
| Quadrant | BADHDUFLAG | Total packets | Discarded packets |
| A | 0 | 11279 | 3 |
| B | 0 | 12954 | 2 |
| C | 0 | 11731 | 2 |
| D | 0 | 15490 | 2 |
| Quadrant | Total seconds | Saturated seconds | Saturation percentage |
|---|---|---|---|
| A | 4912 | 13 | 0.264658% |
| B | 4912 | 156 | 3.175896% |
| C | 4912 | 96 | 1.954397% |
| D | 4912 | 311 | 6.331433% |
Noise dominated data is calculated using 1-second bins in cleaned event files. If a bin has >2000 counts, and if more than 50% of those come from <1% of pixels, then it is considered to be noise-dominated and hence unusable.
| Quadrant | # 1 sec bins | Bins with >0 counts | Bins with >2000 counts | High rate bins dominated by noise | Noise dominated (total time) | Noise dominated (detector-on time) | Marked lightcurve |
|---|---|---|---|---|---|---|---|
| A | 7005 | 4913 | 6 | 6 | 0.09% | 0.12% | 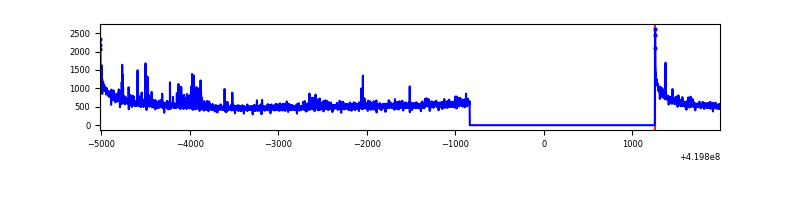 |
| B | 7005 | 4913 | 92 | 92 | 1.31% | 1.87% | 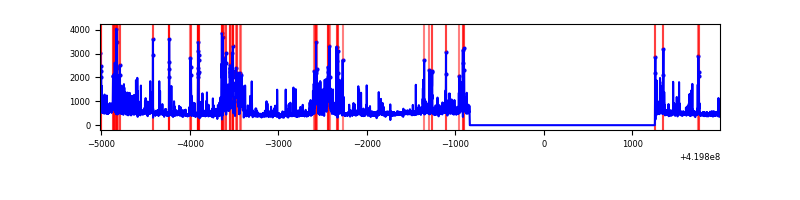 |
| C | 7005 | 4913 | 89 | 89 | 1.27% | 1.81% | 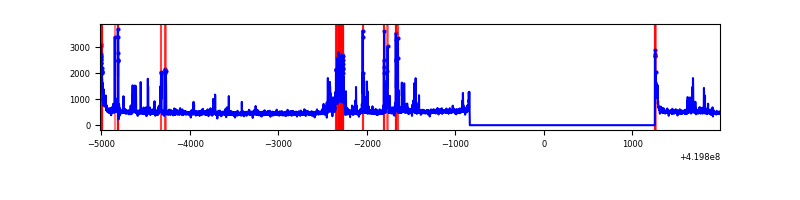 |
| D | 7005 | 4913 | 276 | 276 | 3.94% | 5.62% | 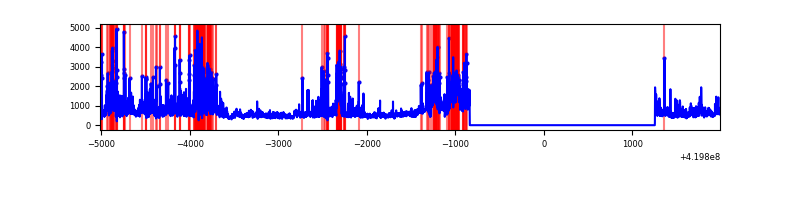 |
Top three noisy pixels from each quadrant. If the there are fewer than three noisy pixels in the level2.evt file, extra rows are filled as -1
| Pixel properties | Quadrant properties | ||||||
|---|---|---|---|---|---|---|---|
| Quadrant | DetID | PixID | Counts | Sigma | Mean | Median | Sigma |
| A | 10 | 83 | 491900 | 4242.69 | 563 | 553 | 115.8 |
| A | 2 | 79 | 81182 | 696.22 | 563 | 553 | 115.8 |
| A | 12 | 189 | 24159 | 203.83 | 563 | 553 | 115.8 |
| B | 4 | 171 | 806469 | 7431.26 | 565 | 549 | 108.4 |
| B | 5 | 255 | 82383 | 754.58 | 565 | 549 | 108.4 |
| B | 5 | 32 | 62924 | 575.15 | 565 | 549 | 108.4 |
| C | 14 | 254 | 475926 | 3703.91 | 550 | 554 | 128.3 |
| C | 15 | 214 | 206015 | 1600.87 | 550 | 554 | 128.3 |
| C | 0 | 10 | 112389 | 871.37 | 550 | 554 | 128.3 |
| D | 12 | 79 | 808240 | 6151.43 | 532 | 517 | 131.3 |
| D | 12 | 128 | 763423 | 5810.12 | 532 | 517 | 131.3 |
| D | 2 | 249 | 280837 | 2134.85 | 532 | 517 | 131.3 |
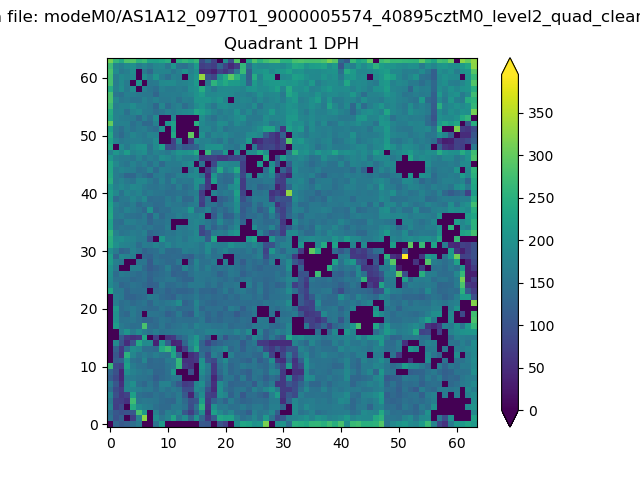
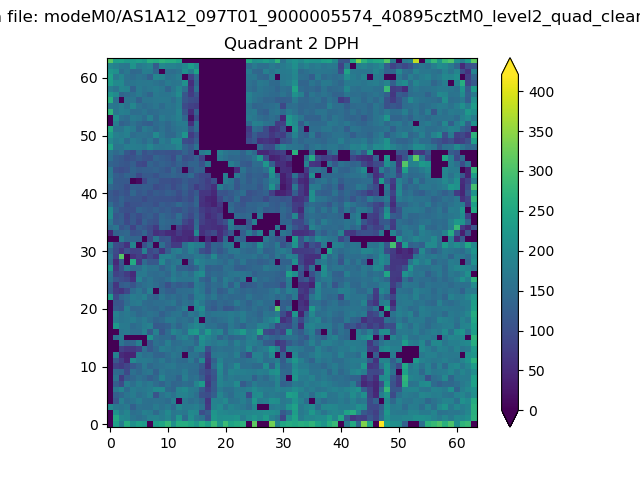
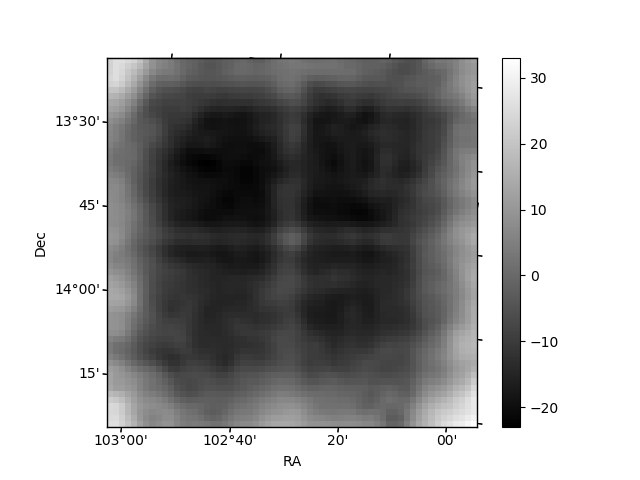
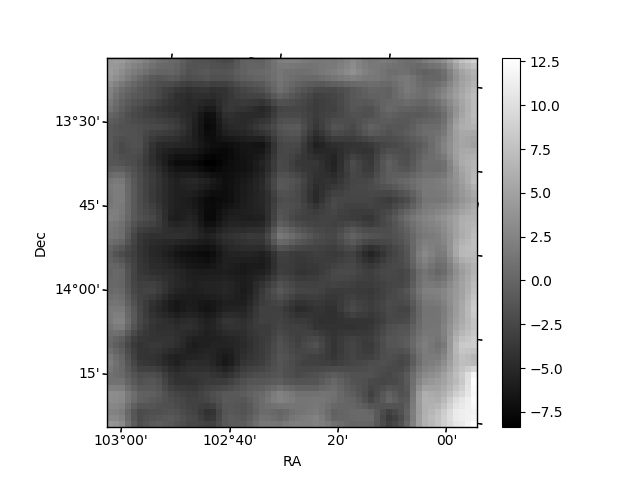
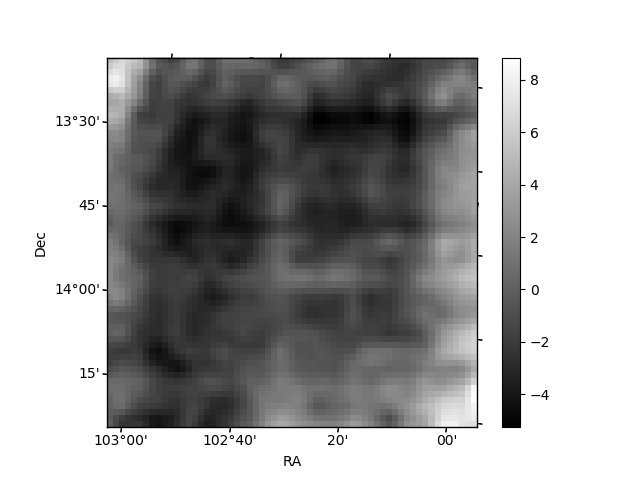
Histogram calculated using DETX and DETY for each event in the final _common_clean file
| Quadrant A |  |
 |
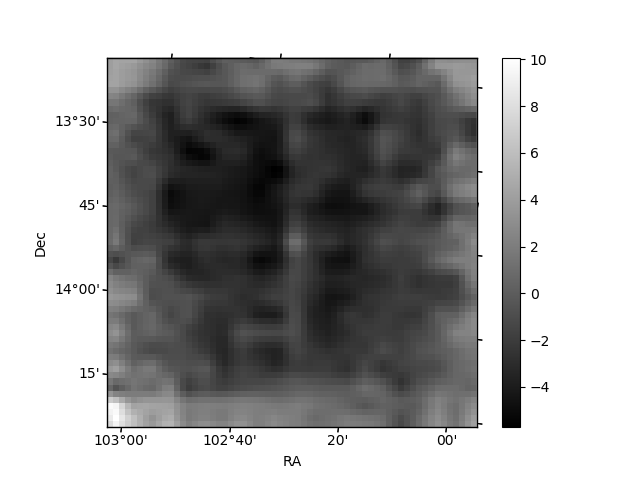
Quadrant B |
|---|---|---|---|
| Quadrant D | 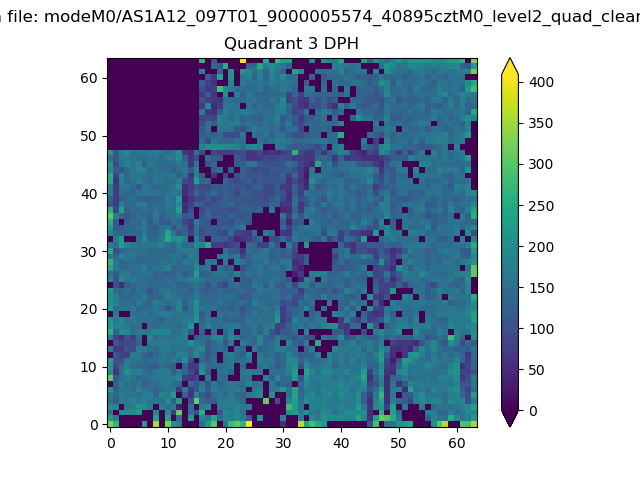 |
 |
Quadrant C |
| Plot type | Count rate plots | Images |
|---|---|---|
| Comparison with Poisson distribution Blue bars denote a histogram of data divided into 1 sec bins. Red curve is a Poisson curve with rate = median count rate of data. |
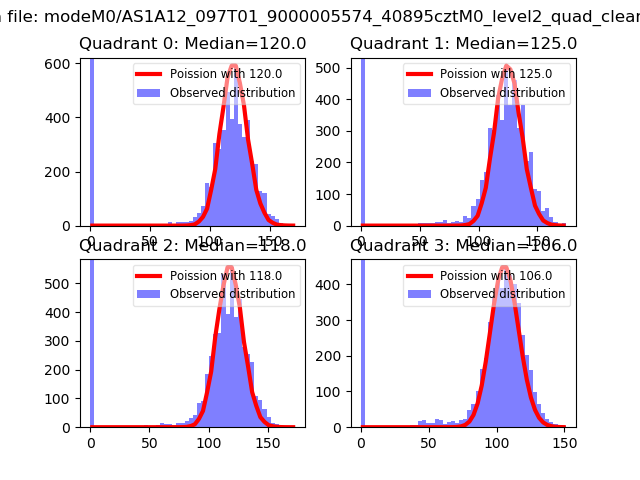 |
 |
| Quadrant-wise count rates Data is divided into 100 sec bins |
 |
|
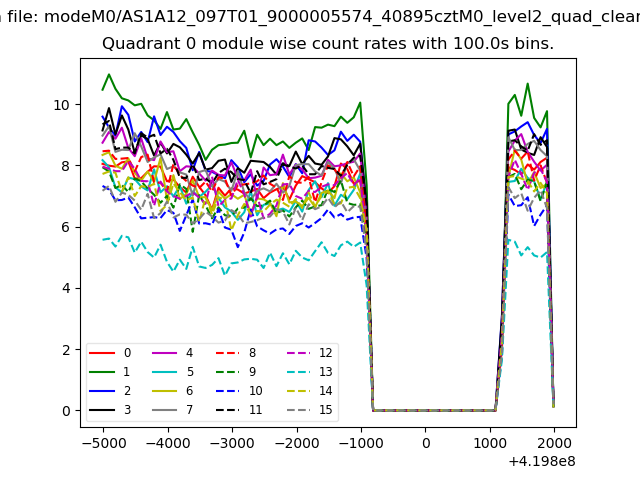
| Module-wise count rates for Quadrant A Data is divided into 100 sec bins |
 |
 |
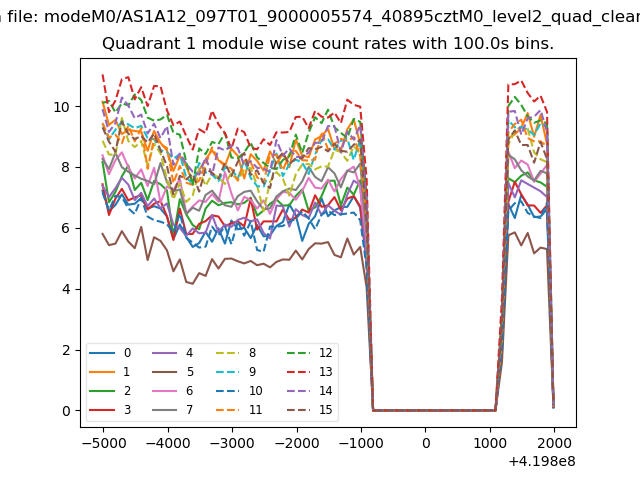
| Module-wise count rates for Quadrant B Data is divided into 100 sec bins |
 |
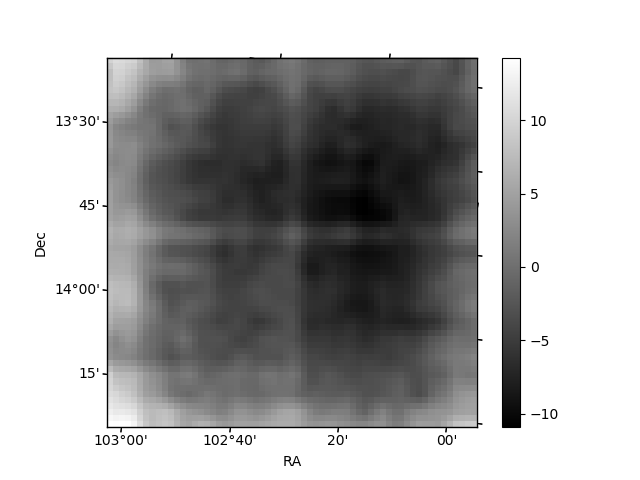 |
| Module-wise count rates for Quadrant C Data is divided into 100 sec bins |
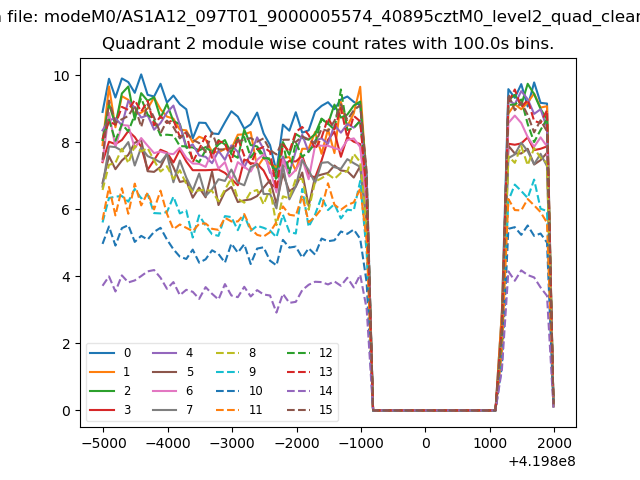 |
 |
| Module-wise count rates for Quadrant D Data is divided into 100 sec bins |
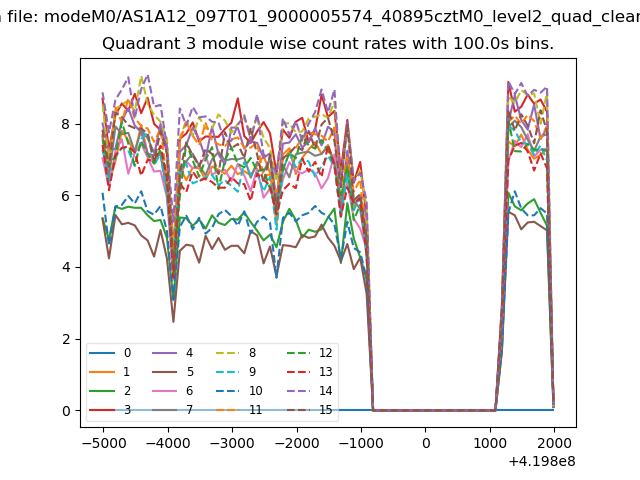 |
 |
| Parameter | Plot |
|---|---|
| CZT HV Monitor | 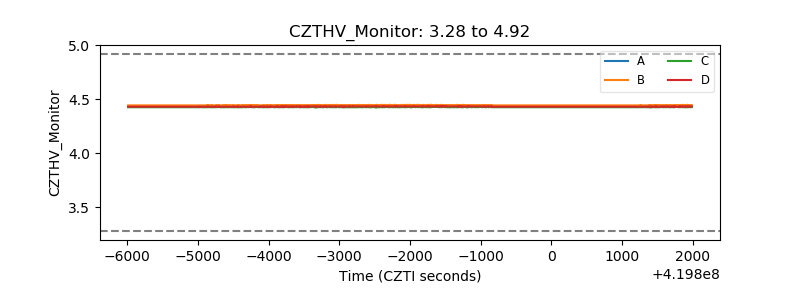 |
| D_VDD | 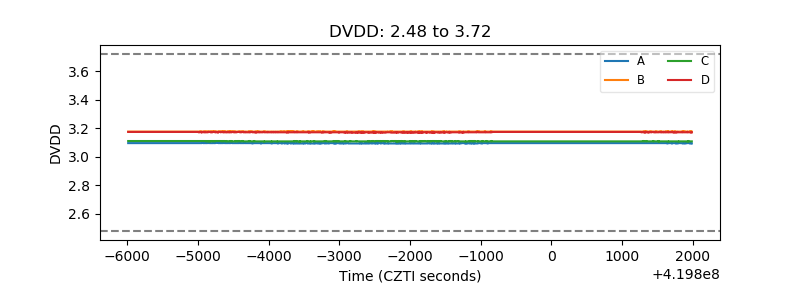 |
| Temperature 1 | 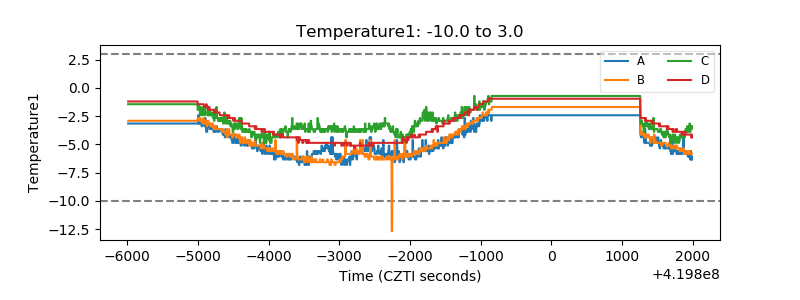 |
| Veto HV Monitor | 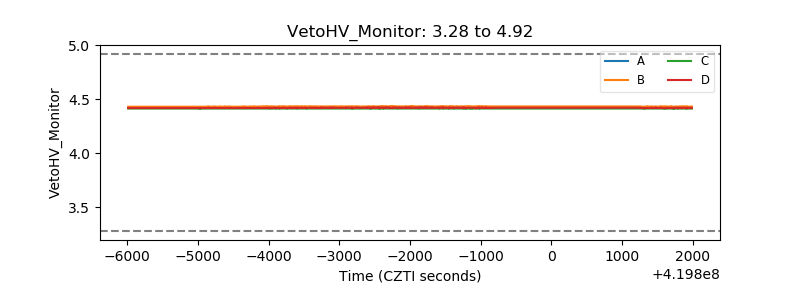 |
| Veto LLD | 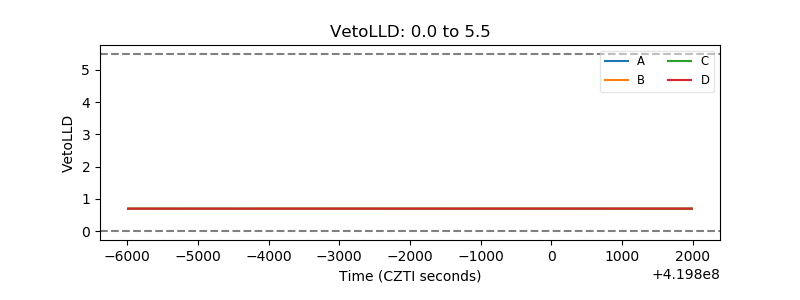 |
| Alpha Counter | 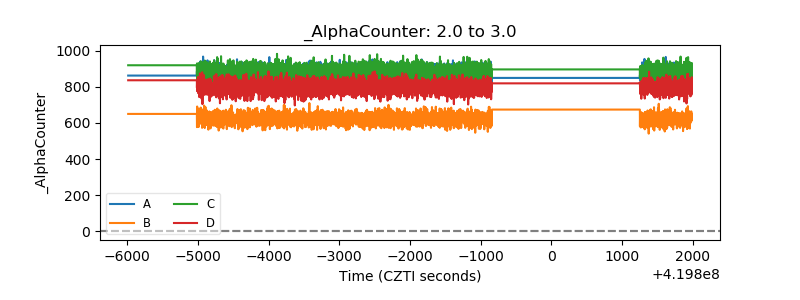 |
| _CPM_Rate | 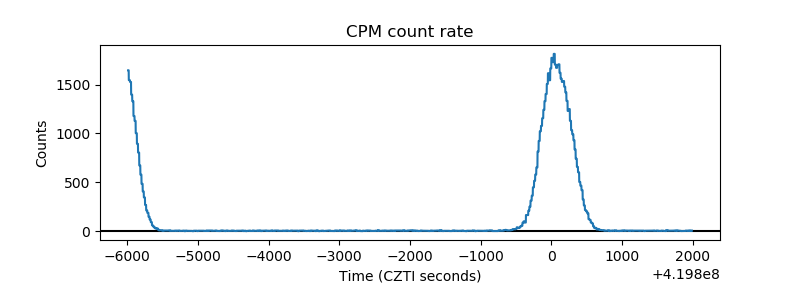 |
| CZT Counter | 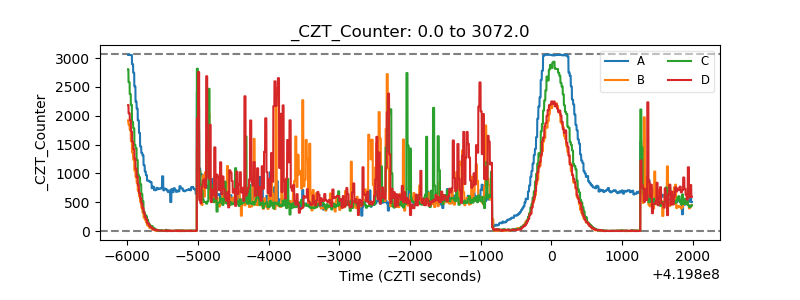 |
| +2.5 Volts monitor |  |
| +5 Volts monitor | 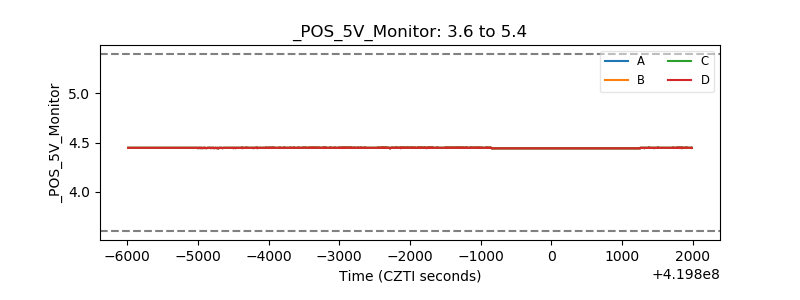 |
| _ROLL_ROT | 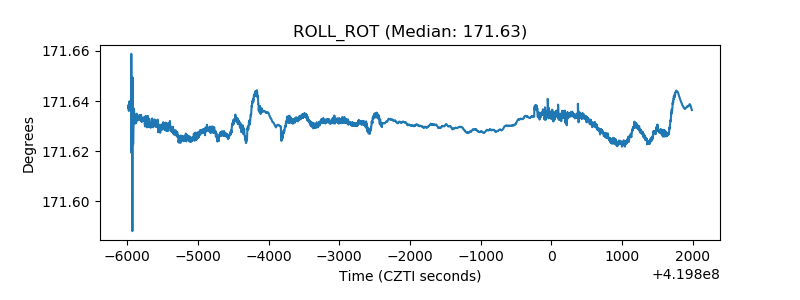 |
| _Roll_DEC | 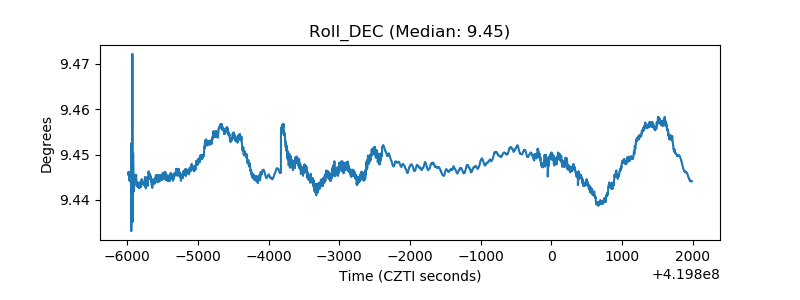 |
| _Roll_RA | 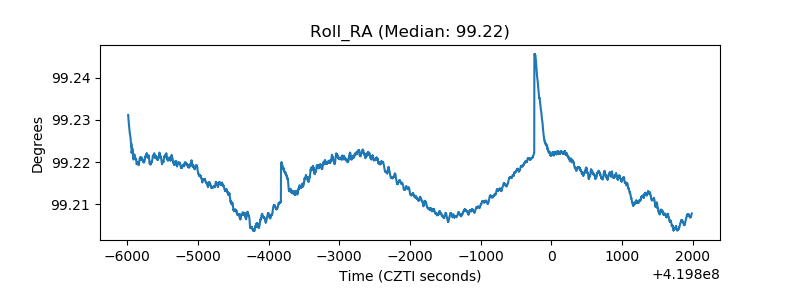 |
| Veto Counter | 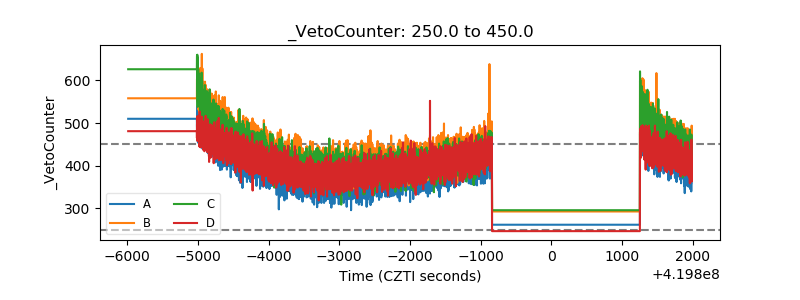 |