| Param | Original file | Final file |
|---|---|---|
| Filename | modeM0/AS1A12_097T01_9000005574_40896cztM0_level2.fits | modeM0/AS1A12_097T01_9000005574_40896cztM0_level2_quad_clean.evt |
| Size (bytes) | 312,719,040 | 84,000,960 |
| Size | 298.2 MB | 80.1 MB |
| Events in quadrant A | 2,636,637 | 565,726 |
| Events in quadrant B | 2,668,201 | 586,749 |
| Events in quadrant C | 2,675,932 | 552,998 |
| Events in quadrant D | 3,218,107 | 498,601 |
| Mode M9 | |||
|---|---|---|---|
| Quadrant | BADHDUFLAG | Total packets | Discarded packets |
| A | 0 | 30 | 0 |
| B | 0 | 30 | 0 |
| C | 0 | 30 | 0 |
| D | 0 | 31 | 0 |
| Mode SS | |||
|---|---|---|---|
| Quadrant | BADHDUFLAG | Total packets | Discarded packets |
| A | 0 | 98 | 0 |
| B | 0 | 98 | 0 |
| C | 0 | 98 | 0 |
| D | 0 | 98 | 0 |
| Mode M0 | |||
|---|---|---|---|
| Quadrant | BADHDUFLAG | Total packets | Discarded packets |
| A | 0 | 10708 | 3 |
| B | 0 | 11030 | 2 |
| C | 0 | 10841 | 2 |
| D | 0 | 12772 | 2 |
| Quadrant | Total seconds | Saturated seconds | Saturation percentage |
|---|---|---|---|
| A | 4839 | 12 | 0.247985% |
| B | 4839 | 76 | 1.570572% |
| C | 4839 | 82 | 1.694565% |
| D | 4839 | 106 | 2.190535% |
Noise dominated data is calculated using 1-second bins in cleaned event files. If a bin has >2000 counts, and if more than 50% of those come from <1% of pixels, then it is considered to be noise-dominated and hence unusable.
| Quadrant | # 1 sec bins | Bins with >0 counts | Bins with >2000 counts | High rate bins dominated by noise | Noise dominated (total time) | Noise dominated (detector-on time) | Marked lightcurve |
|---|---|---|---|---|---|---|---|
| A | 6991 | 4840 | 5 | 5 | 0.07% | 0.10% | 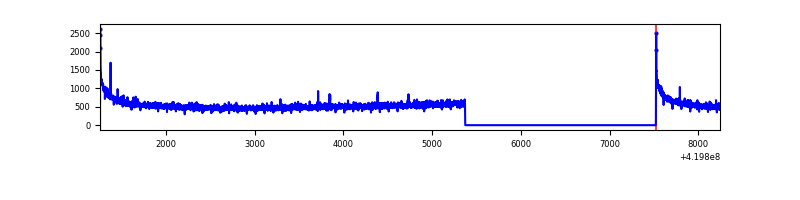 |
| B | 6991 | 4840 | 43 | 43 | 0.62% | 0.89% | 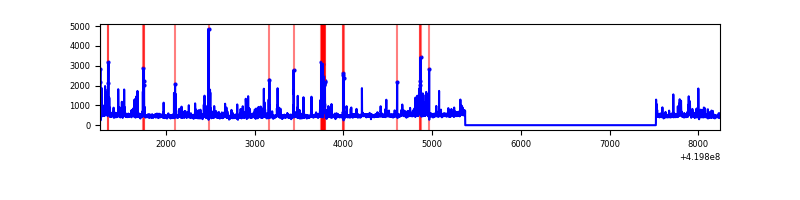 |
| C | 6991 | 4840 | 70 | 70 | 1.00% | 1.45% | 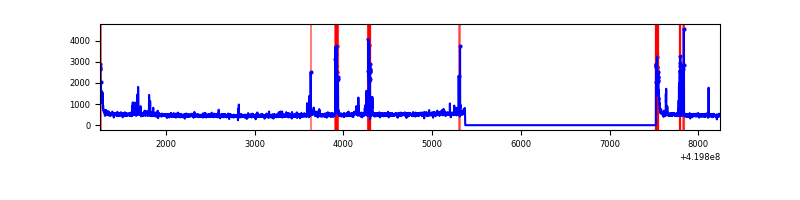 |
| D | 6991 | 4840 | 85 | 85 | 1.22% | 1.76% | 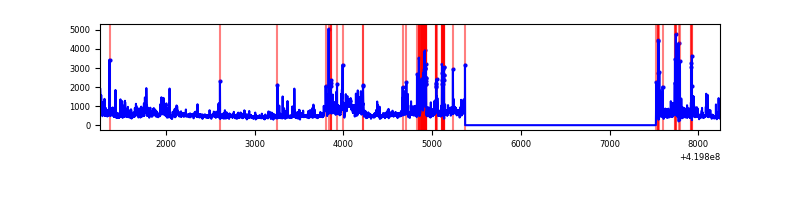 |
Top three noisy pixels from each quadrant. If the there are fewer than three noisy pixels in the level2.evt file, extra rows are filled as -1
| Pixel properties | Quadrant properties | ||||||
|---|---|---|---|---|---|---|---|
| Quadrant | DetID | PixID | Counts | Sigma | Mean | Median | Sigma |
| A | 10 | 83 | 474235 | 4140.43 | 550 | 539 | 114.4 |
| A | 13 | 6 | 12926 | 108.27 | 550 | 539 | 114.4 |
| A | 13 | 248 | 9729 | 80.33 | 550 | 539 | 114.4 |
| B | 4 | 171 | 355882 | 3373.78 | 551 | 538 | 105.3 |
| B | 5 | 255 | 68666 | 646.83 | 551 | 538 | 105.3 |
| B | 0 | 190 | 31410 | 293.11 | 551 | 538 | 105.3 |
| C | 15 | 214 | 204509 | 1625.52 | 536 | 540 | 125.5 |
| C | 14 | 254 | 190725 | 1515.67 | 536 | 540 | 125.5 |
| C | 0 | 10 | 115446 | 915.74 | 536 | 540 | 125.5 |
| D | 12 | 79 | 390975 | 2991.7 | 526 | 511 | 130.5 |
| D | 13 | 171 | 389126 | 2977.53 | 526 | 511 | 130.5 |
| D | 1 | 47 | 76151 | 579.55 | 526 | 511 | 130.5 |
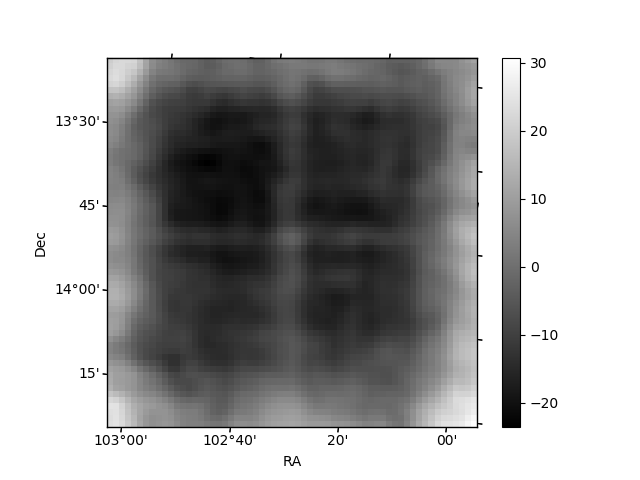
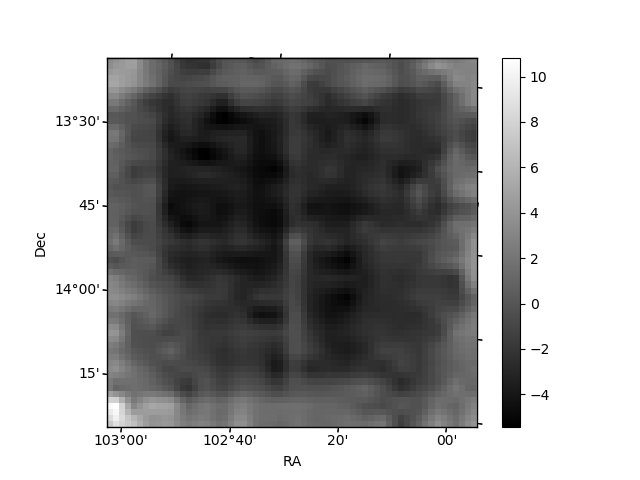
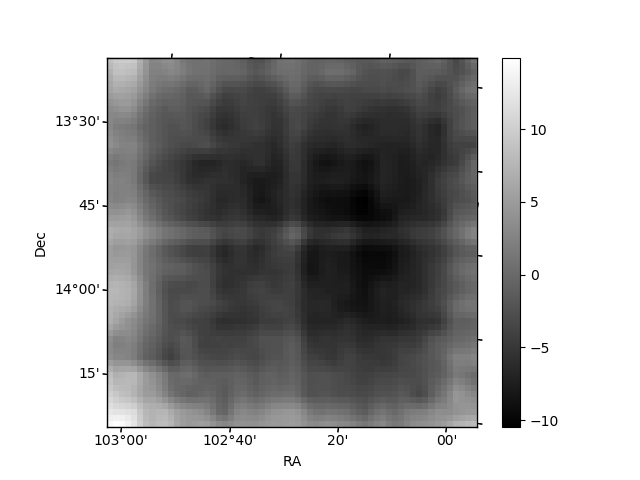
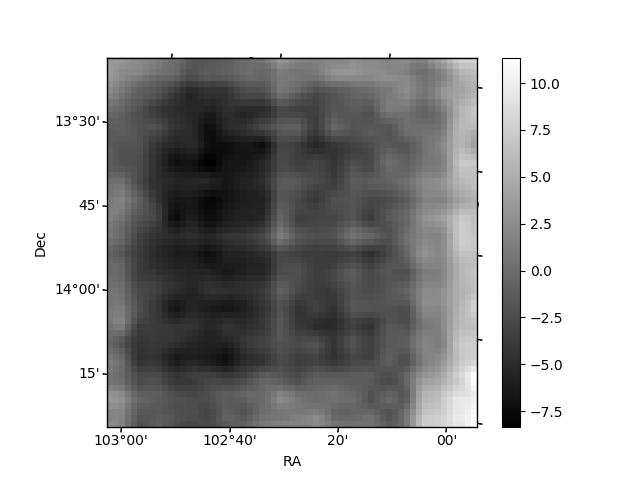
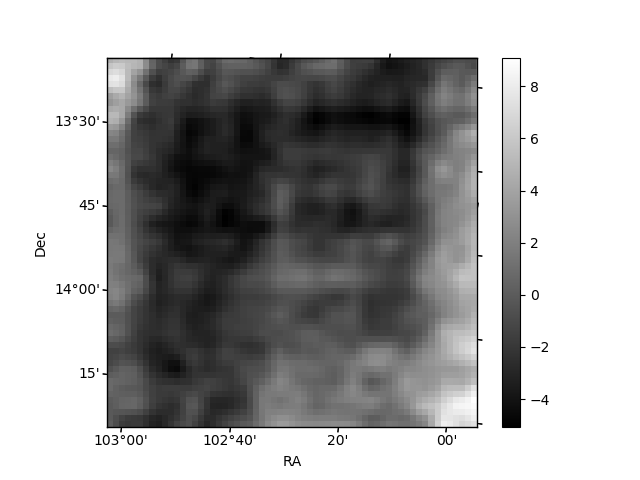
Histogram calculated using DETX and DETY for each event in the final _common_clean file
| Quadrant A | 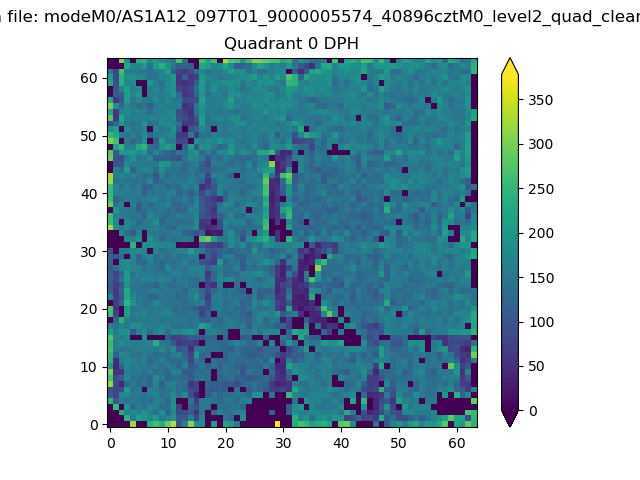 |
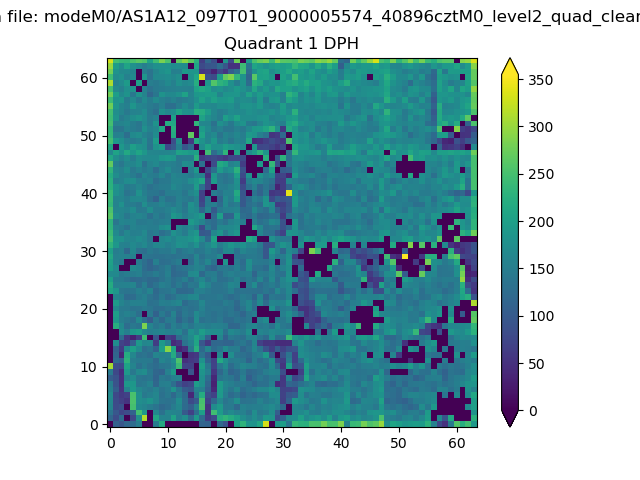 |
Quadrant B |
|---|---|---|---|
| Quadrant D | 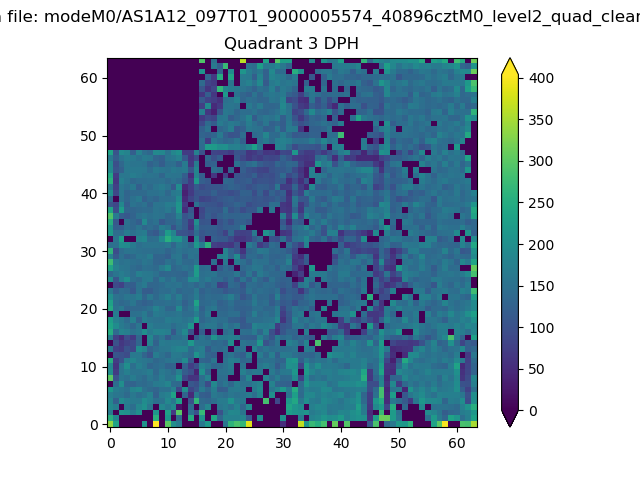 |
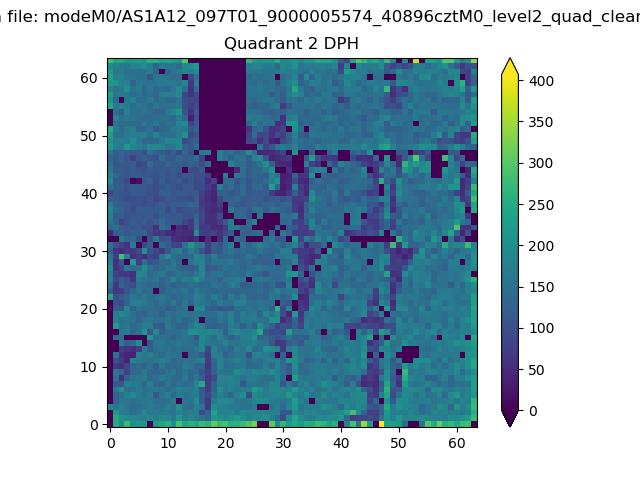 |
Quadrant C |
| Plot type | Count rate plots | Images |
|---|---|---|
| Comparison with Poisson distribution Blue bars denote a histogram of data divided into 1 sec bins. Red curve is a Poisson curve with rate = median count rate of data. |
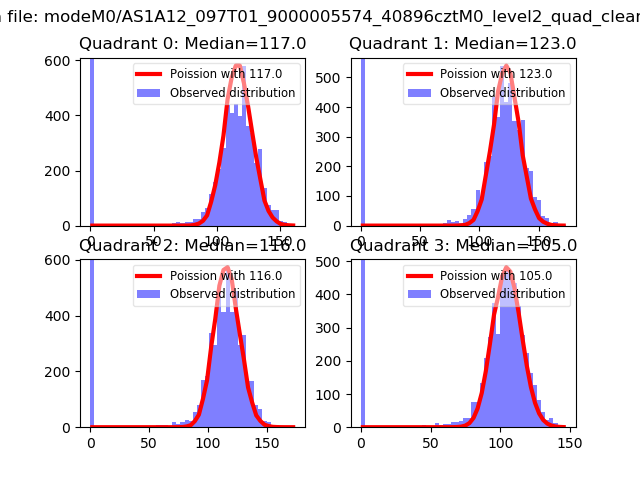 |
 |
| Quadrant-wise count rates Data is divided into 100 sec bins |
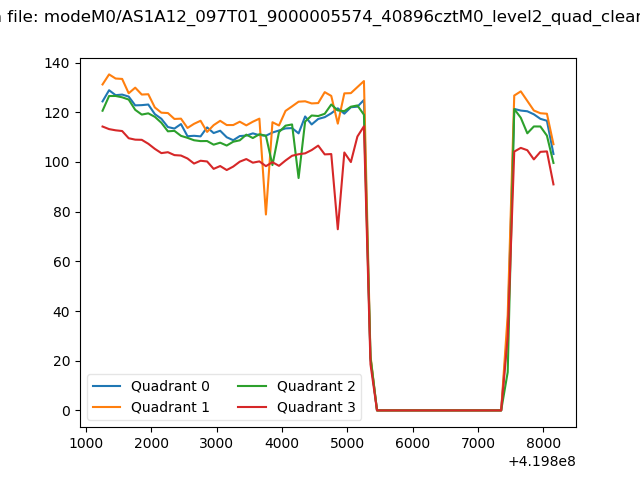 |
|
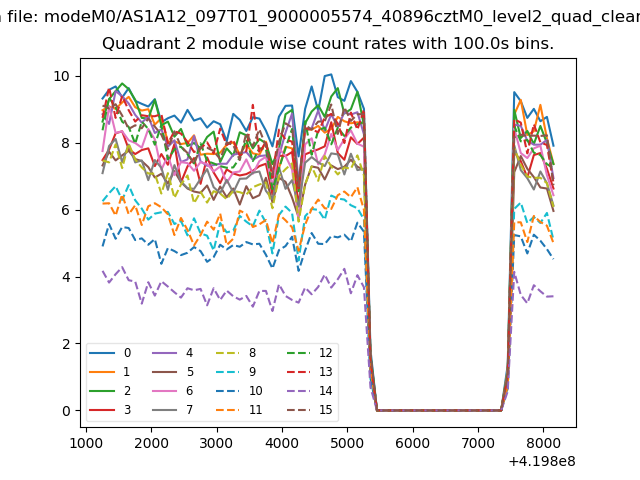
| Module-wise count rates for Quadrant A Data is divided into 100 sec bins |
 |
 |
| Module-wise count rates for Quadrant B Data is divided into 100 sec bins |
 |
 |
| Module-wise count rates for Quadrant C Data is divided into 100 sec bins |
 |
 |
| Module-wise count rates for Quadrant D Data is divided into 100 sec bins |
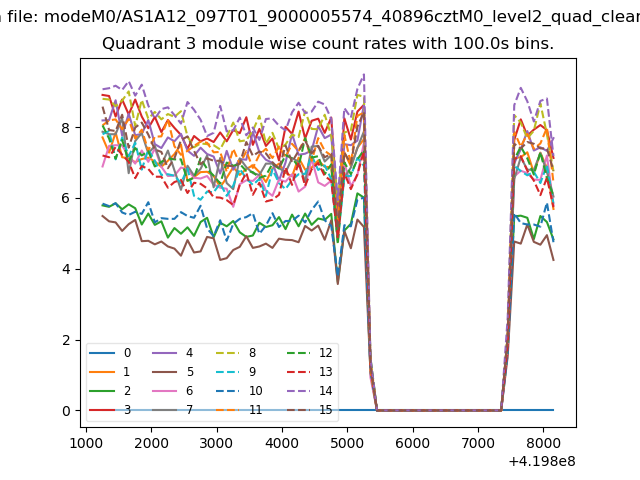 |
 |
| Parameter | Plot |
|---|---|
| CZT HV Monitor |  |
| D_VDD | 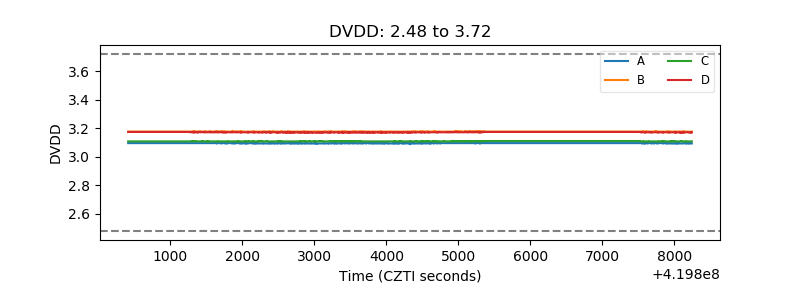 |
| Temperature 1 | 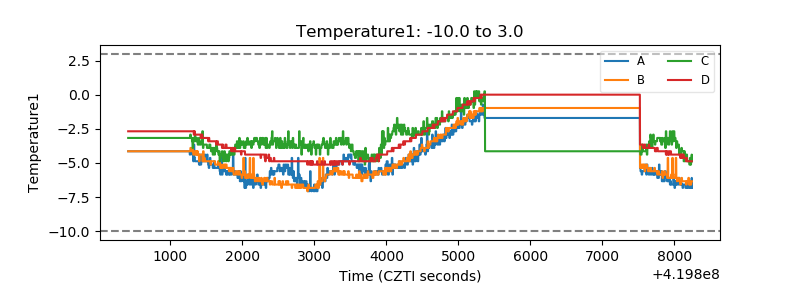 |
| Veto HV Monitor | 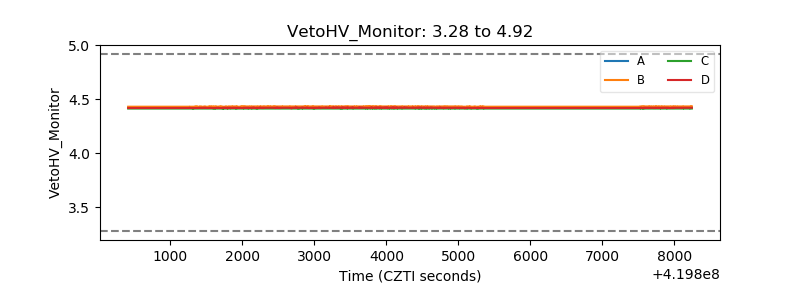 |
| Veto LLD | 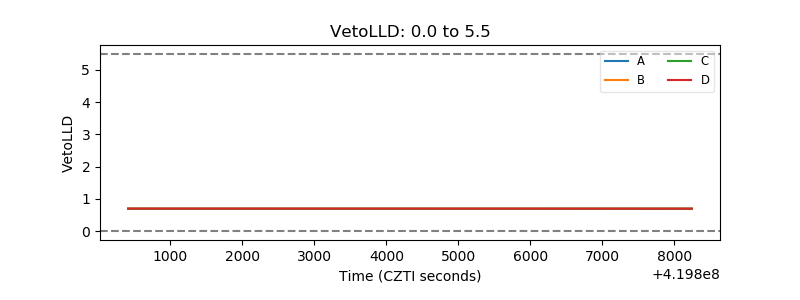 |
| Alpha Counter |  |
| _CPM_Rate |  |
| CZT Counter | 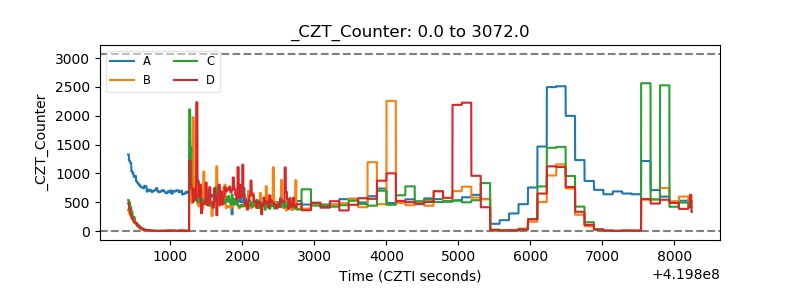 |
| +2.5 Volts monitor | 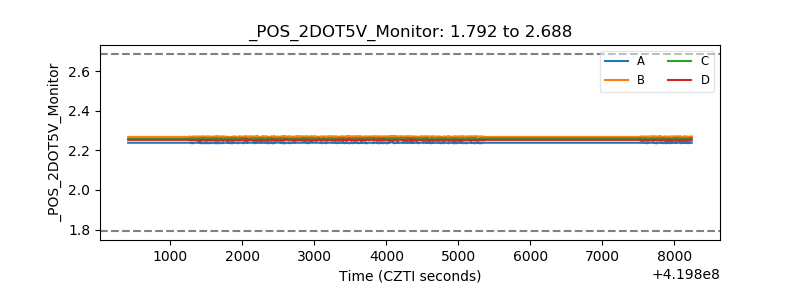 |
| +5 Volts monitor |  |
| _ROLL_ROT | 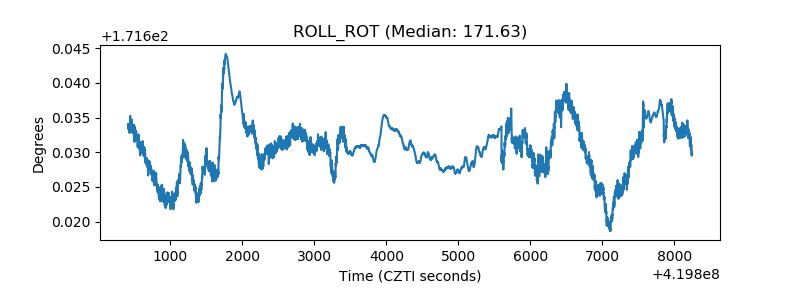 |
| _Roll_DEC | 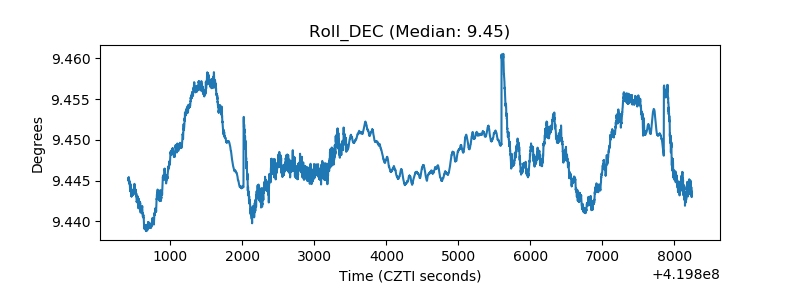 |
| _Roll_RA | 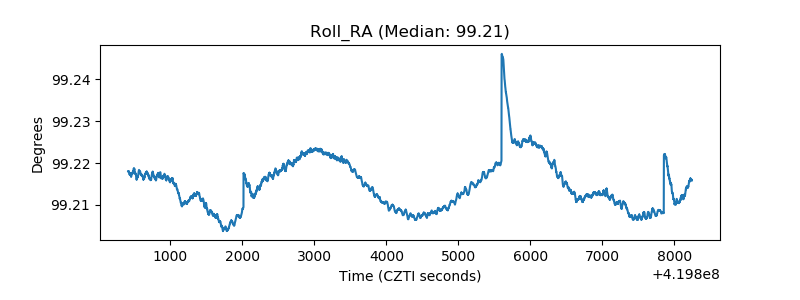 |
| Veto Counter | 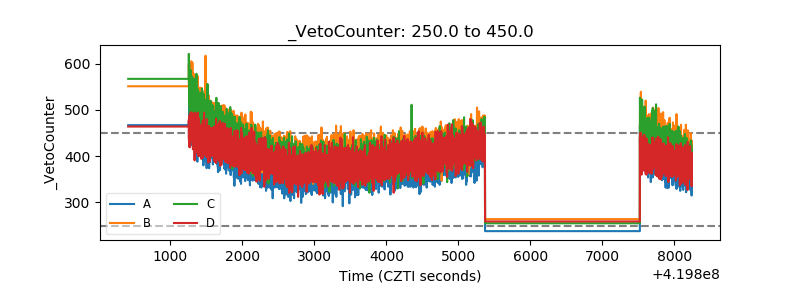 |