| Param | Original file | Final file |
|---|---|---|
| Filename | modeM0/AS1A12_097T01_9000005574_40897cztM0_level2.fits | modeM0/AS1A12_097T01_9000005574_40897cztM0_level2_quad_clean.evt |
| Size (bytes) | 300,870,720 | 82,474,560 |
| Size | 286.9 MB | 78.7 MB |
| Events in quadrant A | 2,635,658 | 552,097 |
| Events in quadrant B | 2,775,997 | 568,065 |
| Events in quadrant C | 2,493,251 | 541,939 |
| Events in quadrant D | 2,850,629 | 491,654 |
| Mode M9 | |||
|---|---|---|---|
| Quadrant | BADHDUFLAG | Total packets | Discarded packets |
| A | 0 | 36 | 0 |
| B | 0 | 36 | 0 |
| C | 0 | 36 | 0 |
| D | 0 | 37 | 0 |
| Mode SS | |||
|---|---|---|---|
| Quadrant | BADHDUFLAG | Total packets | Discarded packets |
| A | 0 | 100 | 0 |
| B | 0 | 100 | 0 |
| C | 0 | 100 | 0 |
| D | 0 | 100 | 0 |
| Mode M0 | |||
|---|---|---|---|
| Quadrant | BADHDUFLAG | Total packets | Discarded packets |
| A | 0 | 10733 | 3 |
| B | 0 | 11494 | 2 |
| C | 0 | 10406 | 2 |
| D | 0 | 11678 | 2 |
| Quadrant | Total seconds | Saturated seconds | Saturation percentage |
|---|---|---|---|
| A | 4896 | 9 | 0.183824% |
| B | 4896 | 118 | 2.410131% |
| C | 4896 | 49 | 1.000817% |
| D | 4896 | 67 | 1.368464% |
Noise dominated data is calculated using 1-second bins in cleaned event files. If a bin has >2000 counts, and if more than 50% of those come from <1% of pixels, then it is considered to be noise-dominated and hence unusable.
| Quadrant | # 1 sec bins | Bins with >0 counts | Bins with >2000 counts | High rate bins dominated by noise | Noise dominated (total time) | Noise dominated (detector-on time) | Marked lightcurve |
|---|---|---|---|---|---|---|---|
| A | 6988 | 4897 | 4 | 4 | 0.06% | 0.08% | 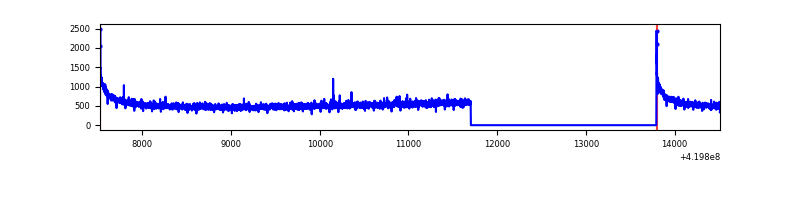 |
| B | 6988 | 4897 | 73 | 73 | 1.04% | 1.49% | 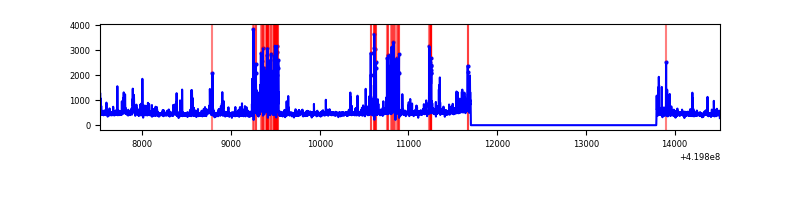 |
| C | 6988 | 4897 | 42 | 42 | 0.60% | 0.86% | 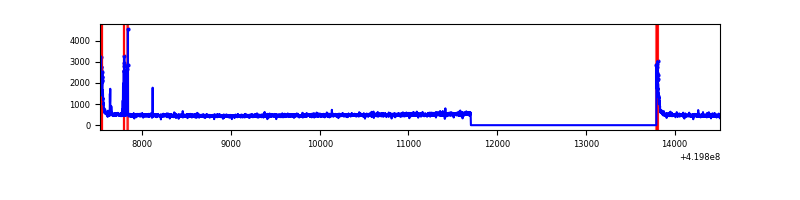 |
| D | 6988 | 4897 | 53 | 53 | 0.76% | 1.08% | 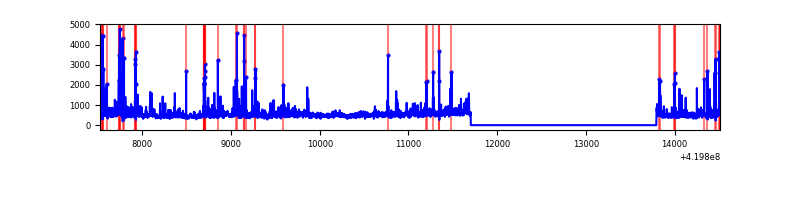 |
Top three noisy pixels from each quadrant. If the there are fewer than three noisy pixels in the level2.evt file, extra rows are filled as -1
| Pixel properties | Quadrant properties | ||||||
|---|---|---|---|---|---|---|---|
| Quadrant | DetID | PixID | Counts | Sigma | Mean | Median | Sigma |
| A | 10 | 83 | 474845 | 4215.8 | 549 | 539 | 112.5 |
| A | 13 | 6 | 12304 | 104.57 | 549 | 539 | 112.5 |
| A | 13 | 248 | 11947 | 101.39 | 549 | 539 | 112.5 |
| B | 4 | 171 | 422398 | 3958.53 | 547 | 532 | 106.6 |
| B | 5 | 255 | 76366 | 711.58 | 547 | 532 | 106.6 |
| B | 0 | 245 | 50331 | 467.28 | 547 | 532 | 106.6 |
| C | 15 | 214 | 208233 | 1644.06 | 536 | 539 | 126.3 |
| C | 0 | 10 | 133154 | 1049.75 | 536 | 539 | 126.3 |
| C | 9 | 54 | 45896 | 359.04 | 536 | 539 | 126.3 |
| D | 12 | 79 | 301945 | 2291.11 | 529 | 512 | 131.6 |
| D | 12 | 128 | 226883 | 1720.58 | 529 | 512 | 131.6 |
| D | 13 | 171 | 49067 | 369.05 | 529 | 512 | 131.6 |
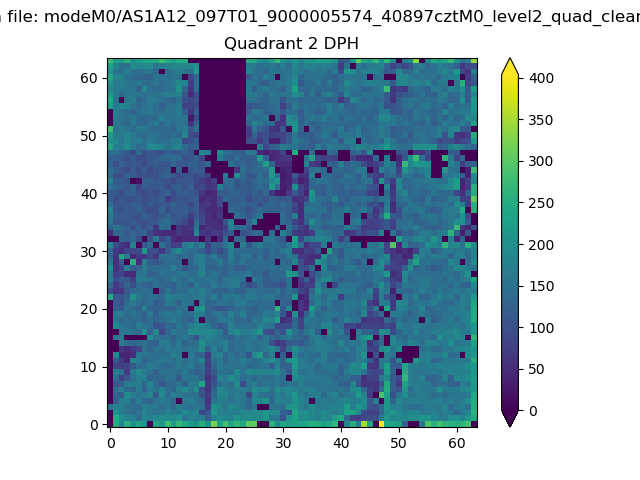
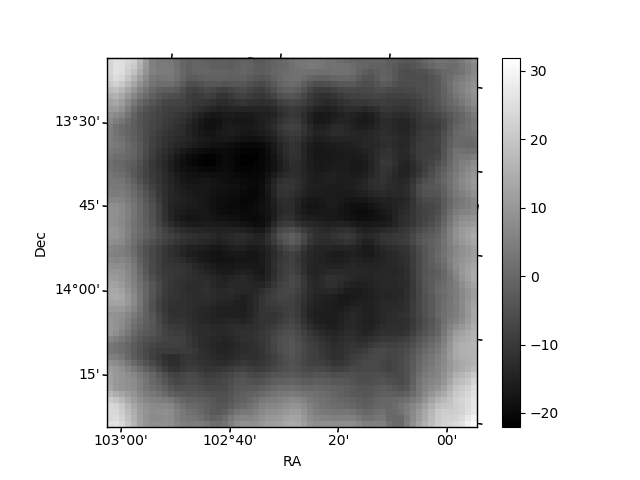
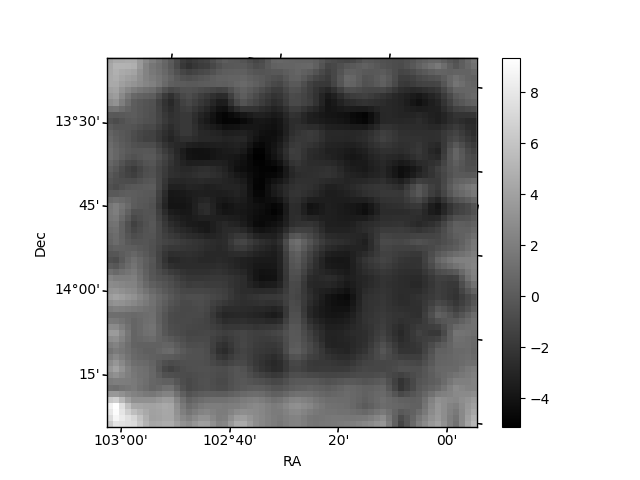
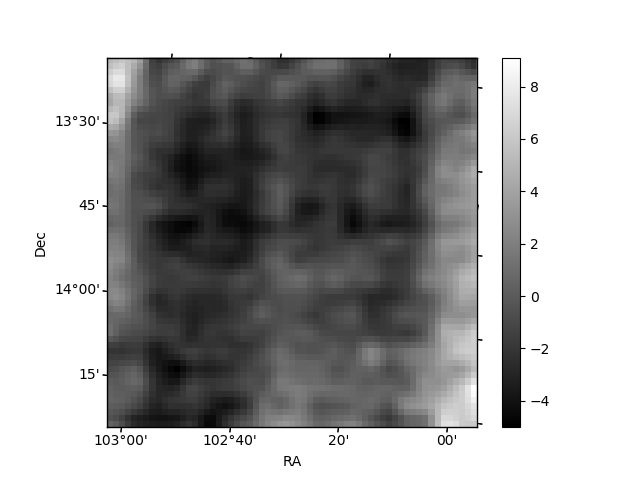
Histogram calculated using DETX and DETY for each event in the final _common_clean file
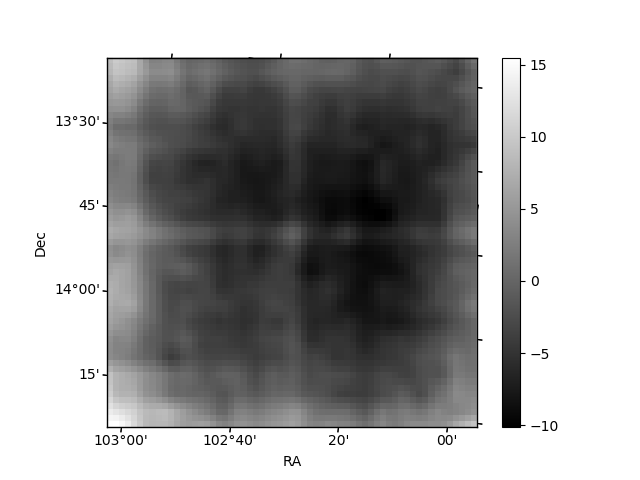
| Quadrant A | 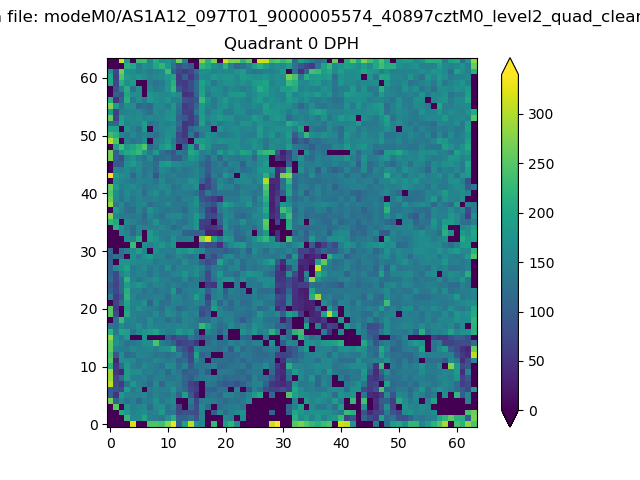 |
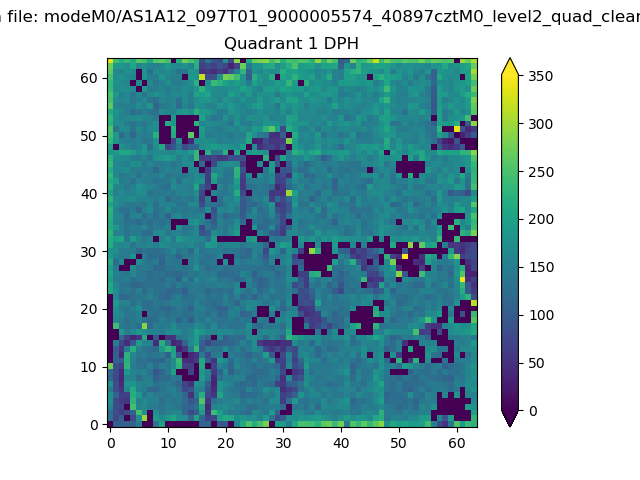 |
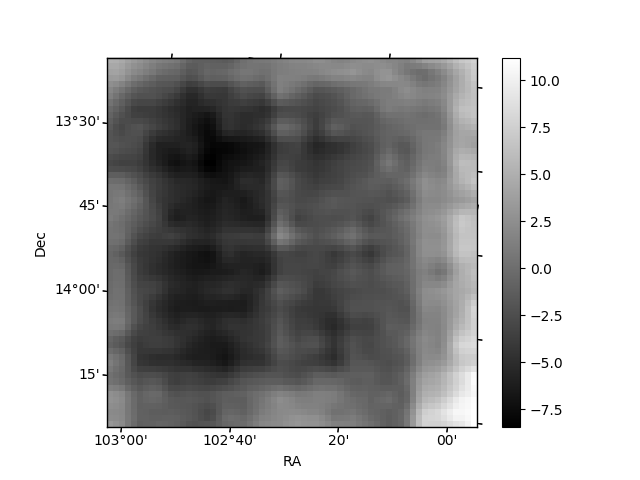
Quadrant B |
|---|---|---|---|
| Quadrant D | 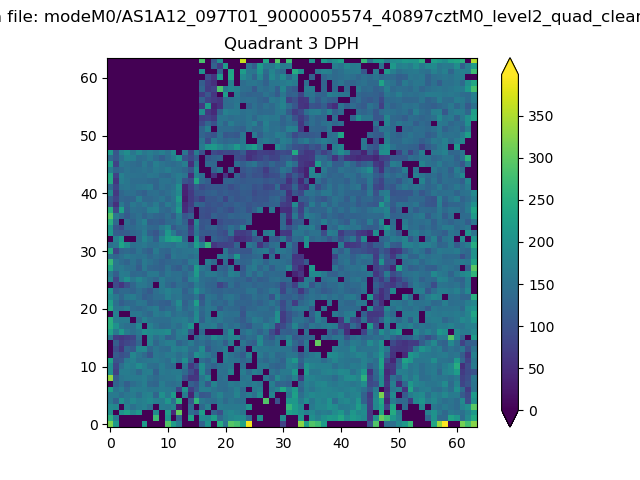 |
 |
Quadrant C |
| Plot type | Count rate plots | Images |
|---|---|---|
| Comparison with Poisson distribution Blue bars denote a histogram of data divided into 1 sec bins. Red curve is a Poisson curve with rate = median count rate of data. |
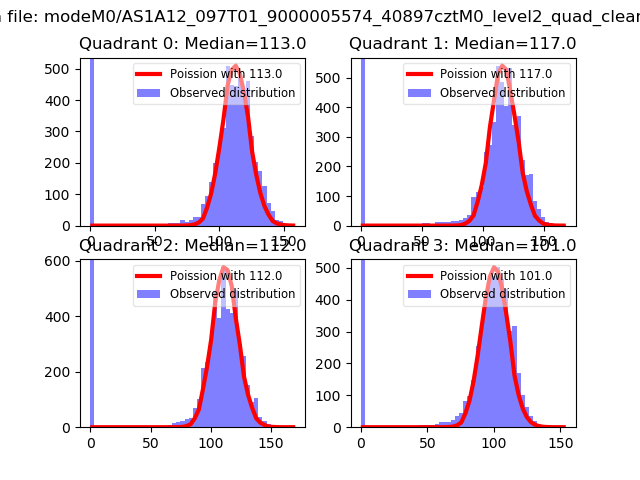 |
 |
| Quadrant-wise count rates Data is divided into 100 sec bins |
 |
|
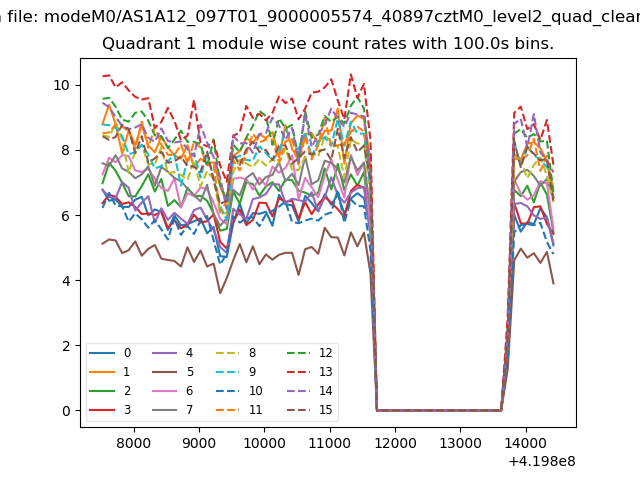
| Module-wise count rates for Quadrant A Data is divided into 100 sec bins |
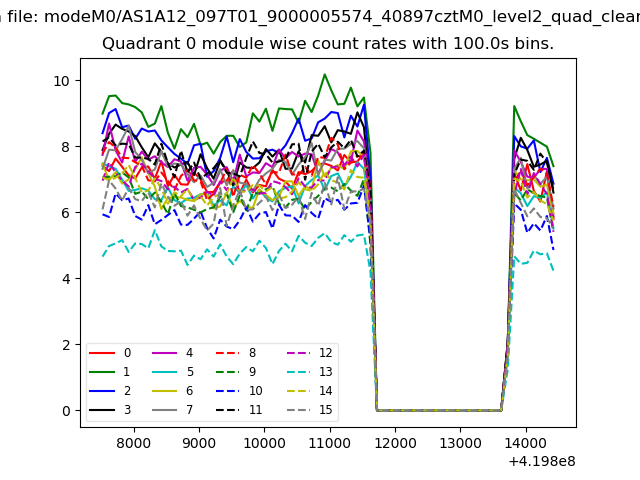 |
 |
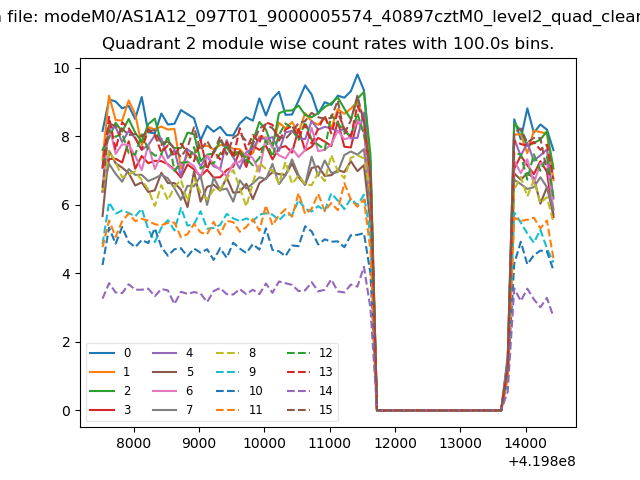
| Module-wise count rates for Quadrant B Data is divided into 100 sec bins |
 |
 |
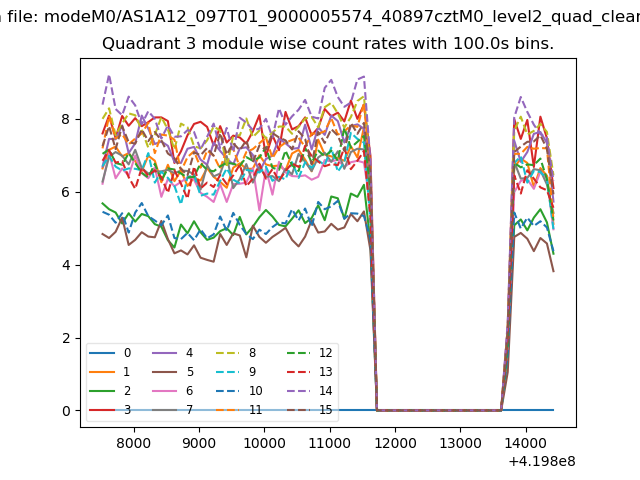
| Module-wise count rates for Quadrant C Data is divided into 100 sec bins |
 |
 |
| Module-wise count rates for Quadrant D Data is divided into 100 sec bins |
 |
 |
| Parameter | Plot |
|---|---|
| CZT HV Monitor | 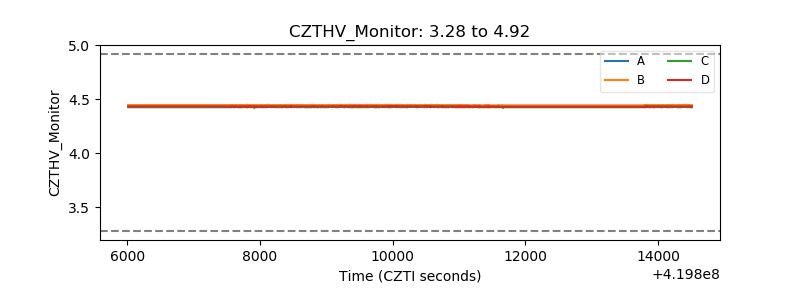 |
| D_VDD | 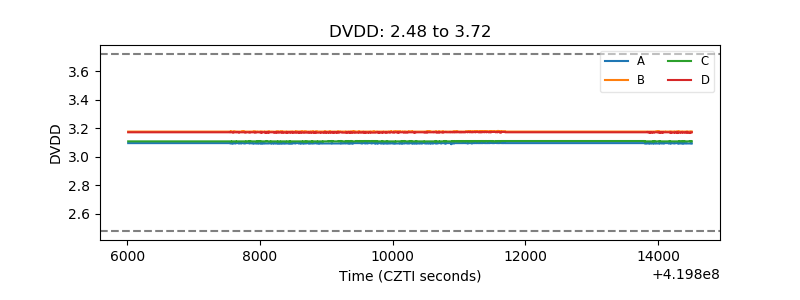 |
| Temperature 1 | 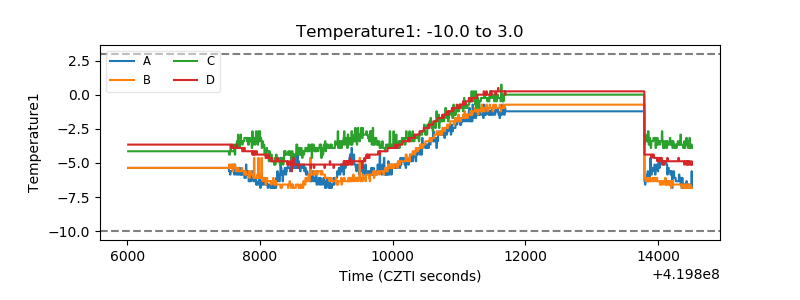 |
| Veto HV Monitor | 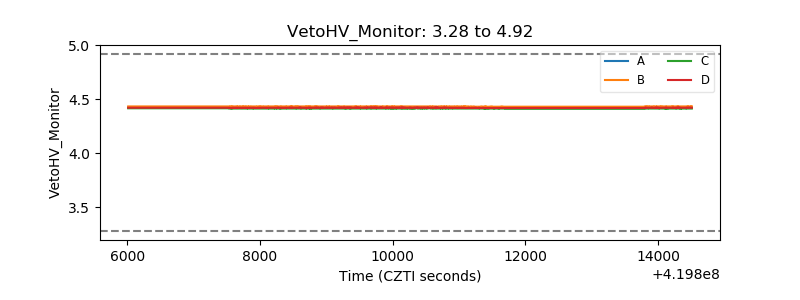 |
| Veto LLD | 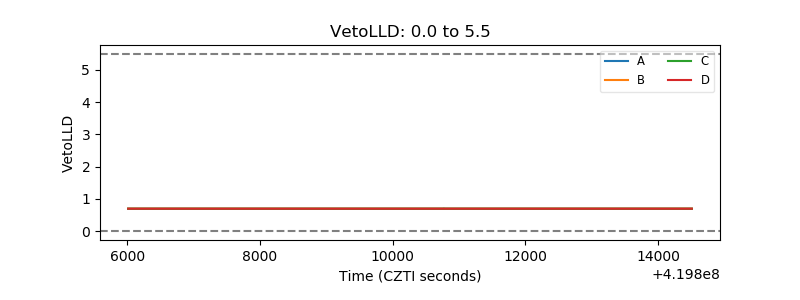 |
| Alpha Counter | 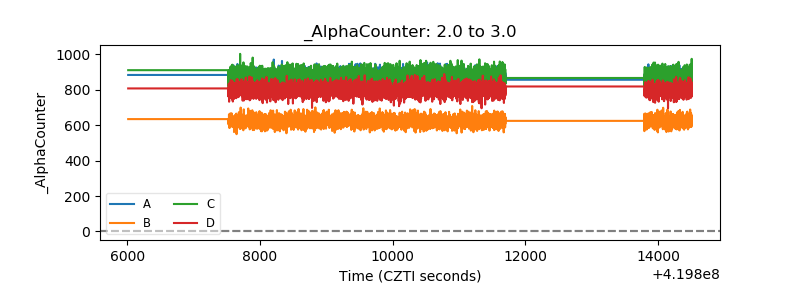 |
| _CPM_Rate | 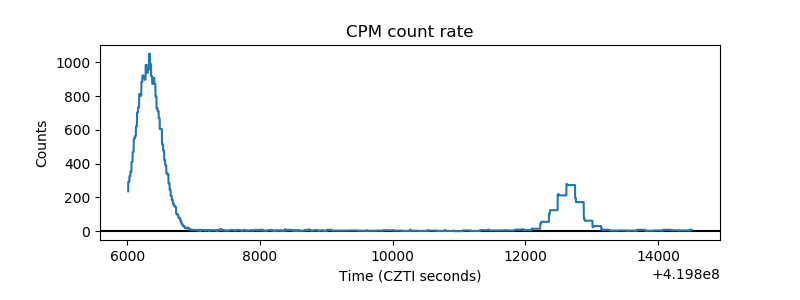 |
| CZT Counter | 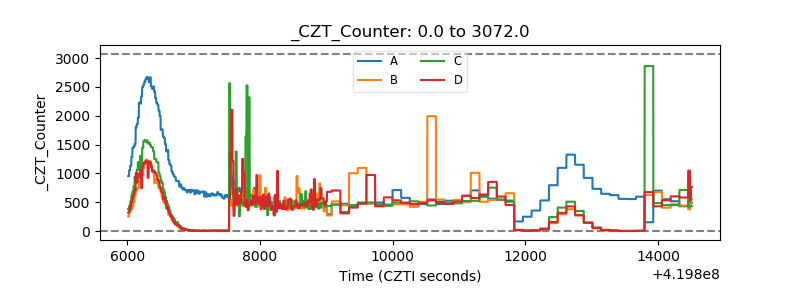 |
| +2.5 Volts monitor | 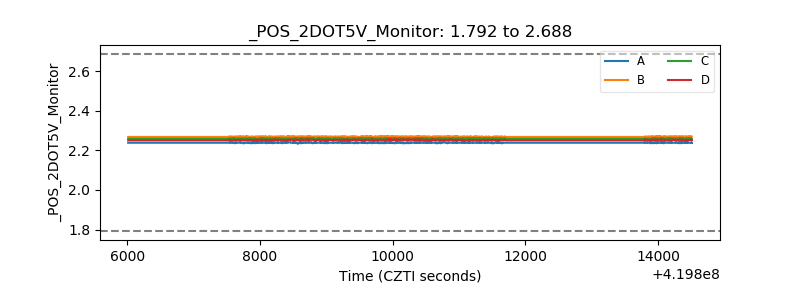 |
| +5 Volts monitor | 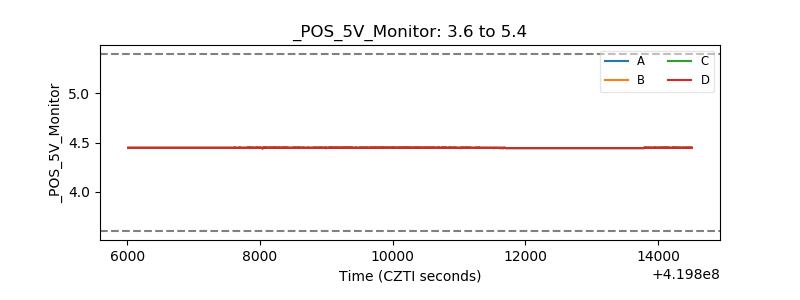 |
| _ROLL_ROT | 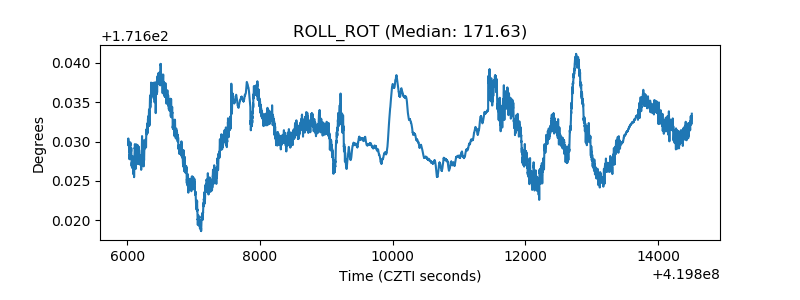 |
| _Roll_DEC | 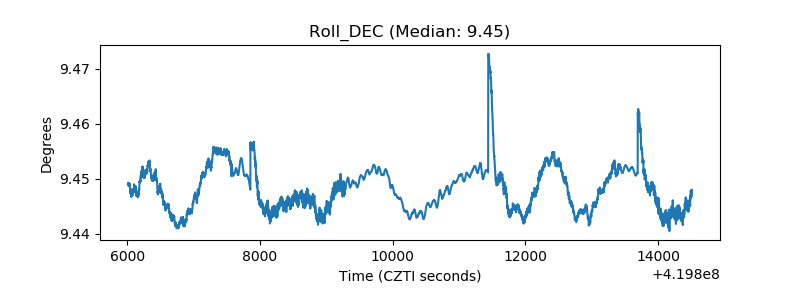 |
| _Roll_RA | 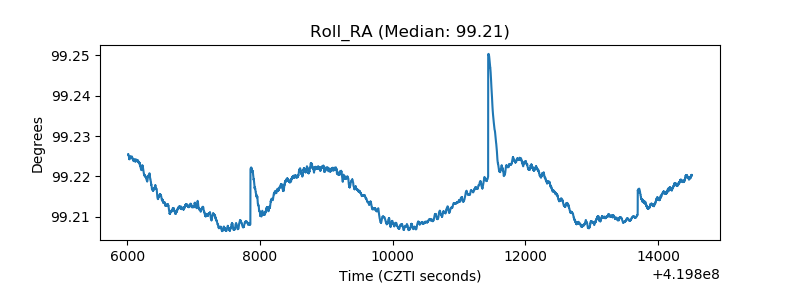 |
| Veto Counter | 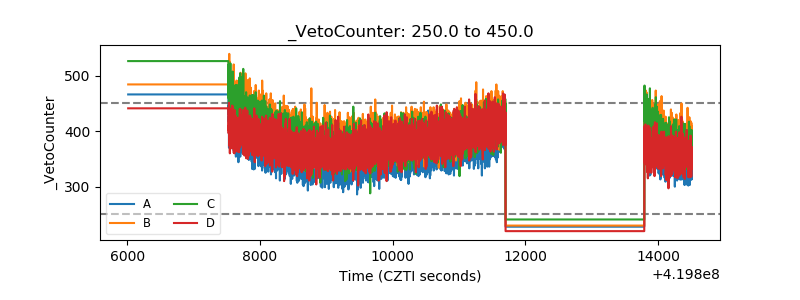 |