| Param | Original file | Final file |
|---|---|---|
| Filename | modeM0/AS1A12_097T01_9000005574_40899cztM0_level2.fits | modeM0/AS1A12_097T01_9000005574_40899cztM0_level2_quad_clean.evt |
| Size (bytes) | 276,932,160 | 72,080,640 |
| Size | 264.1 MB | 68.7 MB |
| Events in quadrant A | 2,333,808 | 479,921 |
| Events in quadrant B | 2,255,840 | 500,159 |
| Events in quadrant C | 2,265,069 | 474,415 |
| Events in quadrant D | 3,048,993 | 415,293 |
| Mode M9 | |||
|---|---|---|---|
| Quadrant | BADHDUFLAG | Total packets | Discarded packets |
| A | 0 | 19 | 0 |
| B | 0 | 19 | 0 |
| C | 0 | 19 | 0 |
| D | 0 | 19 | 0 |
| Mode SS | |||
|---|---|---|---|
| Quadrant | BADHDUFLAG | Total packets | Discarded packets |
| A | 0 | 90 | 0 |
| B | 0 | 90 | 0 |
| C | 0 | 90 | 0 |
| D | 0 | 90 | 0 |
| Mode M0 | |||
|---|---|---|---|
| Quadrant | BADHDUFLAG | Total packets | Discarded packets |
| A | 0 | 9451 | 1 |
| B | 0 | 9728 | 1 |
| C | 0 | 9484 | 1 |
| D | 0 | 12046 | 1 |
| Quadrant | Total seconds | Saturated seconds | Saturation percentage |
|---|---|---|---|
| A | 4450 | 9 | 0.202247% |
| B | 4450 | 34 | 0.764045% |
| C | 4450 | 40 | 0.898876% |
| D | 4450 | 227 | 5.101124% |
Noise dominated data is calculated using 1-second bins in cleaned event files. If a bin has >2000 counts, and if more than 50% of those come from <1% of pixels, then it is considered to be noise-dominated and hence unusable.
| Quadrant | # 1 sec bins | Bins with >0 counts | Bins with >2000 counts | High rate bins dominated by noise | Noise dominated (total time) | Noise dominated (detector-on time) | Marked lightcurve |
|---|---|---|---|---|---|---|---|
| A | 6333 | 4451 | 0 | 0 | 0.00% | 0.00% | 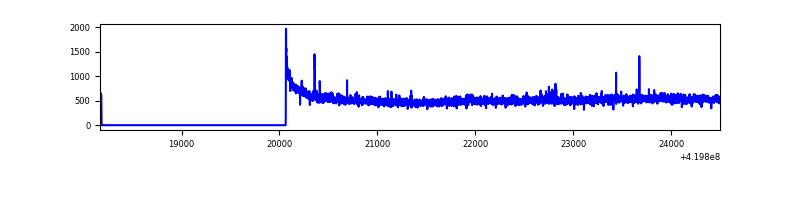 |
| B | 6333 | 4451 | 18 | 18 | 0.28% | 0.40% | 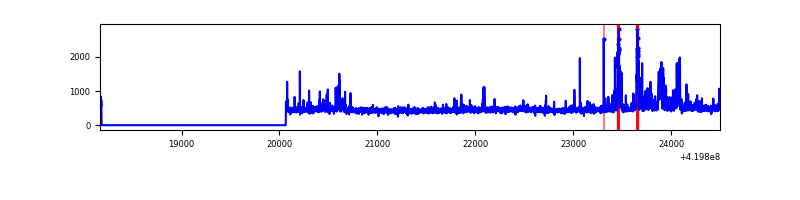 |
| C | 6333 | 4451 | 28 | 28 | 0.44% | 0.63% | 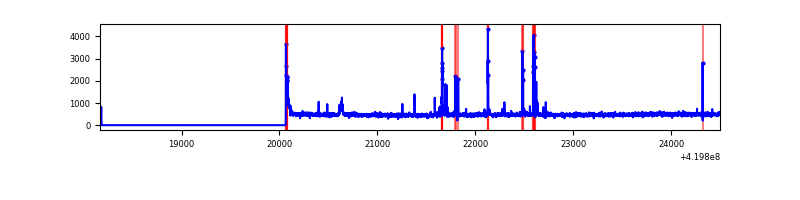 |
| D | 6333 | 4451 | 179 | 179 | 2.83% | 4.02% | 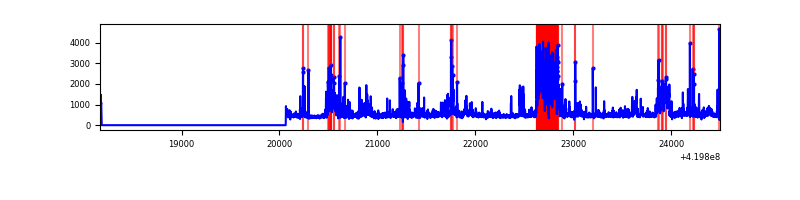 |
Top three noisy pixels from each quadrant. If the there are fewer than three noisy pixels in the level2.evt file, extra rows are filled as -1
| Pixel properties | Quadrant properties | ||||||
|---|---|---|---|---|---|---|---|
| Quadrant | DetID | PixID | Counts | Sigma | Mean | Median | Sigma |
| A | 10 | 83 | 375953 | 3651.42 | 493 | 482 | 102.8 |
| A | 12 | 189 | 34596 | 331.76 | 493 | 482 | 102.8 |
| A | 13 | 6 | 10139 | 93.91 | 493 | 482 | 102.8 |
| B | 4 | 171 | 111149 | 1143.15 | 491 | 477 | 96.8 |
| B | 5 | 32 | 85329 | 876.45 | 491 | 477 | 96.8 |
| B | 0 | 190 | 43331 | 442.65 | 491 | 477 | 96.8 |
| C | 15 | 214 | 184125 | 1611.02 | 479 | 482 | 114.0 |
| C | 14 | 254 | 147086 | 1286.1 | 479 | 482 | 114.0 |
| C | 0 | 10 | 48102 | 417.75 | 479 | 482 | 114.0 |
| D | 2 | 249 | 536908 | 4593.96 | 470 | 457 | 116.8 |
| D | 12 | 79 | 217380 | 1857.64 | 470 | 457 | 116.8 |
| D | 12 | 128 | 159090 | 1358.47 | 470 | 457 | 116.8 |
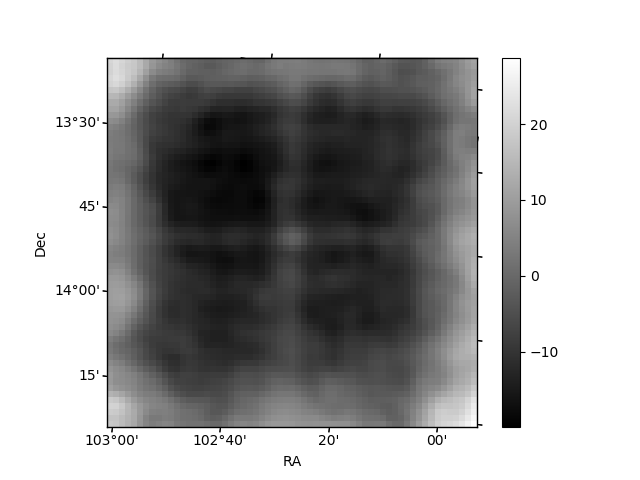
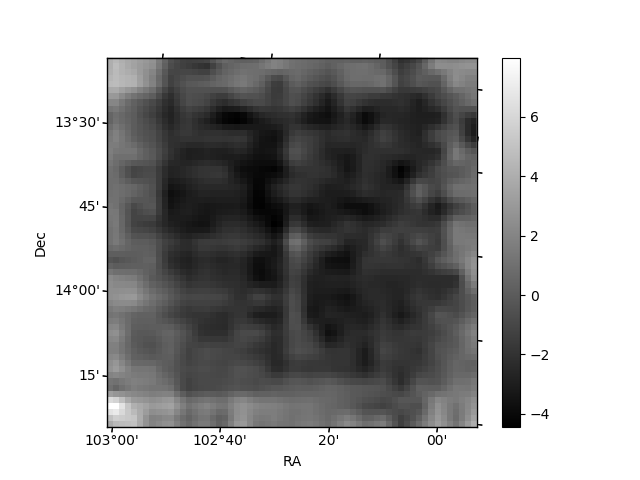
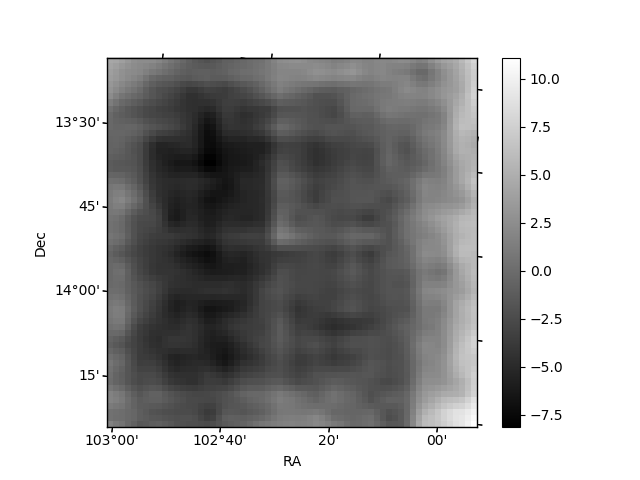
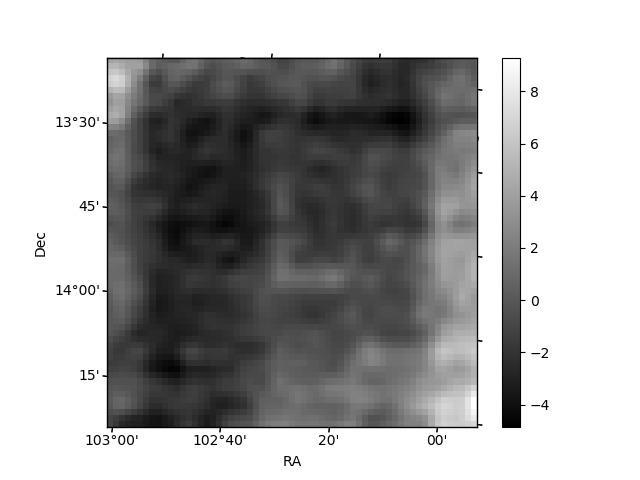
Histogram calculated using DETX and DETY for each event in the final _common_clean file
| Quadrant A | 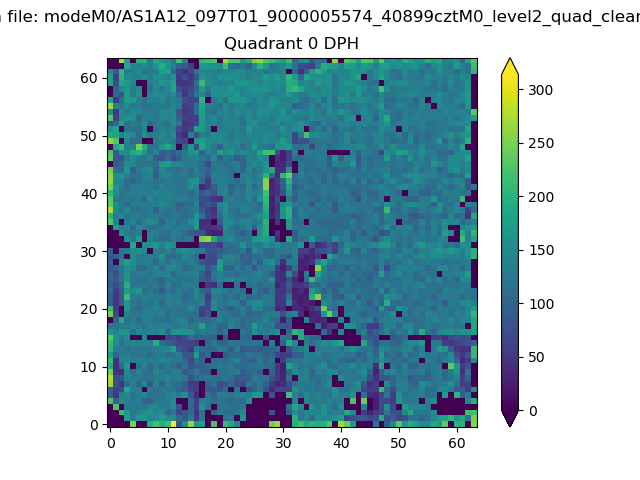 |
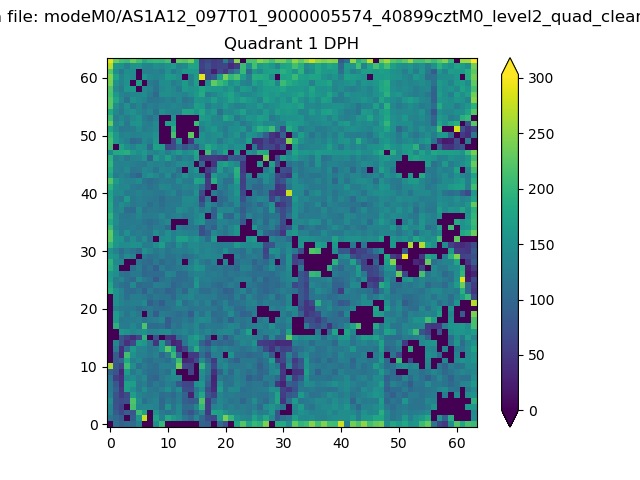 |
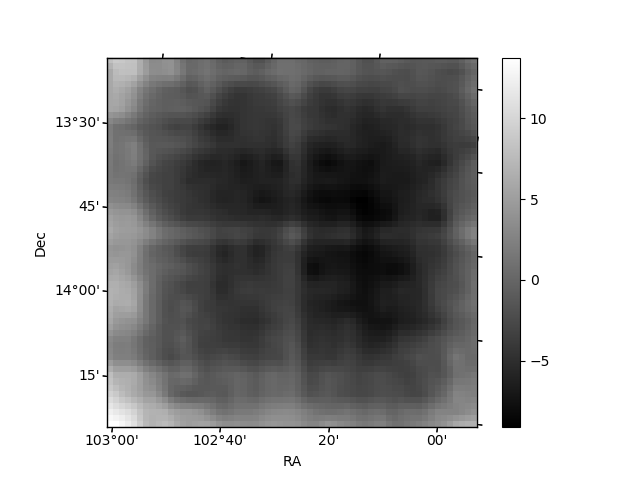
Quadrant B |
|---|---|---|---|
| Quadrant D | 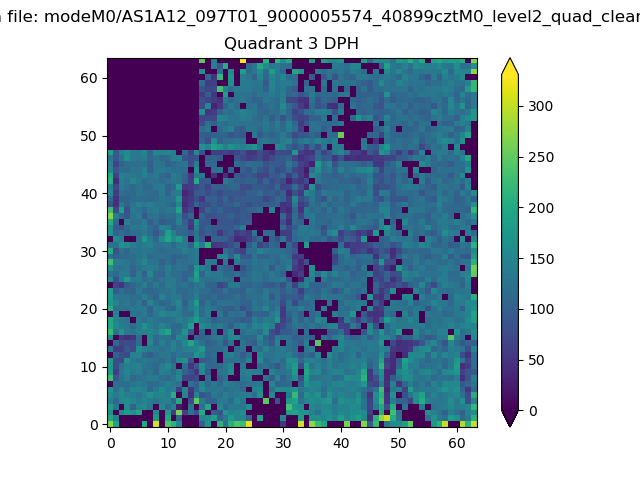 |
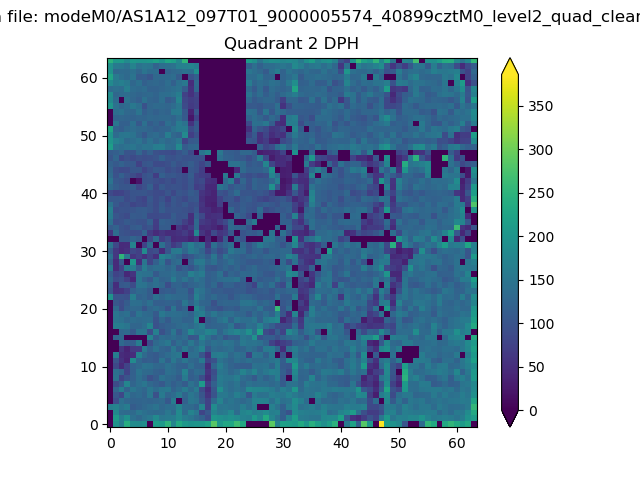 |
Quadrant C |
| Plot type | Count rate plots | Images |
|---|---|---|
| Comparison with Poisson distribution Blue bars denote a histogram of data divided into 1 sec bins. Red curve is a Poisson curve with rate = median count rate of data. |
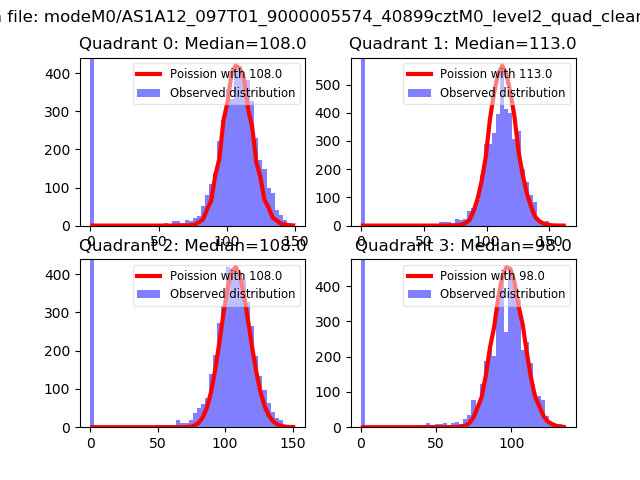 |
 |
| Quadrant-wise count rates Data is divided into 100 sec bins |
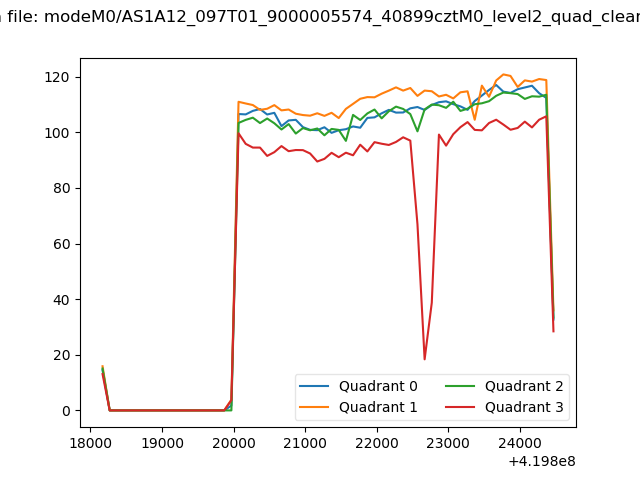 |
|
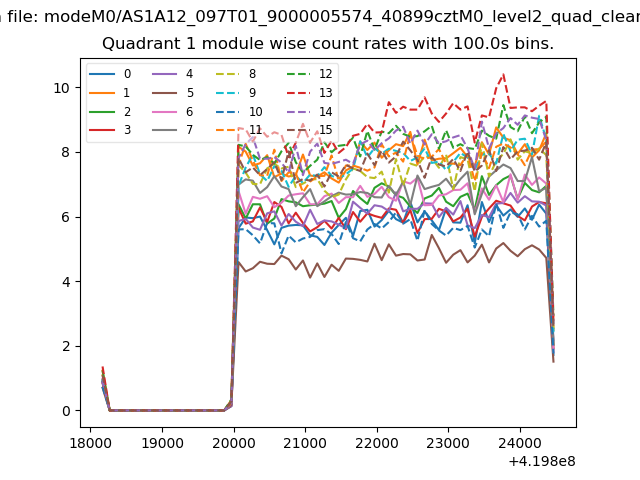
| Module-wise count rates for Quadrant A Data is divided into 100 sec bins |
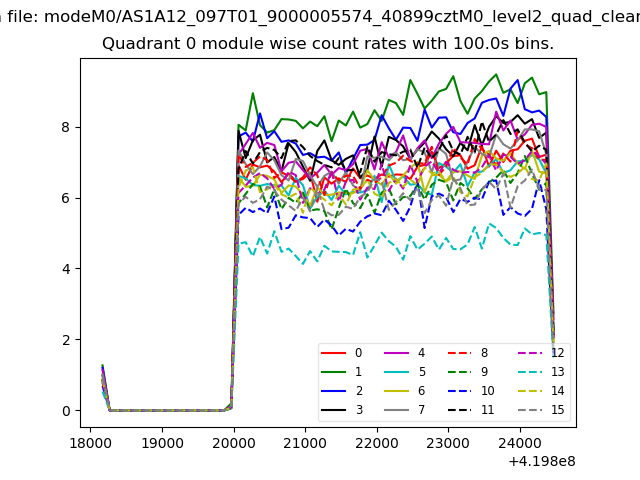 |
 |
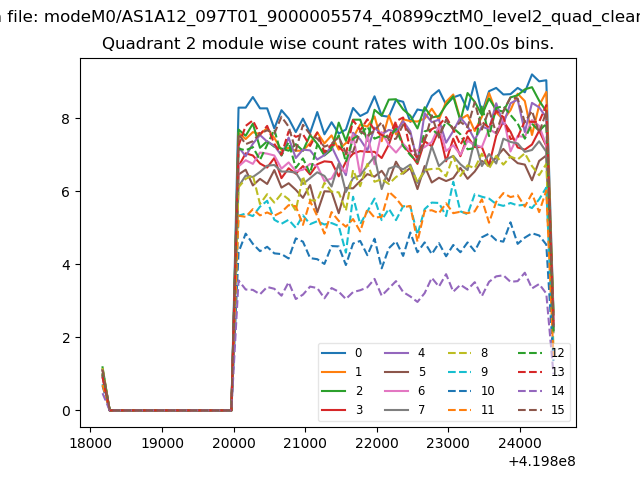
| Module-wise count rates for Quadrant B Data is divided into 100 sec bins |
 |
 |
| Module-wise count rates for Quadrant C Data is divided into 100 sec bins |
 |
 |
| Module-wise count rates for Quadrant D Data is divided into 100 sec bins |
 |
 |
| Parameter | Plot |
|---|---|
| CZT HV Monitor | 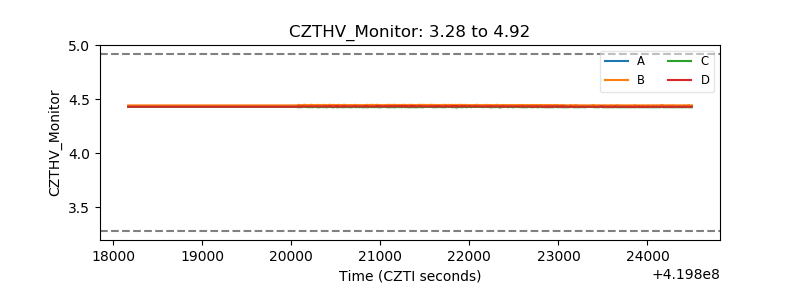 |
| D_VDD | 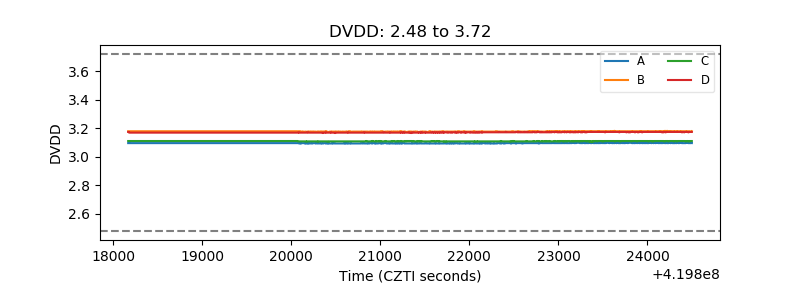 |
| Temperature 1 | 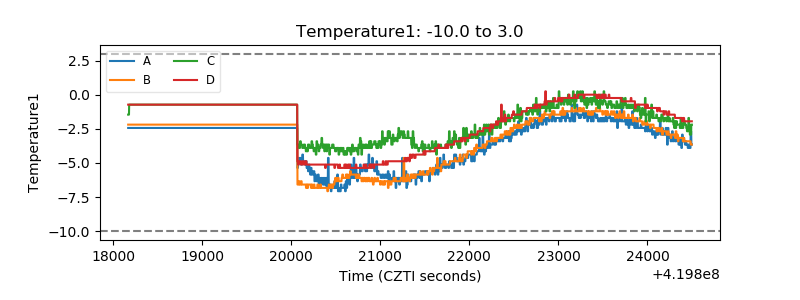 |
| Veto HV Monitor | 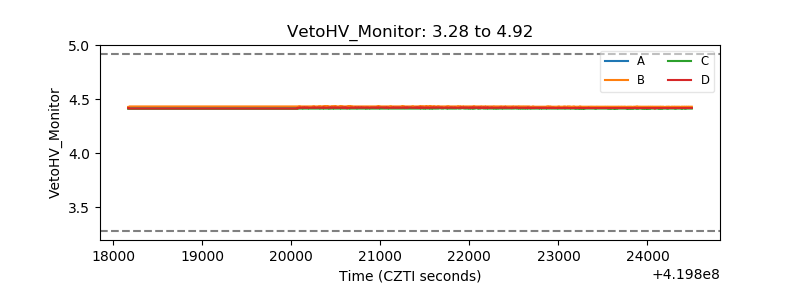 |
| Veto LLD | 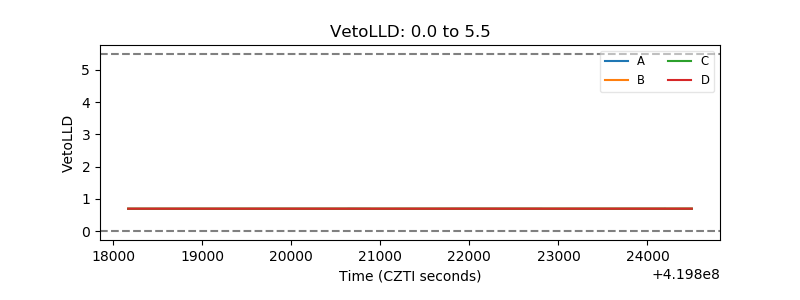 |
| Alpha Counter |  |
| _CPM_Rate |  |
| CZT Counter | 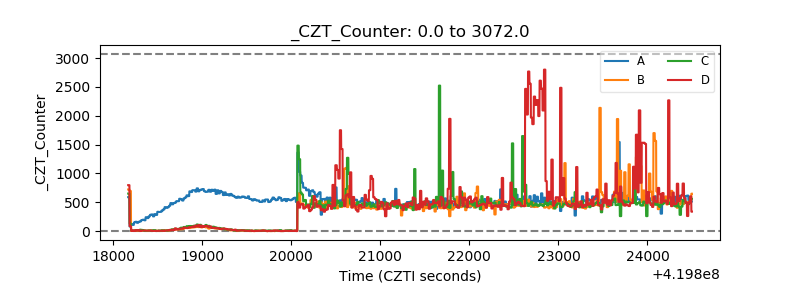 |
| +2.5 Volts monitor | 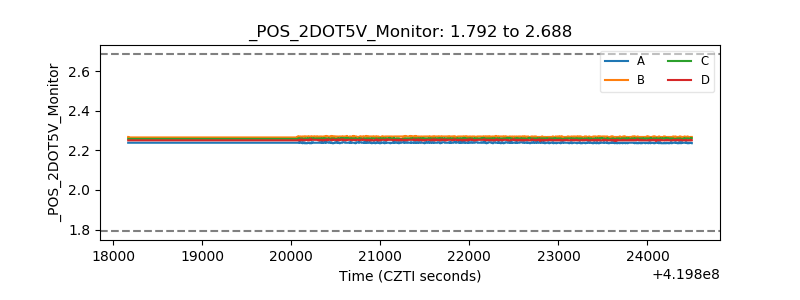 |
| +5 Volts monitor | 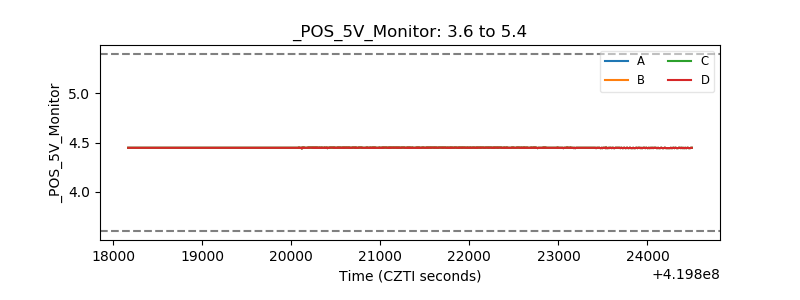 |
| _ROLL_ROT | 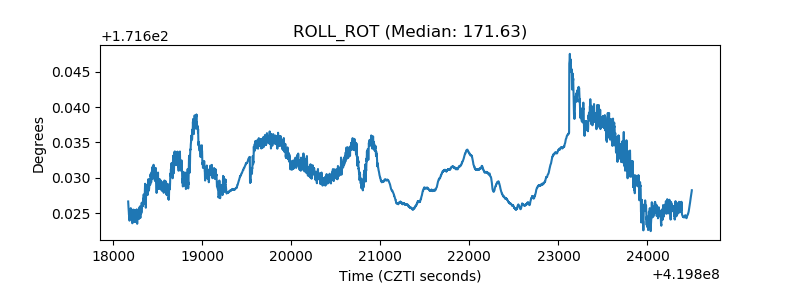 |
| _Roll_DEC | 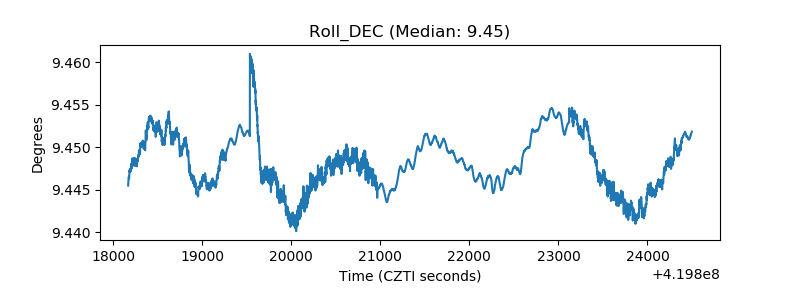 |
| _Roll_RA | 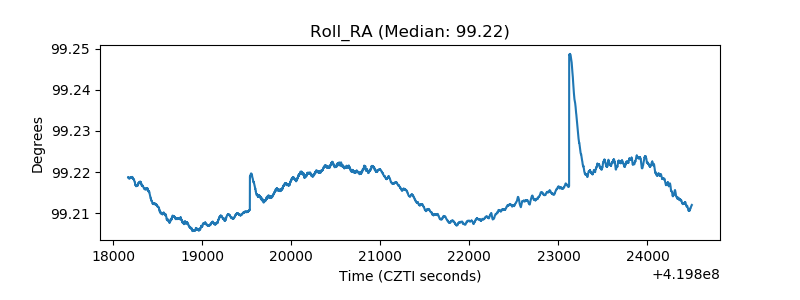 |
| Veto Counter | 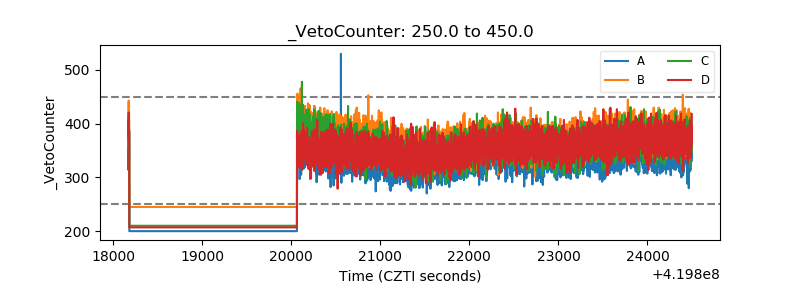 |