| Param | Original file | Final file |
|---|---|---|
| Filename | modeM0/AS1A12_102T01_9000005576_40899cztM0_level2.fits | modeM0/AS1A12_102T01_9000005576_40899cztM0_level2_quad_clean.evt |
| Size (bytes) | 55,336,320 | 16,669,440 |
| Size | 52.8 MB | 15.9 MB |
| Events in quadrant A | 553,395 | 107,931 |
| Events in quadrant B | 506,156 | 109,455 |
| Events in quadrant C | 454,538 | 108,137 |
| Events in quadrant D | 450,363 | 100,013 |
| Mode SS | |||
|---|---|---|---|
| Quadrant | BADHDUFLAG | Total packets | Discarded packets |
| A | 0 | 22 | 0 |
| B | 0 | 22 | 0 |
| C | 0 | 22 | 0 |
| D | 0 | 22 | 0 |
| Mode M0 | |||
|---|---|---|---|
| Quadrant | BADHDUFLAG | Total packets | Discarded packets |
| A | 0 | 2324 | 2 |
| B | 0 | 2337 | 1 |
| C | 0 | 2113 | 1 |
| D | 0 | 2204 | 1 |
| Mode M9 | |||
|---|---|---|---|
| Quadrant | BADHDUFLAG | Total packets | Discarded packets |
| A | 0 | 7 | 0 |
| B | 0 | 7 | 0 |
| C | 0 | 7 | 0 |
| D | 0 | 7 | 0 |
| Quadrant | Total seconds | Saturated seconds | Saturation percentage |
|---|---|---|---|
| A | 1033 | 4 | 0.387222% |
| B | 1033 | 27 | 2.613746% |
| C | 1033 | 4 | 0.387222% |
| D | 1033 | 10 | 0.968054% |
Noise dominated data is calculated using 1-second bins in cleaned event files. If a bin has >2000 counts, and if more than 50% of those come from <1% of pixels, then it is considered to be noise-dominated and hence unusable.
| Quadrant | # 1 sec bins | Bins with >0 counts | Bins with >2000 counts | High rate bins dominated by noise | Noise dominated (total time) | Noise dominated (detector-on time) | Marked lightcurve |
|---|---|---|---|---|---|---|---|
| A | 1033 | 1033 | 2 | 2 | 0.19% | 0.19% | 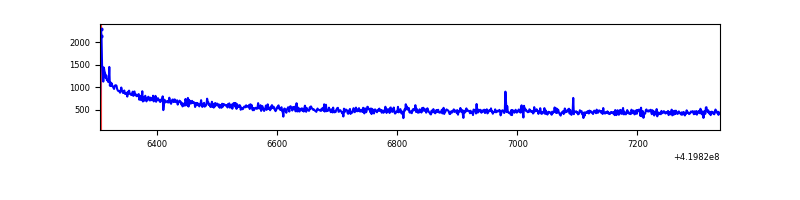 |
| B | 1033 | 1033 | 18 | 18 | 1.74% | 1.74% | 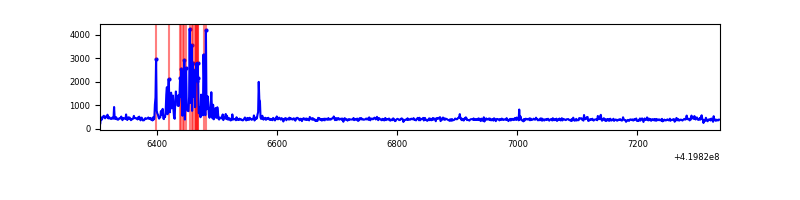 |
| C | 1033 | 1033 | 2 | 2 | 0.19% | 0.19% | 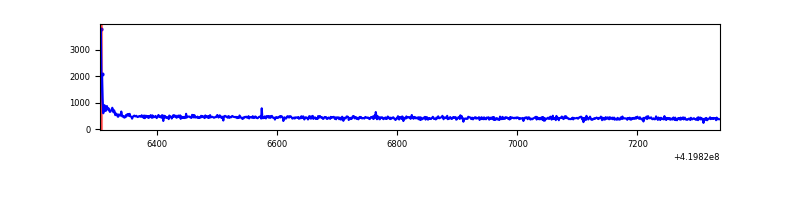 |
| D | 1033 | 1033 | 7 | 7 | 0.68% | 0.68% | 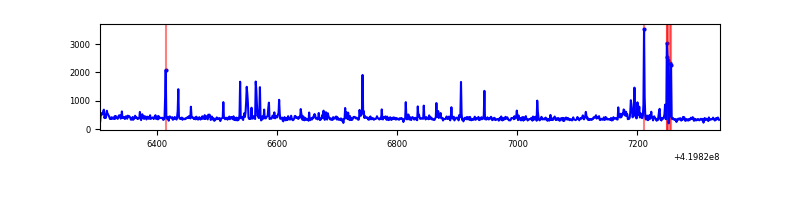 |
Top three noisy pixels from each quadrant. If the there are fewer than three noisy pixels in the level2.evt file, extra rows are filled as -1
| Pixel properties | Quadrant properties | ||||||
|---|---|---|---|---|---|---|---|
| Quadrant | DetID | PixID | Counts | Sigma | Mean | Median | Sigma |
| A | 10 | 83 | 153377 | 6694.9 | 101 | 99 | 22.9 |
| A | 13 | 6 | 3803 | 161.78 | 101 | 99 | 22.9 |
| A | 12 | 189 | 2792 | 117.63 | 101 | 99 | 22.9 |
| B | 5 | 255 | 97649 | 4509.77 | 101 | 98 | 21.6 |
| B | 0 | 190 | 5247 | 238.04 | 101 | 98 | 21.6 |
| B | 12 | 111 | 2450 | 108.73 | 101 | 98 | 21.6 |
| C | 15 | 214 | 47436 | 1883.96 | 99 | 100 | 25.1 |
| C | 0 | 10 | 15888 | 628.36 | 99 | 100 | 25.1 |
| C | 5 | 10 | 1869 | 70.41 | 99 | 100 | 25.1 |
| D | 12 | 6 | 57755 | 2215.21 | 97 | 94 | 26.0 |
| D | 13 | 249 | 6911 | 261.89 | 97 | 94 | 26.0 |
| D | 2 | 234 | 4996 | 188.32 | 97 | 94 | 26.0 |
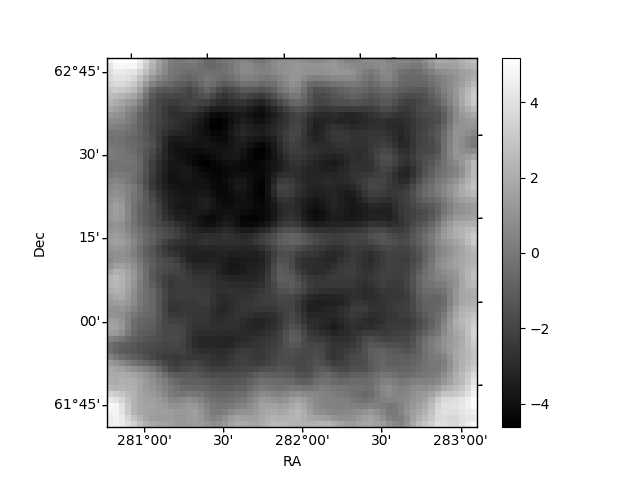
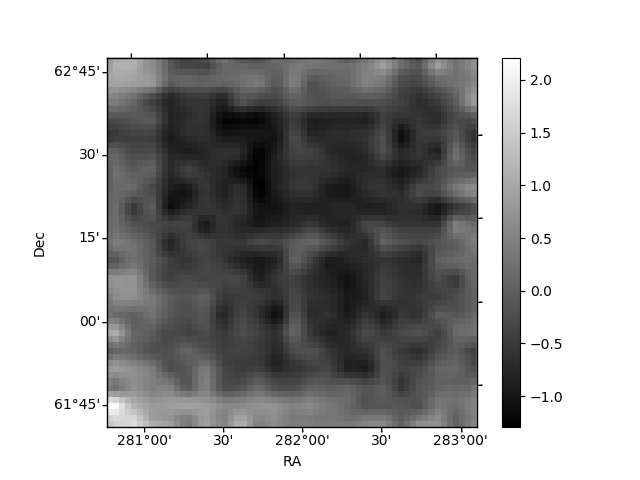
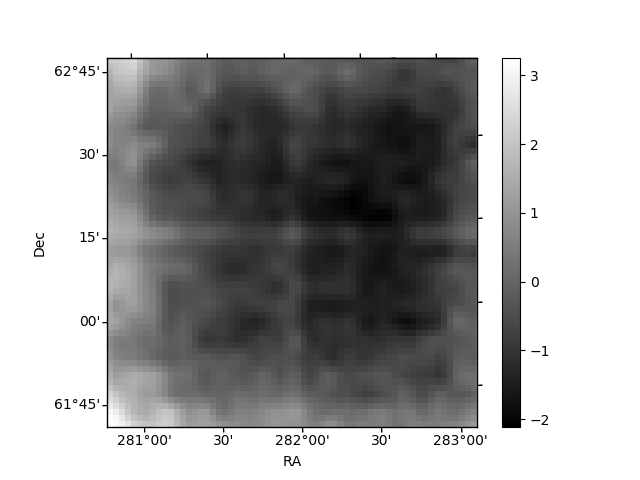
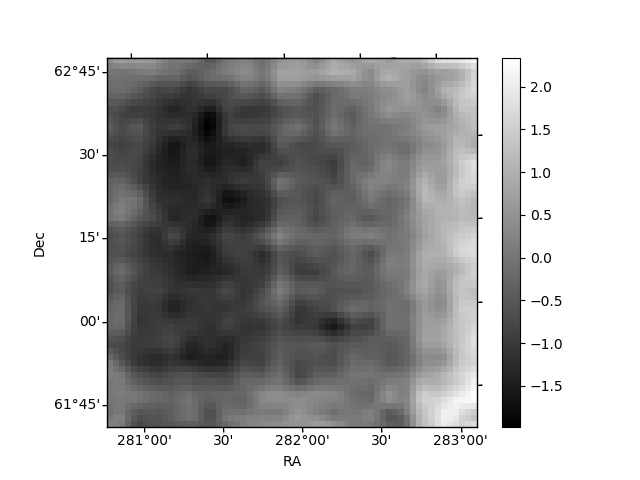
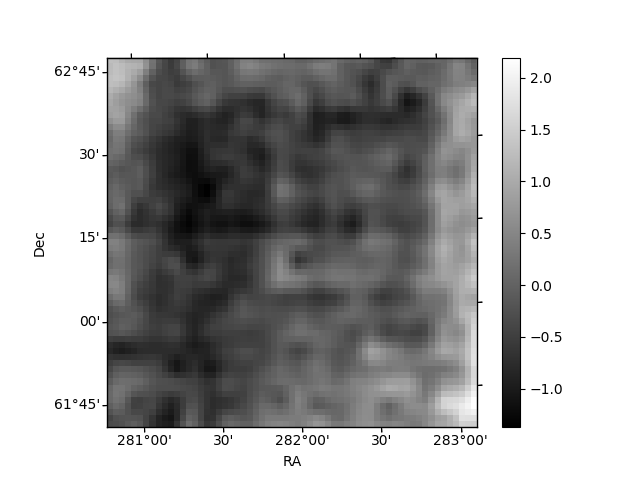
Histogram calculated using DETX and DETY for each event in the final _common_clean file
| Quadrant A | 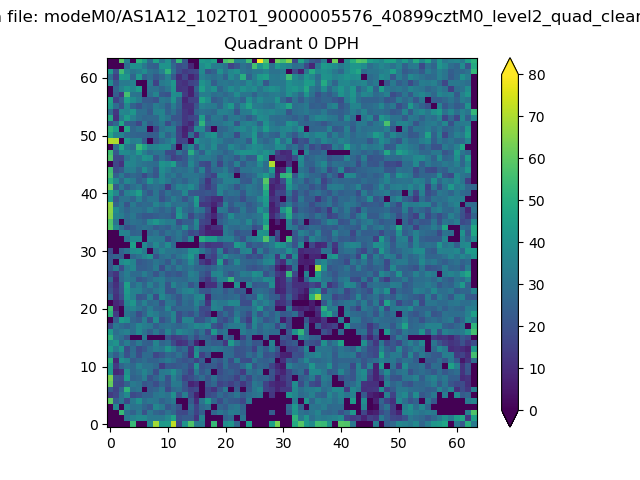 |
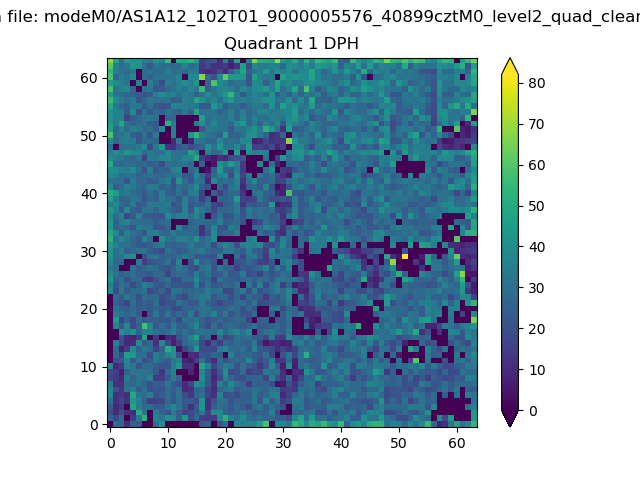 |
Quadrant B |
|---|---|---|---|
| Quadrant D | 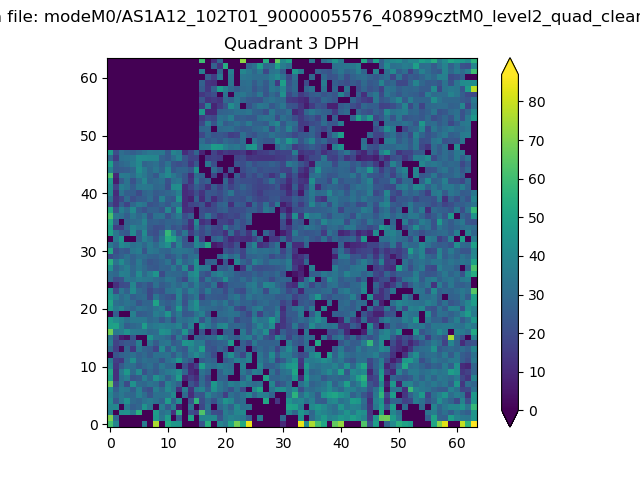 |
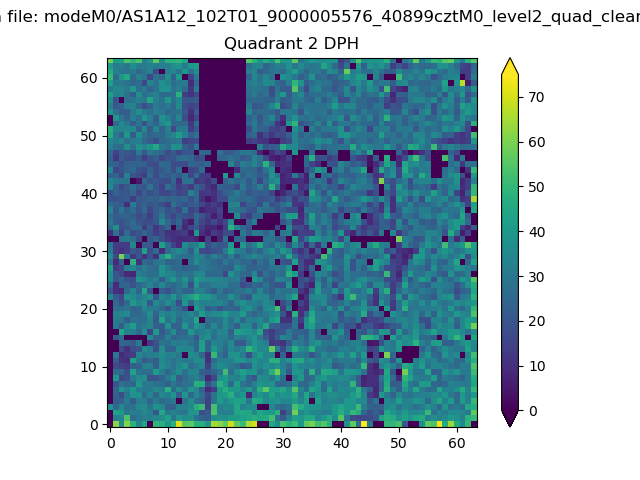 |
Quadrant C |
| Plot type | Count rate plots | Images |
|---|---|---|
| Comparison with Poisson distribution Blue bars denote a histogram of data divided into 1 sec bins. Red curve is a Poisson curve with rate = median count rate of data. |
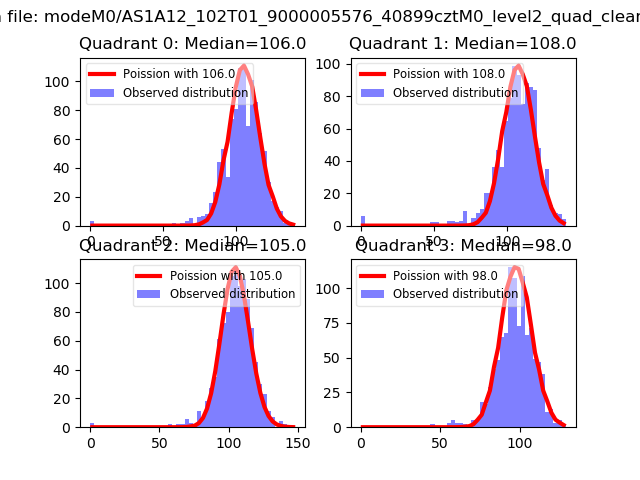 |
 |
| Quadrant-wise count rates Data is divided into 100 sec bins |
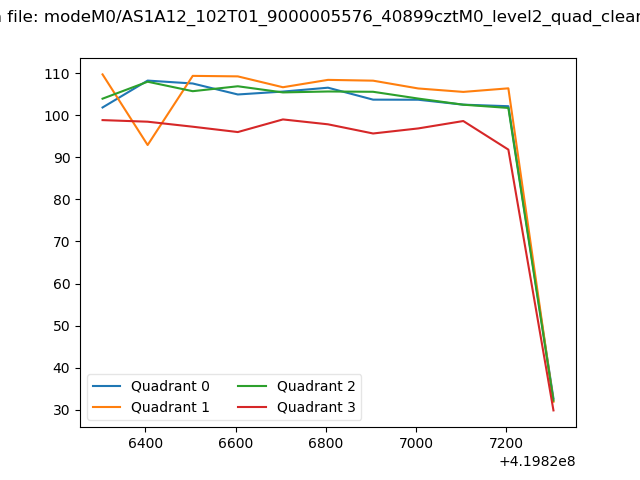 |
|
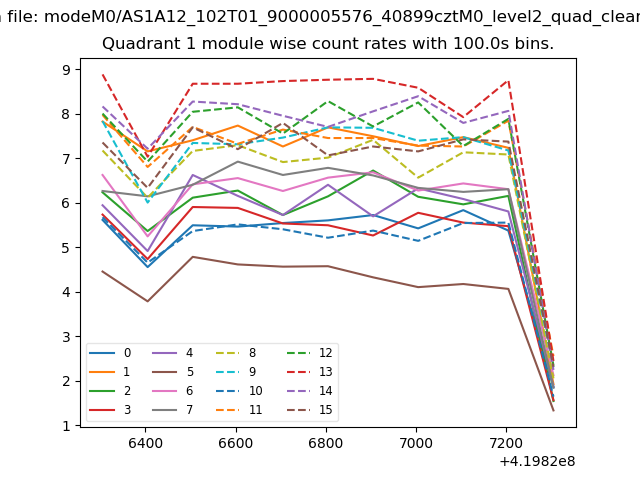
| Module-wise count rates for Quadrant A Data is divided into 100 sec bins |
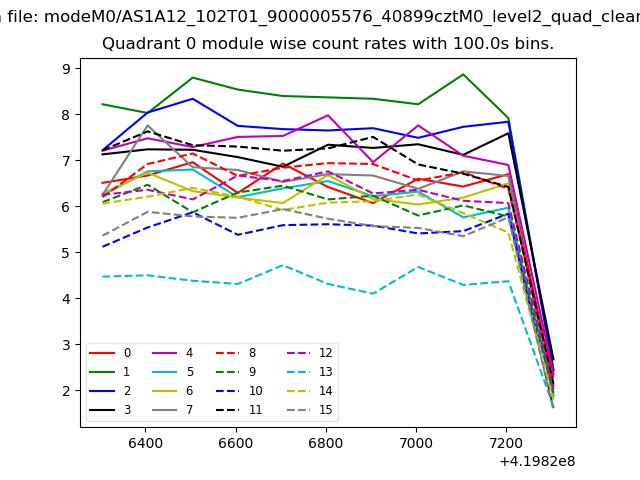 |
 |
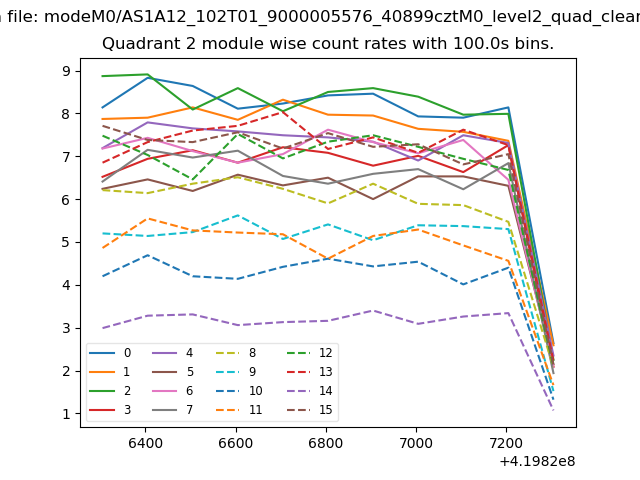
| Module-wise count rates for Quadrant B Data is divided into 100 sec bins |
 |
 |
| Module-wise count rates for Quadrant C Data is divided into 100 sec bins |
 |
 |
| Module-wise count rates for Quadrant D Data is divided into 100 sec bins |
 |
 |
| Parameter | Plot |
|---|---|
| CZT HV Monitor | 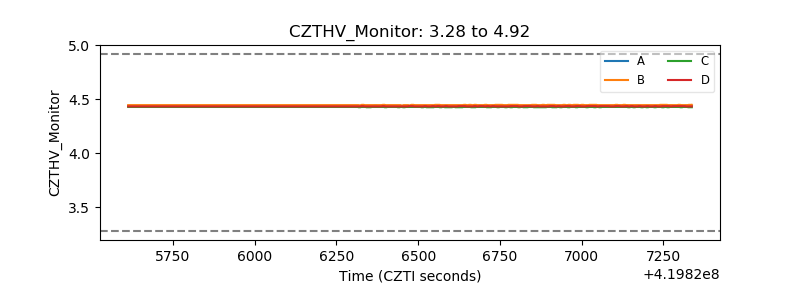 |
| D_VDD | 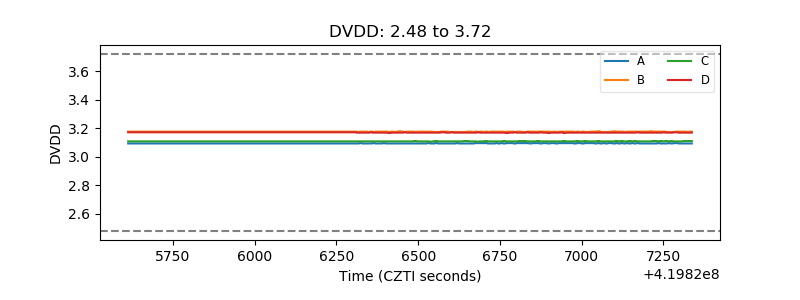 |
| Temperature 1 | 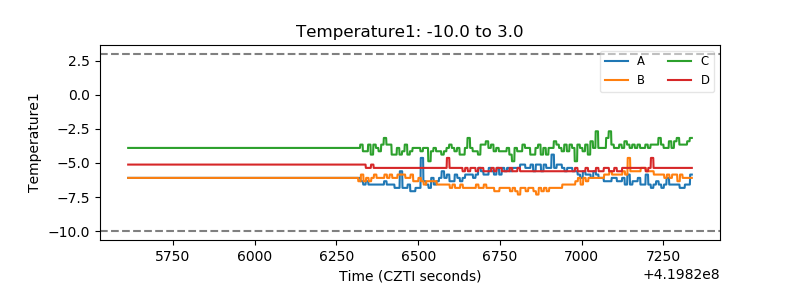 |
| Veto HV Monitor | 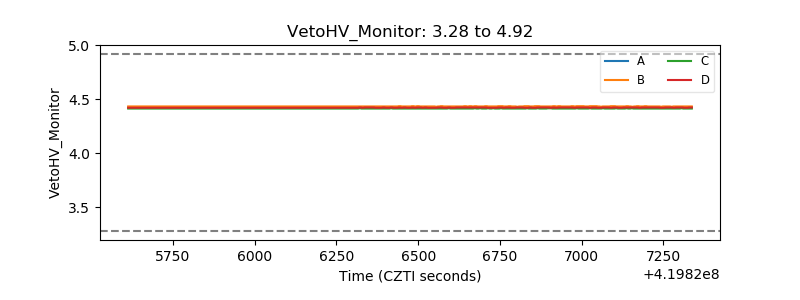 |
| Veto LLD | 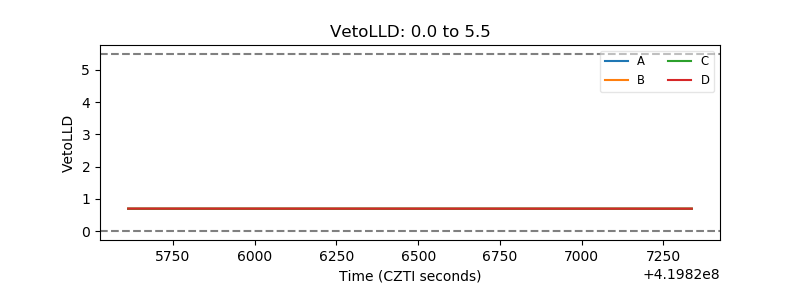 |
| Alpha Counter | 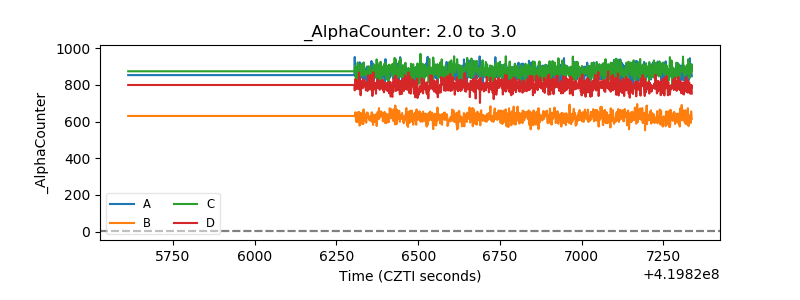 |
| _CPM_Rate | 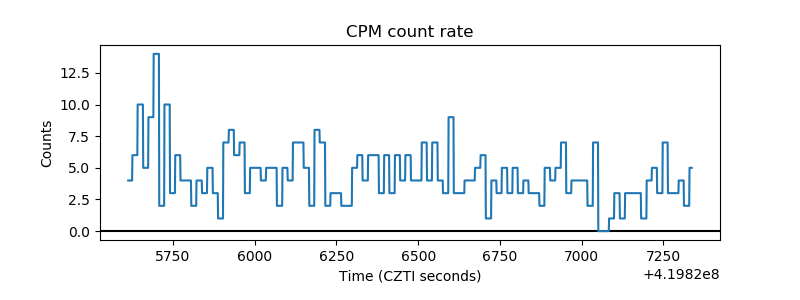 |
| CZT Counter | 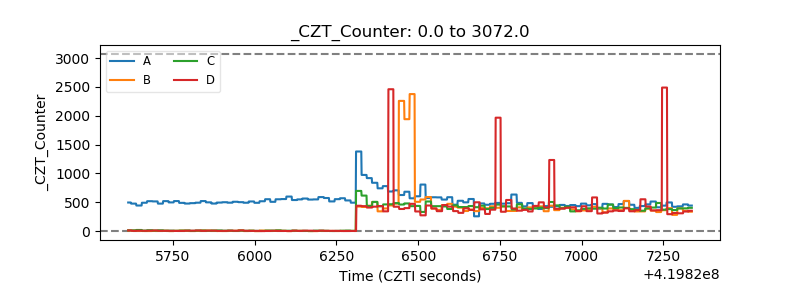 |
| +2.5 Volts monitor | 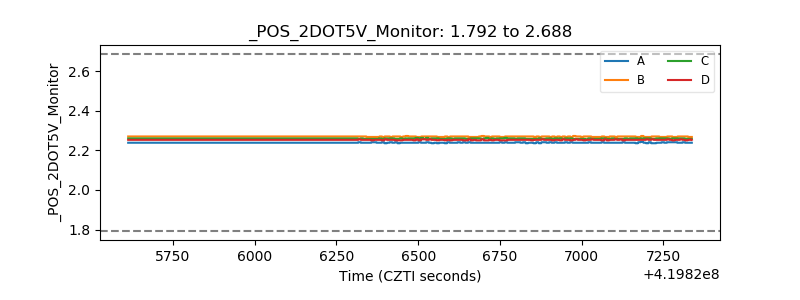 |
| +5 Volts monitor | 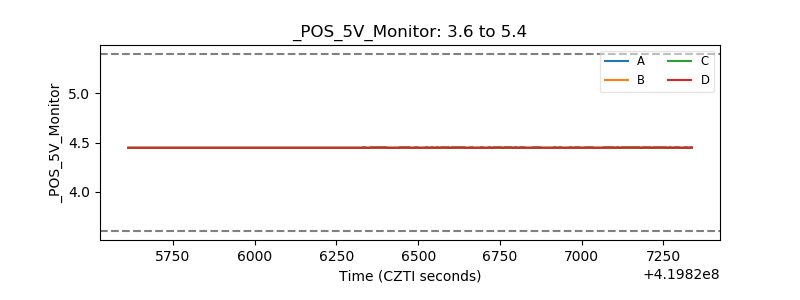 |
| _ROLL_ROT | 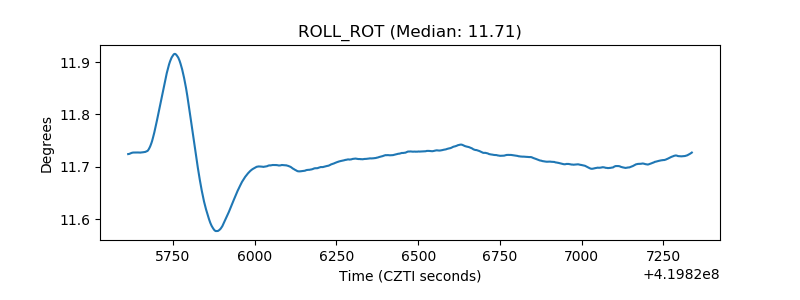 |
| _Roll_DEC | 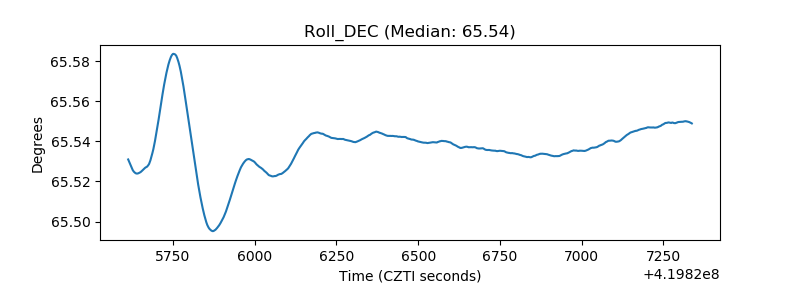 |
| _Roll_RA | 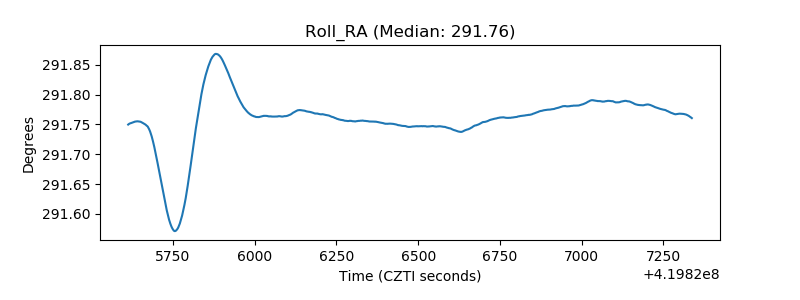 |
| Veto Counter | 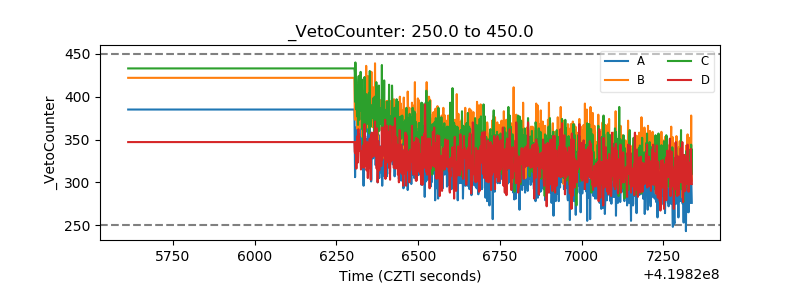 |