| Param | Original file | Final file |
|---|---|---|
| Filename | modeM0/AS1A12_102T01_9000005576_40900cztM0_level2.fits | modeM0/AS1A12_102T01_9000005576_40900cztM0_level2_quad_clean.evt |
| Size (bytes) | 357,059,520 | 94,057,920 |
| Size | 340.5 MB | 89.7 MB |
| Events in quadrant A | 3,080,202 | 630,563 |
| Events in quadrant B | 3,404,469 | 624,011 |
| Events in quadrant C | 3,145,027 | 614,515 |
| Events in quadrant D | 3,123,838 | 562,587 |
| Mode SS | |||
|---|---|---|---|
| Quadrant | BADHDUFLAG | Total packets | Discarded packets |
| A | 0 | 122 | 0 |
| B | 0 | 122 | 0 |
| C | 0 | 122 | 0 |
| D | 0 | 122 | 0 |
| Mode M0 | |||
|---|---|---|---|
| Quadrant | BADHDUFLAG | Total packets | Discarded packets |
| A | 0 | 12846 | 3 |
| B | 0 | 14479 | 2 |
| C | 0 | 13549 | 2 |
| D | 0 | 13770 | 2 |
| Mode M9 | |||
|---|---|---|---|
| Quadrant | BADHDUFLAG | Total packets | Discarded packets |
| A | 0 | 20 | 0 |
| B | 0 | 20 | 0 |
| C | 0 | 20 | 0 |
| D | 0 | 20 | 0 |
| Quadrant | Total seconds | Saturated seconds | Saturation percentage |
|---|---|---|---|
| A | 5951 | 15 | 0.252058% |
| B | 5951 | 316 | 5.310032% |
| C | 5951 | 124 | 2.083683% |
| D | 5951 | 114 | 1.915644% |
Noise dominated data is calculated using 1-second bins in cleaned event files. If a bin has >2000 counts, and if more than 50% of those come from <1% of pixels, then it is considered to be noise-dominated and hence unusable.
| Quadrant | # 1 sec bins | Bins with >0 counts | Bins with >2000 counts | High rate bins dominated by noise | Noise dominated (total time) | Noise dominated (detector-on time) | Marked lightcurve |
|---|---|---|---|---|---|---|---|
| A | 7264 | 5952 | 4 | 4 | 0.06% | 0.07% | 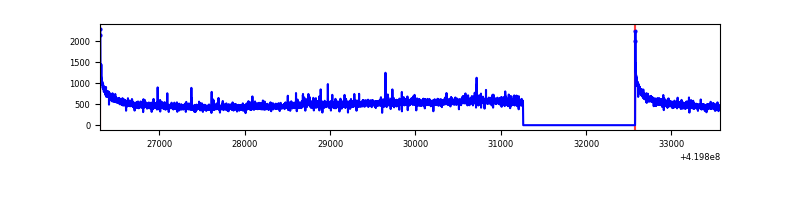 |
| B | 7264 | 5952 | 182 | 182 | 2.51% | 3.06% | 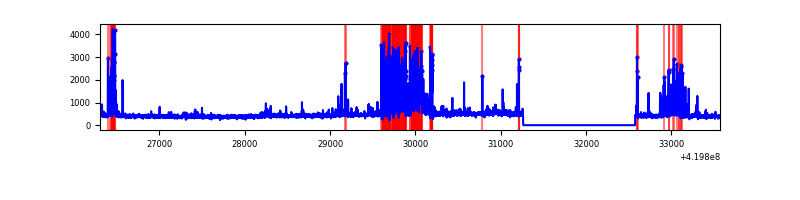 |
| C | 7264 | 5952 | 85 | 85 | 1.17% | 1.43% | 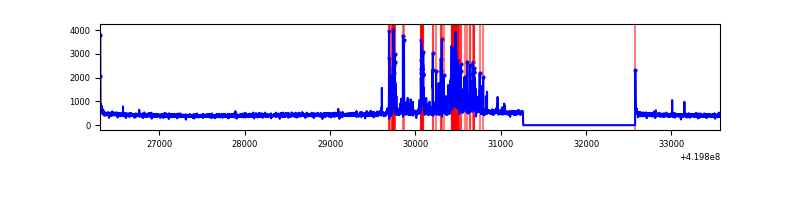 |
| D | 7264 | 5952 | 96 | 96 | 1.32% | 1.61% | 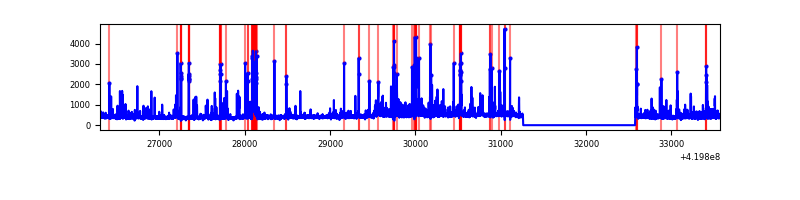 |
Top three noisy pixels from each quadrant. If the there are fewer than three noisy pixels in the level2.evt file, extra rows are filled as -1
| Pixel properties | Quadrant properties | ||||||
|---|---|---|---|---|---|---|---|
| Quadrant | DetID | PixID | Counts | Sigma | Mean | Median | Sigma |
| A | 10 | 83 | 580833 | 4449.75 | 629 | 615 | 130.4 |
| A | 12 | 189 | 35749 | 269.45 | 629 | 615 | 130.4 |
| A | 2 | 79 | 14390 | 105.64 | 629 | 615 | 130.4 |
| B | 4 | 171 | 655312 | 5454.07 | 616 | 599 | 120.0 |
| B | 5 | 255 | 184419 | 1531.31 | 616 | 599 | 120.0 |
| B | 0 | 190 | 65648 | 541.89 | 616 | 599 | 120.0 |
| C | 14 | 254 | 465267 | 3238.69 | 608 | 611 | 143.5 |
| C | 15 | 214 | 254415 | 1769.04 | 608 | 611 | 143.5 |
| C | 0 | 10 | 25279 | 171.94 | 608 | 611 | 143.5 |
| D | 12 | 6 | 227027 | 1510.65 | 606 | 588 | 149.9 |
| D | 12 | 233 | 125404 | 832.69 | 606 | 588 | 149.9 |
| D | 2 | 249 | 76403 | 505.79 | 606 | 588 | 149.9 |
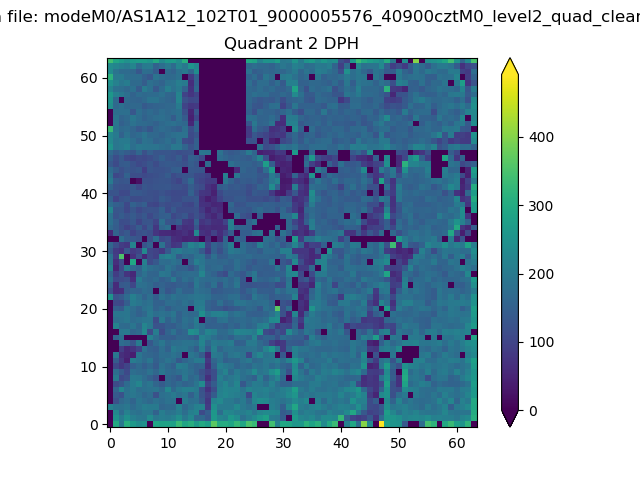
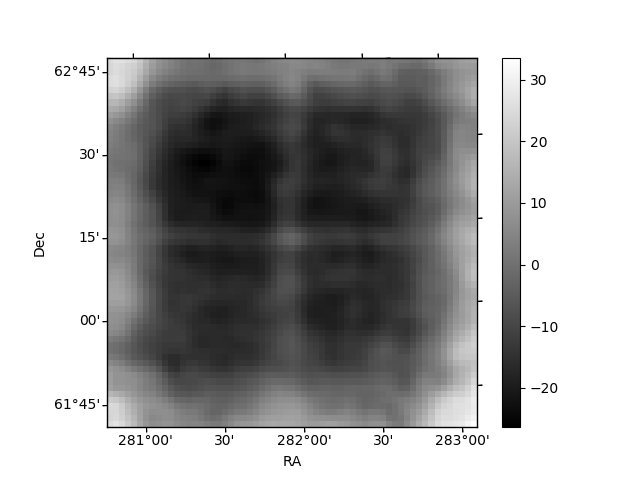
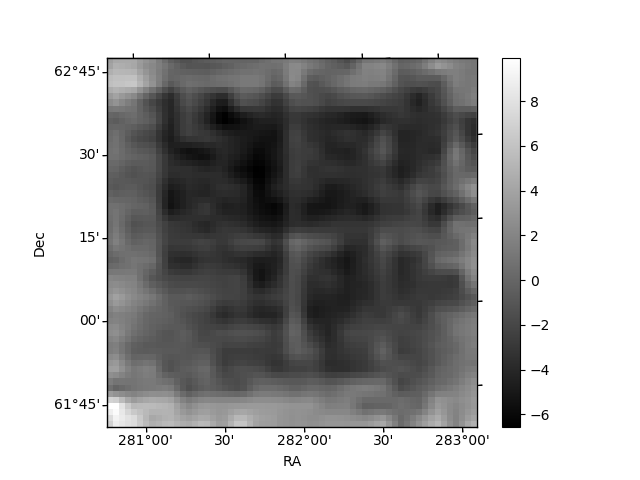
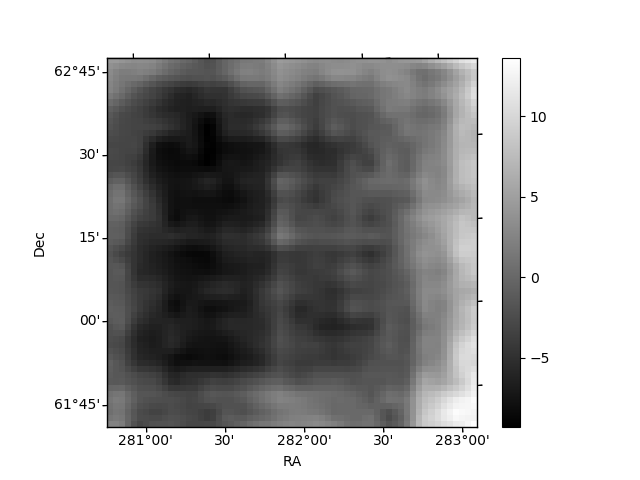
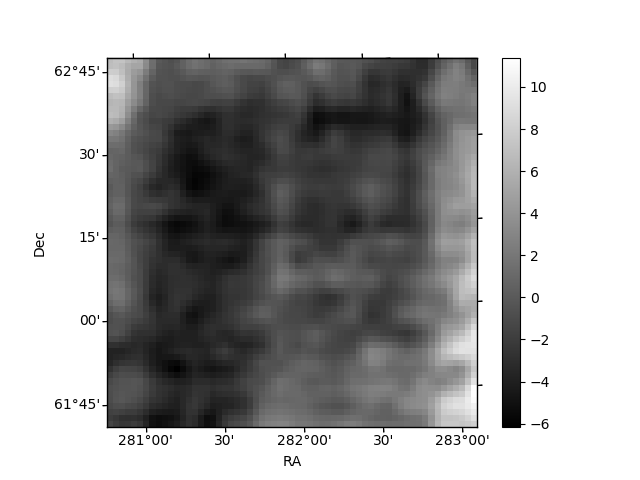
Histogram calculated using DETX and DETY for each event in the final _common_clean file
| Quadrant A | 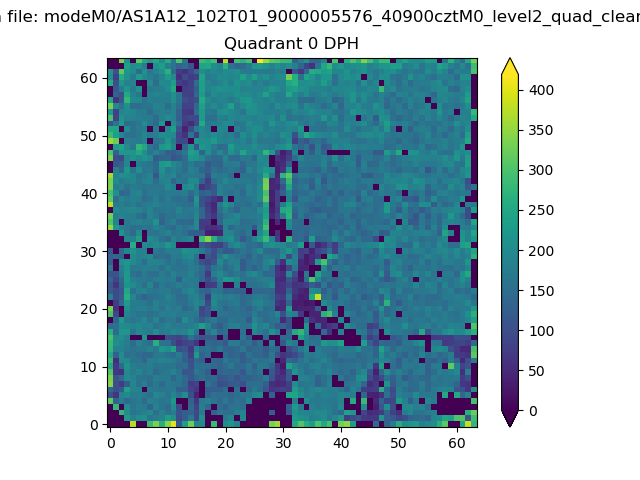 |
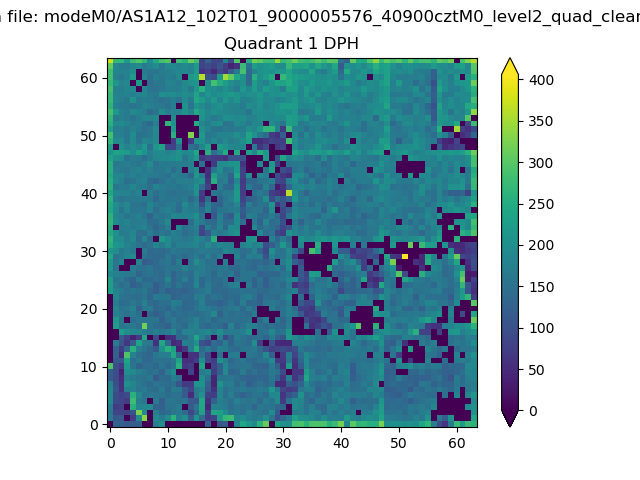 |
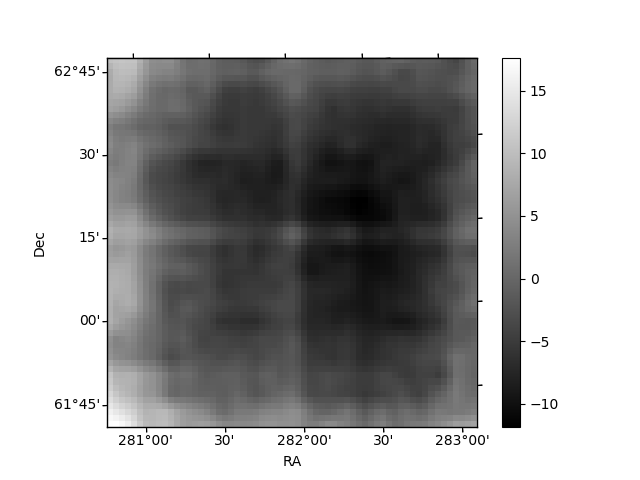
Quadrant B |
|---|---|---|---|
| Quadrant D | 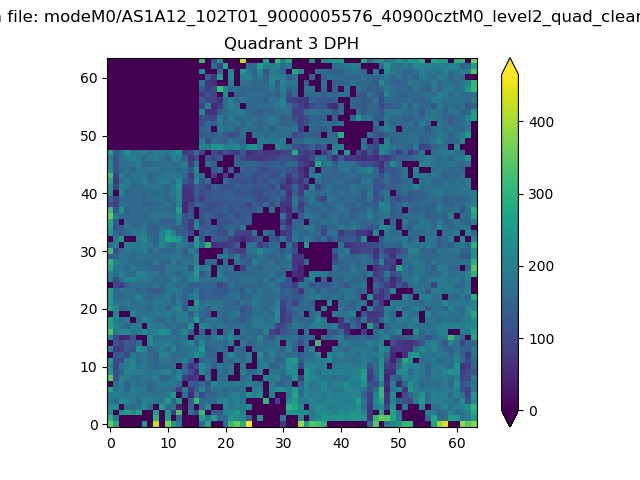 |
 |
Quadrant C |
| Plot type | Count rate plots | Images |
|---|---|---|
| Comparison with Poisson distribution Blue bars denote a histogram of data divided into 1 sec bins. Red curve is a Poisson curve with rate = median count rate of data. |
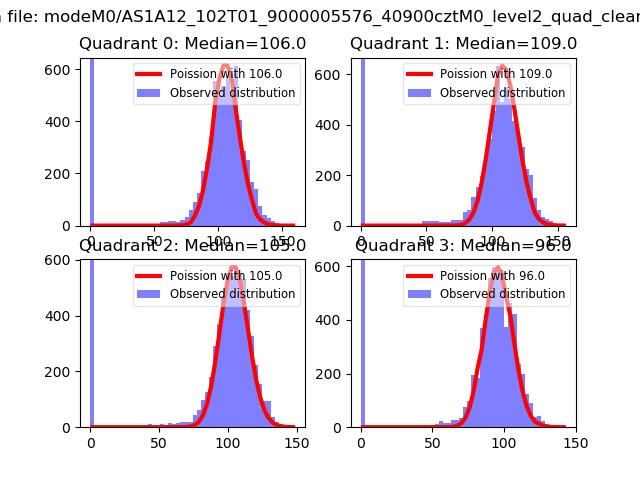 |
 |
| Quadrant-wise count rates Data is divided into 100 sec bins |
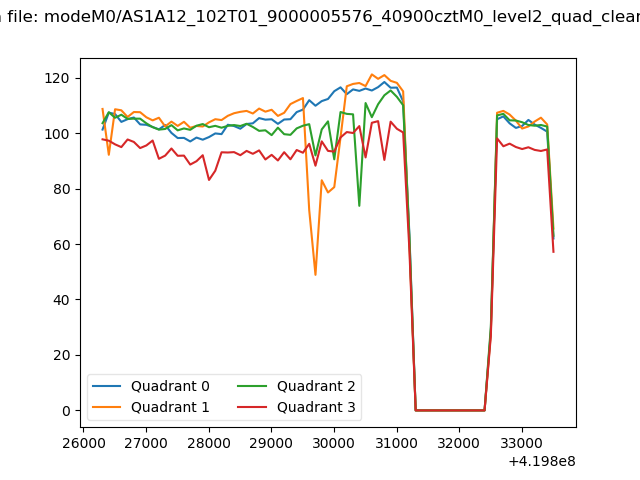 |
|
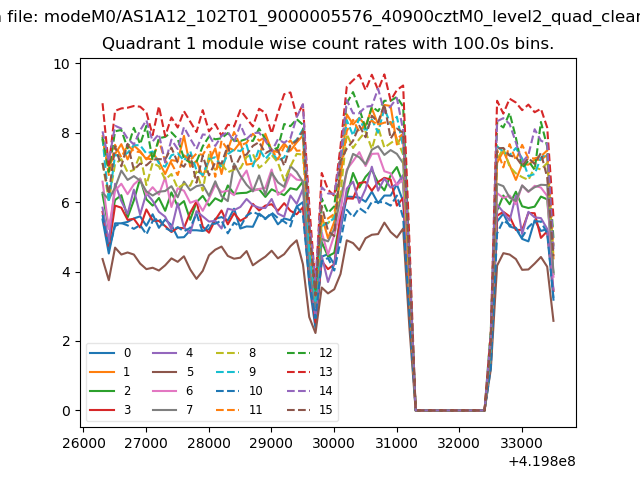
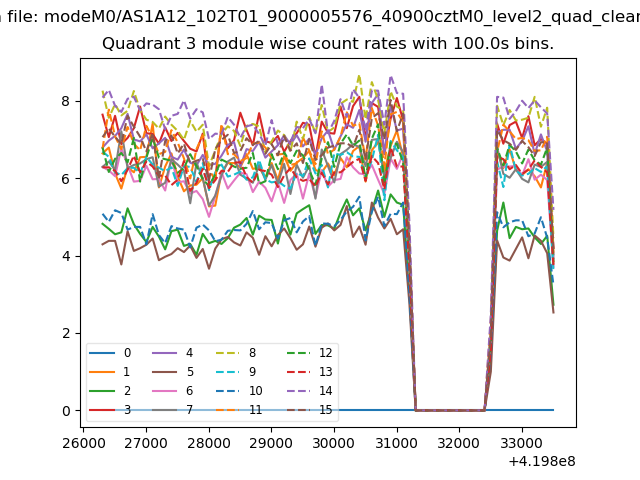
| Module-wise count rates for Quadrant A Data is divided into 100 sec bins |
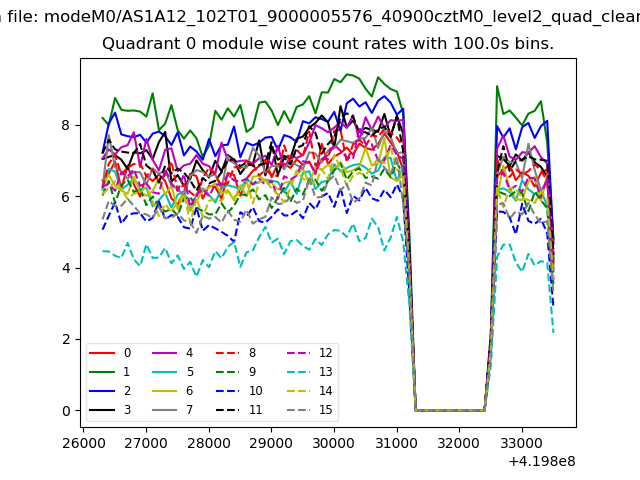 |
 |
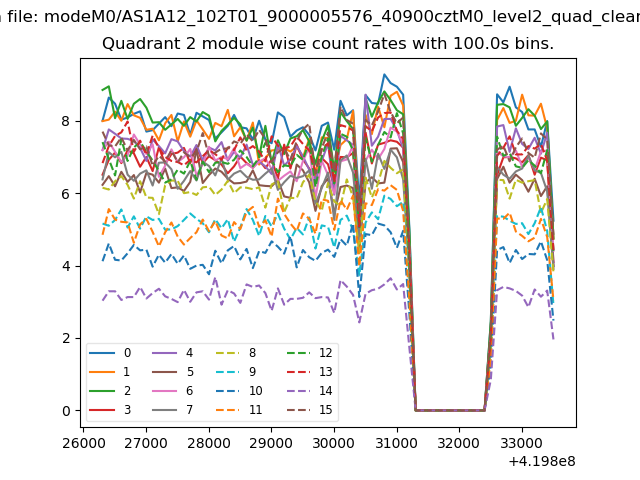
| Module-wise count rates for Quadrant B Data is divided into 100 sec bins |
 |
 |
| Module-wise count rates for Quadrant C Data is divided into 100 sec bins |
 |
 |
| Module-wise count rates for Quadrant D Data is divided into 100 sec bins |
 |
 |
| Parameter | Plot |
|---|---|
| CZT HV Monitor | 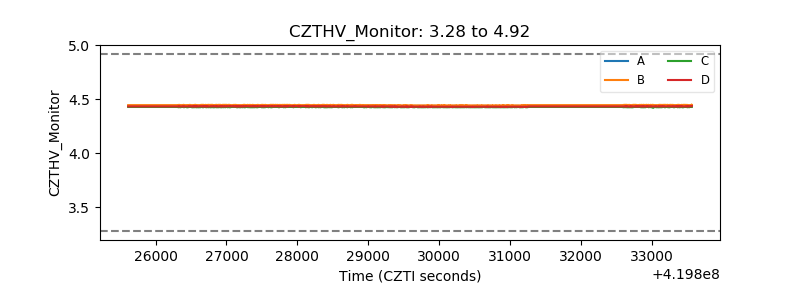 |
| D_VDD | 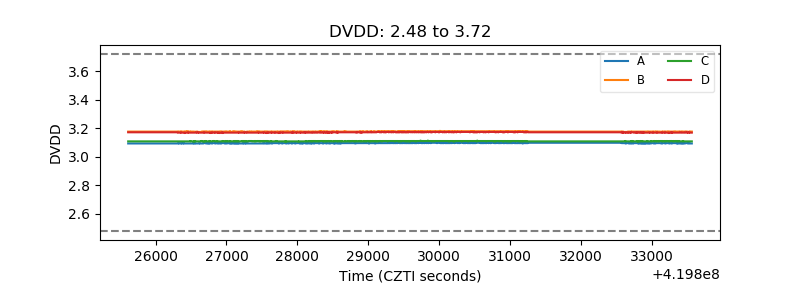 |
| Temperature 1 | 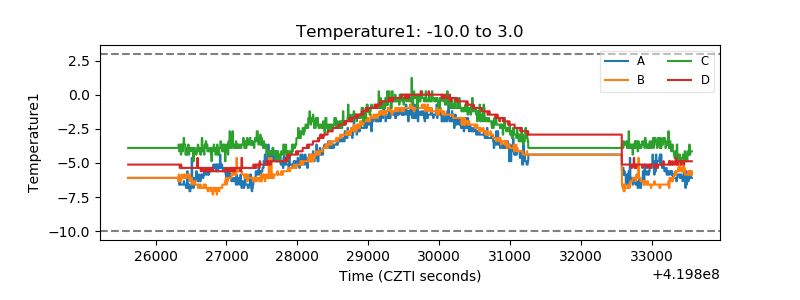 |
| Veto HV Monitor | 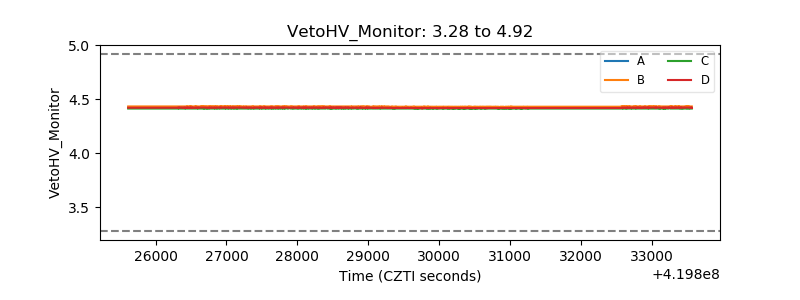 |
| Veto LLD | 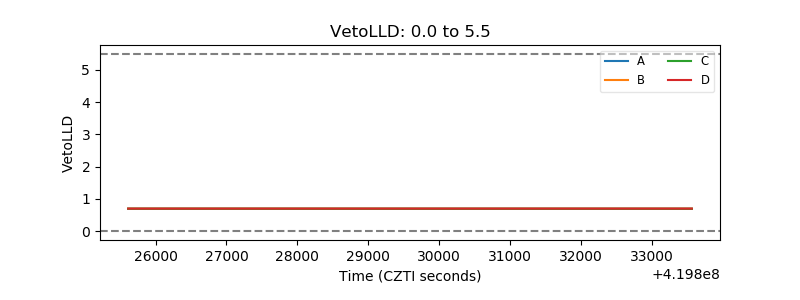 |
| Alpha Counter | 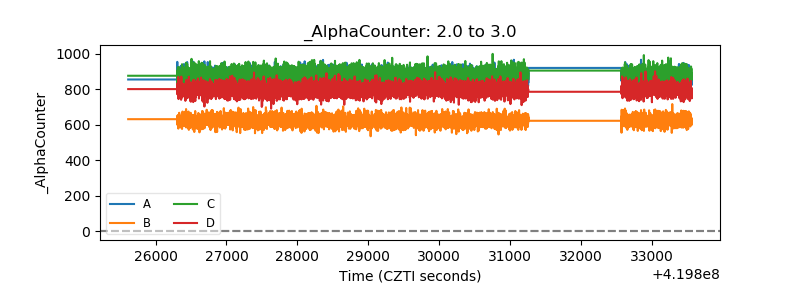 |
| _CPM_Rate | 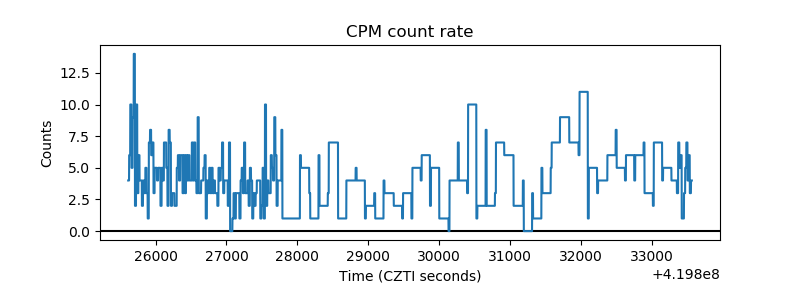 |
| CZT Counter | 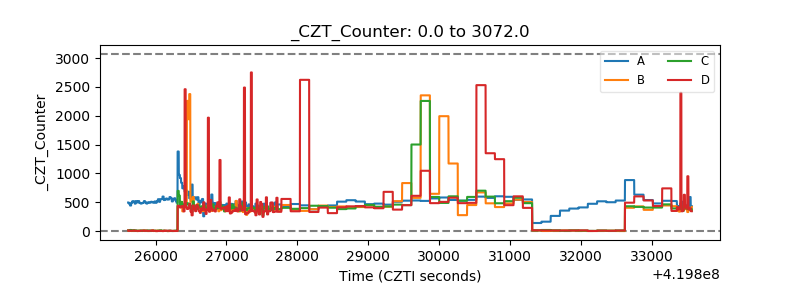 |
| +2.5 Volts monitor |  |
| +5 Volts monitor |  |
| _ROLL_ROT | 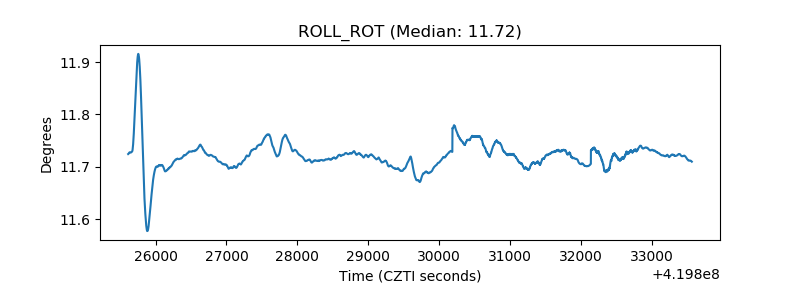 |
| _Roll_DEC | 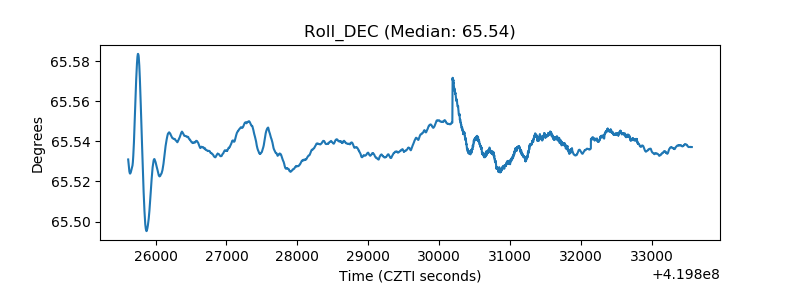 |
| _Roll_RA | 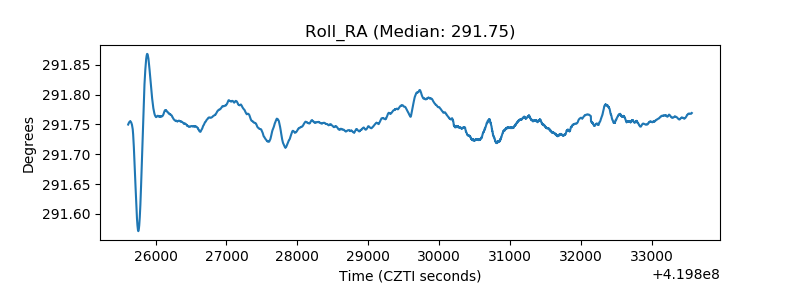 |
| Veto Counter | 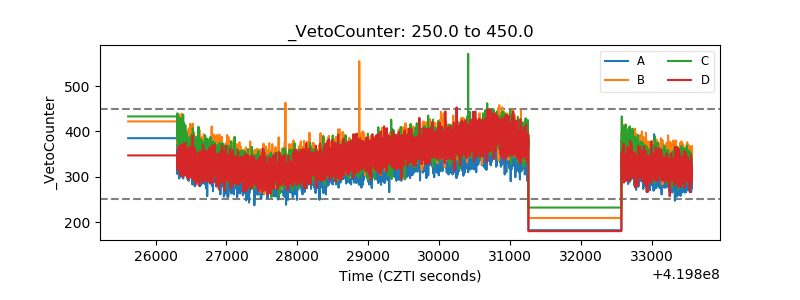 |