| Param | Original file | Final file |
|---|---|---|
| Filename | modeM0/AS1A12_102T01_9000005576_40901cztM0_level2.fits | modeM0/AS1A12_102T01_9000005576_40901cztM0_level2_quad_clean.evt |
| Size (bytes) | 345,548,160 | 94,530,240 |
| Size | 329.5 MB | 90.2 MB |
| Events in quadrant A | 3,099,860 | 628,138 |
| Events in quadrant B | 3,030,746 | 640,780 |
| Events in quadrant C | 2,686,710 | 619,175 |
| Events in quadrant D | 3,511,646 | 559,190 |
| Mode SS | |||
|---|---|---|---|
| Quadrant | BADHDUFLAG | Total packets | Discarded packets |
| A | 0 | 122 | 0 |
| B | 0 | 122 | 0 |
| C | 0 | 122 | 0 |
| D | 0 | 122 | 0 |
| Mode M0 | |||
|---|---|---|---|
| Quadrant | BADHDUFLAG | Total packets | Discarded packets |
| A | 0 | 12710 | 3 |
| B | 0 | 13218 | 2 |
| C | 0 | 11987 | 2 |
| D | 0 | 14695 | 12 |
| Mode M9 | |||
|---|---|---|---|
| Quadrant | BADHDUFLAG | Total packets | Discarded packets |
| A | 0 | 13 | 0 |
| B | 0 | 13 | 0 |
| C | 0 | 13 | 0 |
| D | 0 | 13 | 0 |
| Quadrant | Total seconds | Saturated seconds | Saturation percentage |
|---|---|---|---|
| A | 5934 | 4 | 0.067408% |
| B | 5934 | 93 | 1.567240% |
| C | 5934 | 8 | 0.134816% |
| D | 5930 | 115 | 1.939292% |
Noise dominated data is calculated using 1-second bins in cleaned event files. If a bin has >2000 counts, and if more than 50% of those come from <1% of pixels, then it is considered to be noise-dominated and hence unusable.
| Quadrant | # 1 sec bins | Bins with >0 counts | Bins with >2000 counts | High rate bins dominated by noise | Noise dominated (total time) | Noise dominated (detector-on time) | Marked lightcurve |
|---|---|---|---|---|---|---|---|
| A | 7247 | 5935 | 3 | 3 | 0.04% | 0.05% | 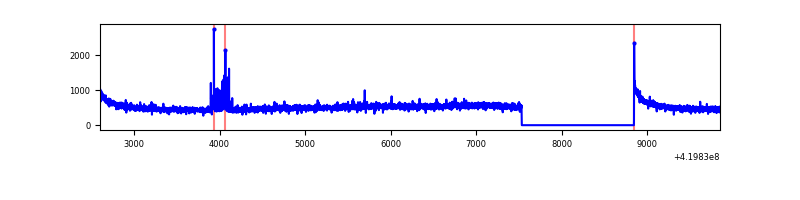 |
| B | 7247 | 5935 | 58 | 58 | 0.80% | 0.98% | 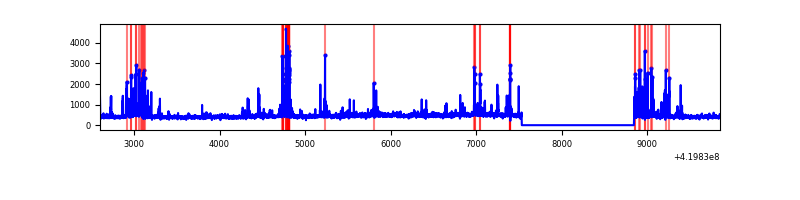 |
| C | 7247 | 5935 | 3 | 3 | 0.04% | 0.05% | 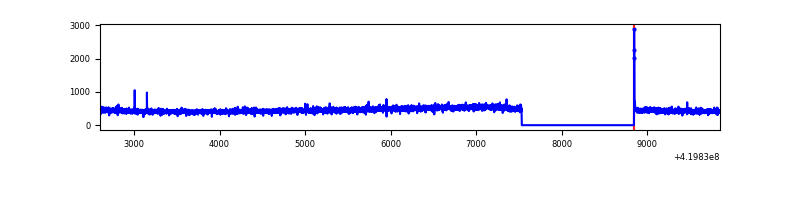 |
| D | 7247 | 5933 | 112 | 112 | 1.55% | 1.89% | 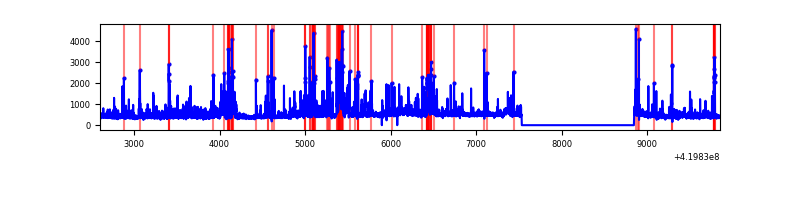 |
Top three noisy pixels from each quadrant. If the there are fewer than three noisy pixels in the level2.evt file, extra rows are filled as -1
| Pixel properties | Quadrant properties | ||||||
|---|---|---|---|---|---|---|---|
| Quadrant | DetID | PixID | Counts | Sigma | Mean | Median | Sigma |
| A | 10 | 83 | 557231 | 4285.19 | 631 | 618 | 129.9 |
| A | 2 | 79 | 70024 | 534.34 | 631 | 618 | 129.9 |
| A | 12 | 189 | 15252 | 112.66 | 631 | 618 | 129.9 |
| B | 4 | 171 | 249423 | 2018.2 | 627 | 609 | 123.3 |
| B | 5 | 255 | 213207 | 1724.44 | 627 | 609 | 123.3 |
| B | 0 | 190 | 47078 | 376.92 | 627 | 609 | 123.3 |
| C | 15 | 214 | 251267 | 1733.18 | 617 | 620 | 144.6 |
| C | 3 | 233 | 11832 | 77.53 | 617 | 620 | 144.6 |
| C | 0 | 10 | 11041 | 72.06 | 617 | 620 | 144.6 |
| D | 12 | 128 | 376215 | 2525.95 | 610 | 593 | 148.7 |
| D | 12 | 233 | 267264 | 1793.28 | 610 | 593 | 148.7 |
| D | 12 | 79 | 109928 | 735.25 | 610 | 593 | 148.7 |
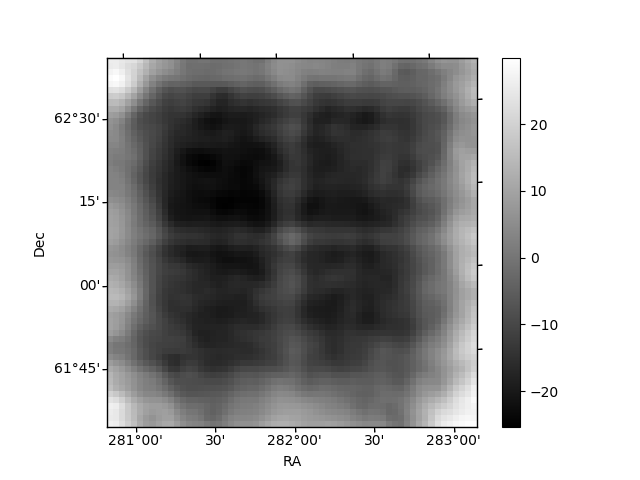
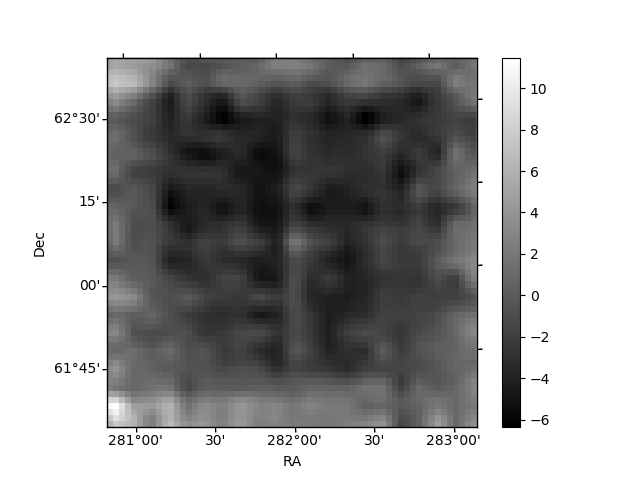
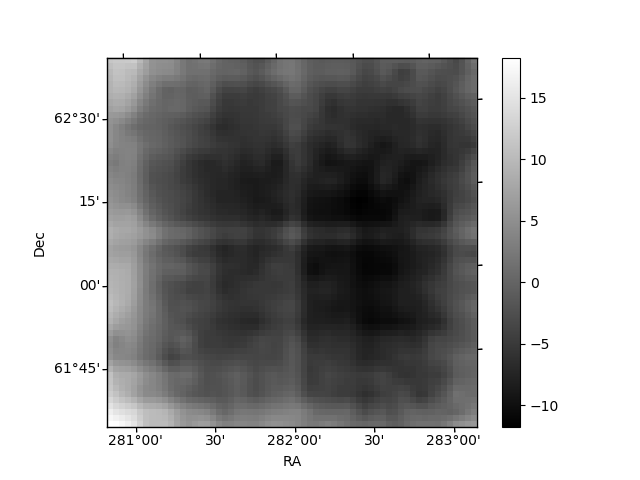
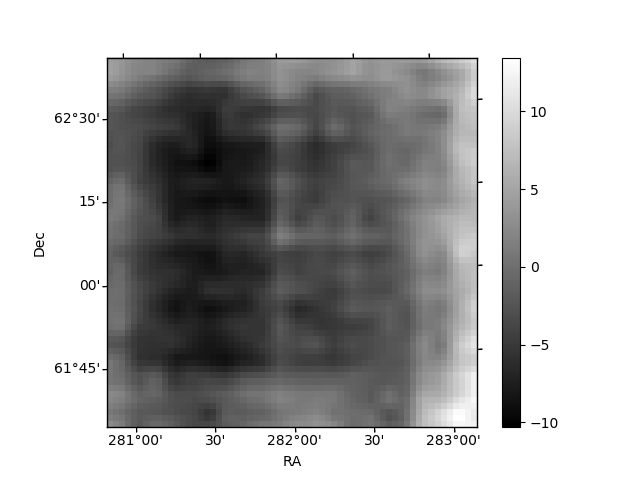
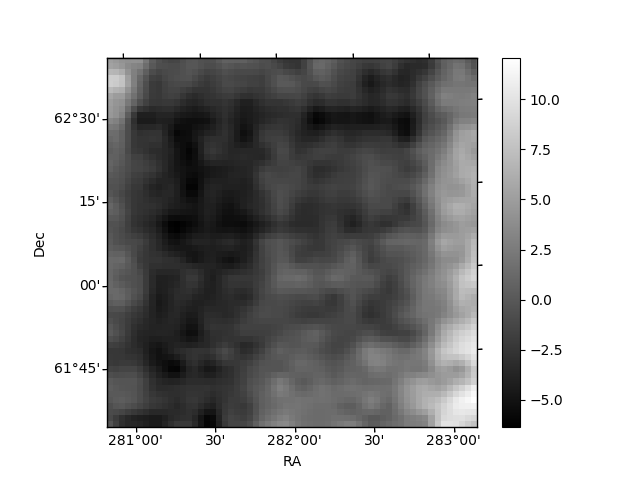
Histogram calculated using DETX and DETY for each event in the final _common_clean file
| Quadrant A | 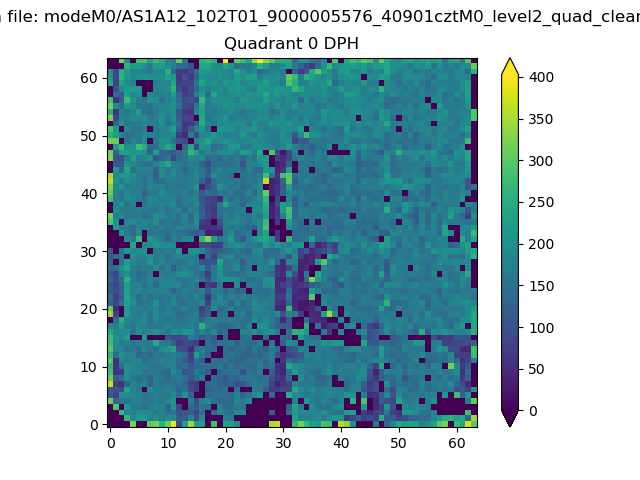 |
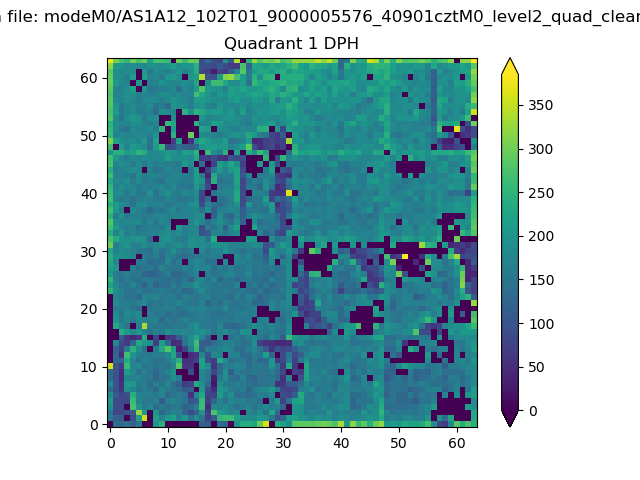 |
Quadrant B |
|---|---|---|---|
| Quadrant D | 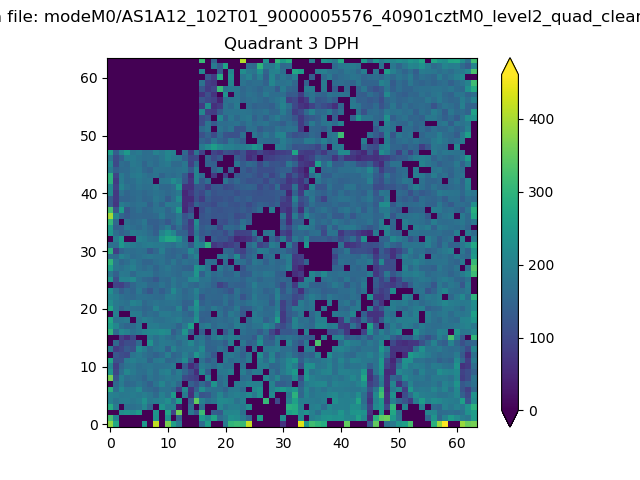 |
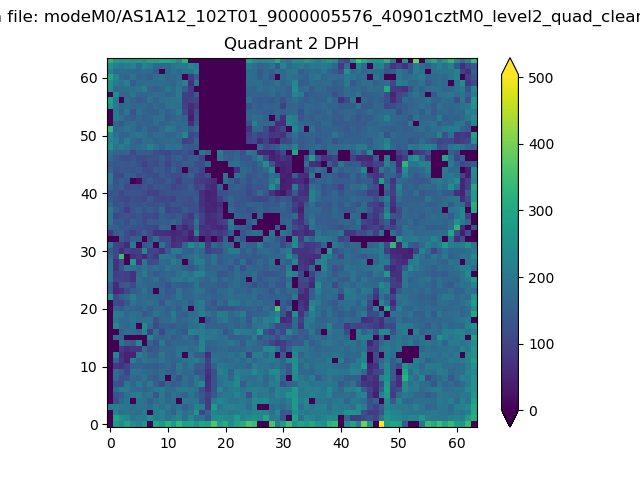 |
Quadrant C |
| Plot type | Count rate plots | Images |
|---|---|---|
| Comparison with Poisson distribution Blue bars denote a histogram of data divided into 1 sec bins. Red curve is a Poisson curve with rate = median count rate of data. |
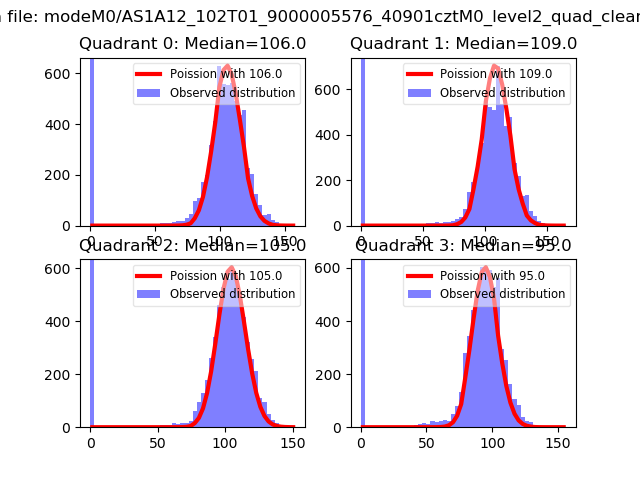 |
 |
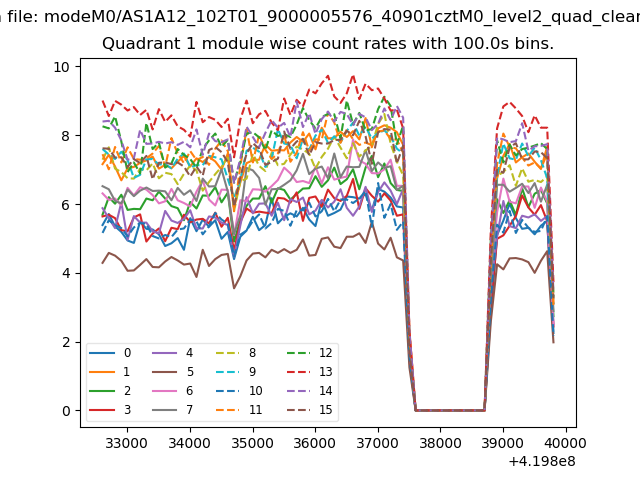
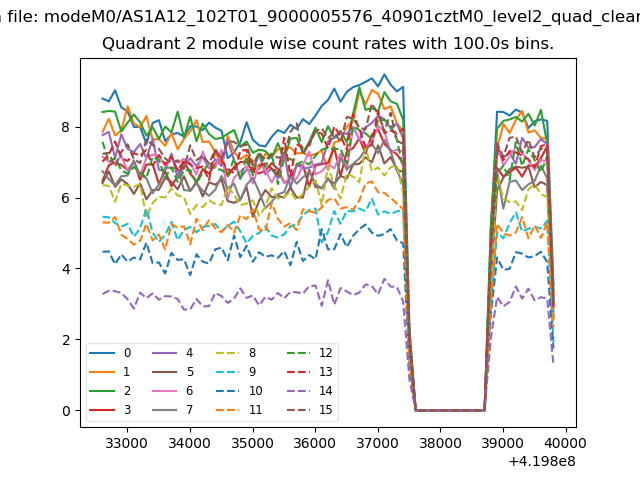
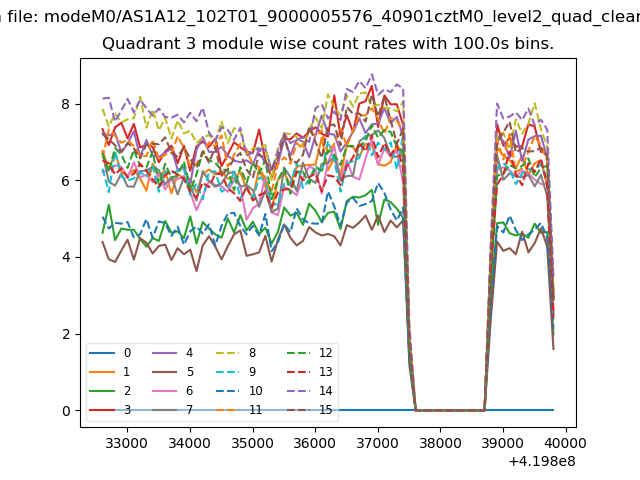
| Quadrant-wise count rates Data is divided into 100 sec bins |
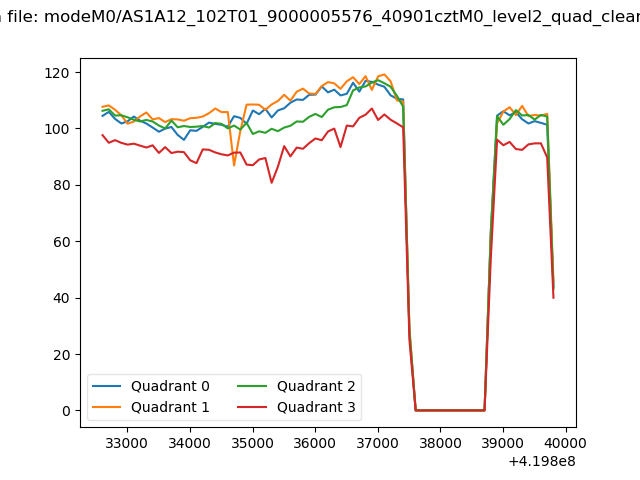 |
|
| Module-wise count rates for Quadrant A Data is divided into 100 sec bins |
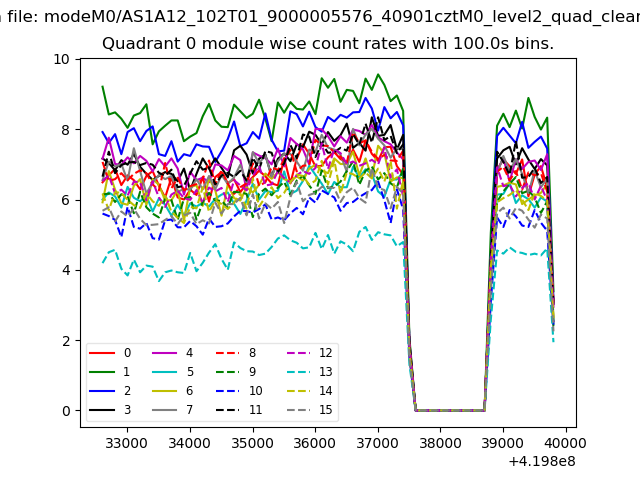 |
 |
| Module-wise count rates for Quadrant B Data is divided into 100 sec bins |
 |
 |
| Module-wise count rates for Quadrant C Data is divided into 100 sec bins |
 |
 |
| Module-wise count rates for Quadrant D Data is divided into 100 sec bins |
 |
 |
| Parameter | Plot |
|---|---|
| CZT HV Monitor | 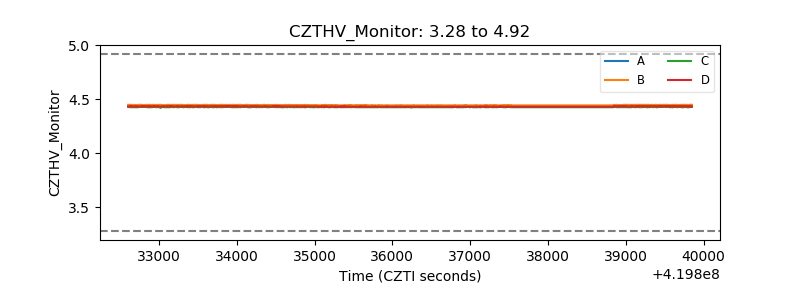 |
| D_VDD | 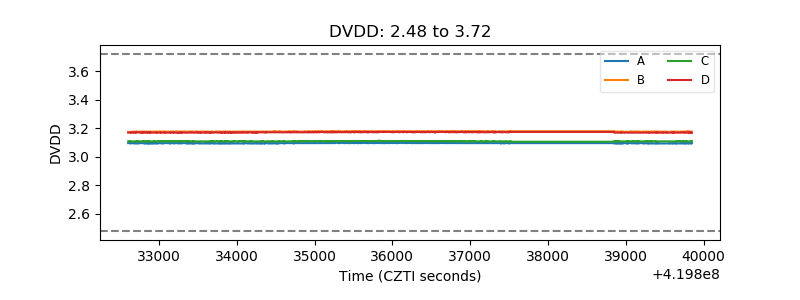 |
| Temperature 1 | 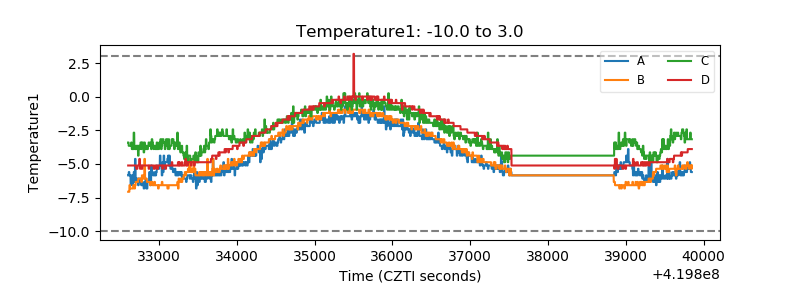 |
| Veto HV Monitor | 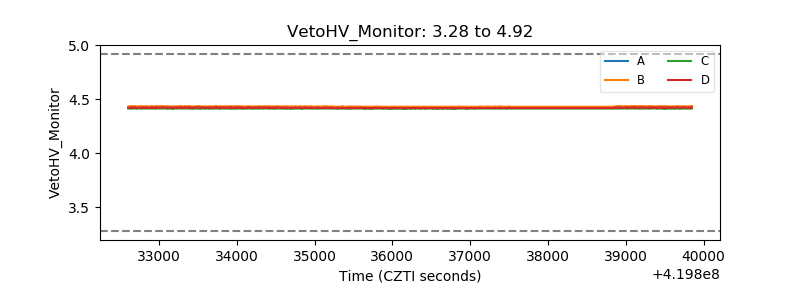 |
| Veto LLD | 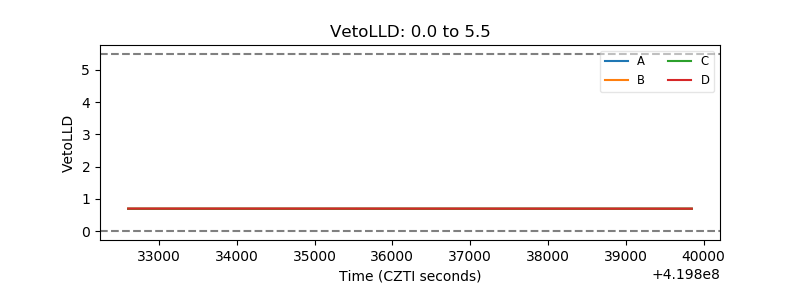 |
| Alpha Counter | 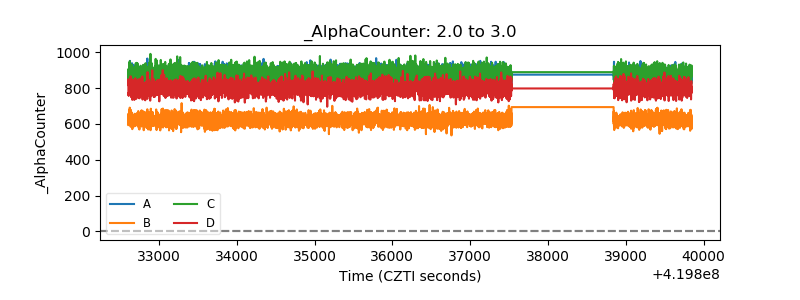 |
| _CPM_Rate | 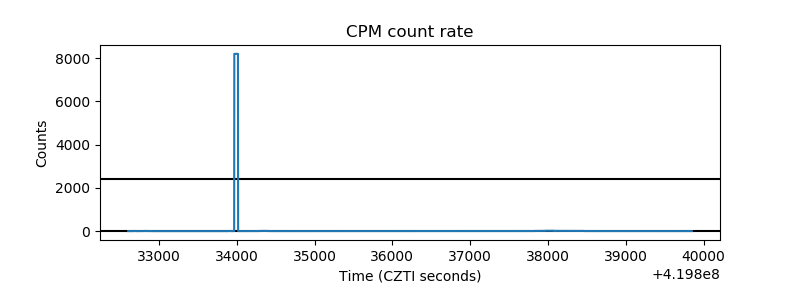 |
| CZT Counter | 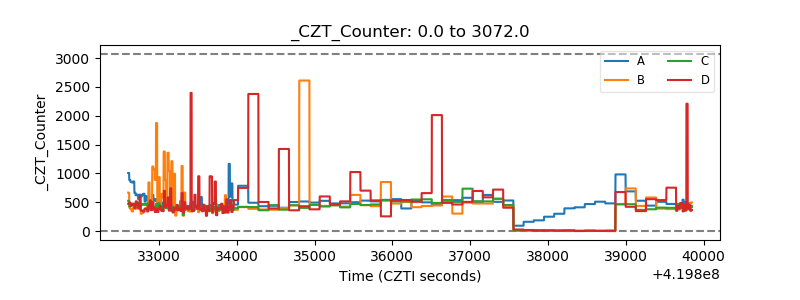 |
| +2.5 Volts monitor | 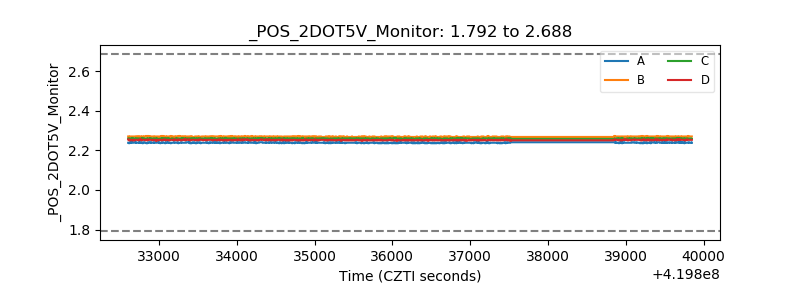 |
| +5 Volts monitor | 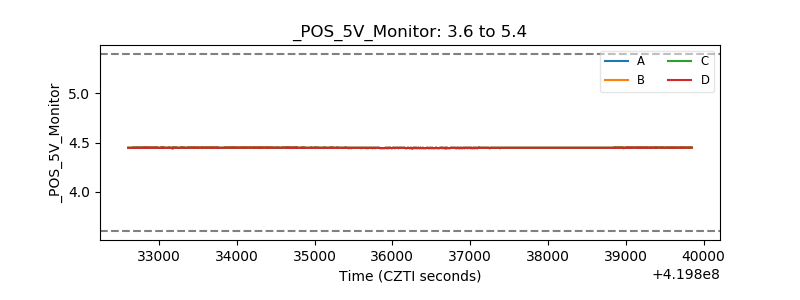 |
| _ROLL_ROT | 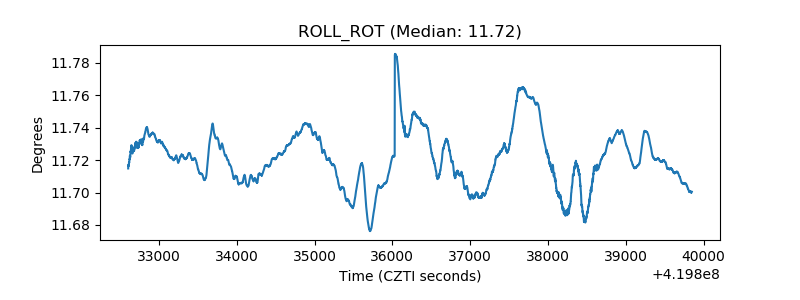 |
| _Roll_DEC | 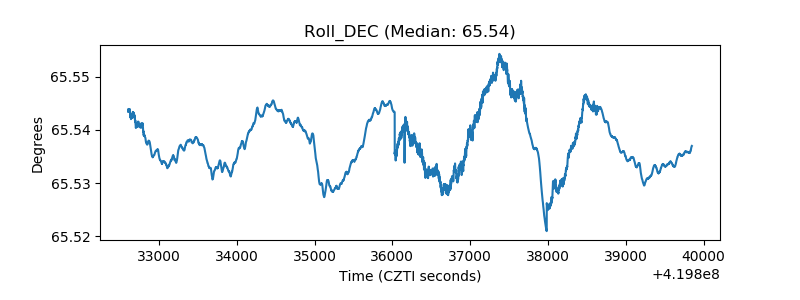 |
| _Roll_RA | 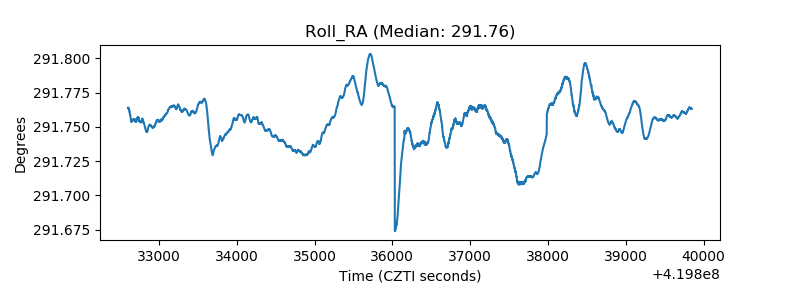 |
| Veto Counter | 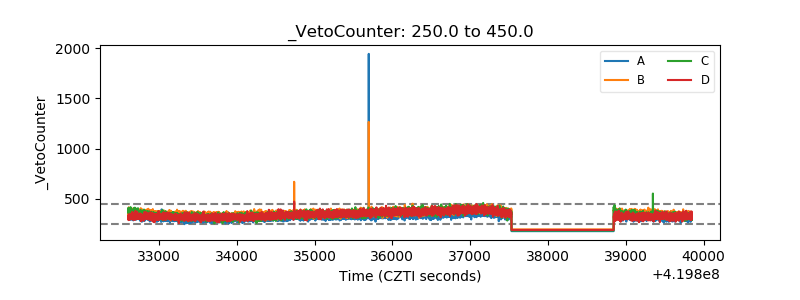 |