| Param | Original file | Final file |
|---|---|---|
| Filename | modeM0/AS1A12_102T01_9000005576_40903cztM0_level2.fits | modeM0/AS1A12_102T01_9000005576_40903cztM0_level2_quad_clean.evt |
| Size (bytes) | 622,514,880 | 169,568,640 |
| Size | 593.7 MB | 161.7 MB |
| Events in quadrant A | 5,591,341 | 1,134,213 |
| Events in quadrant B | 5,893,186 | 1,141,187 |
| Events in quadrant C | 4,999,608 | 1,108,903 |
| Events in quadrant D | 5,723,070 | 1,003,376 |
| Mode SS | |||
|---|---|---|---|
| Quadrant | BADHDUFLAG | Total packets | Discarded packets |
| A | 0 | 220 | 0 |
| B | 0 | 220 | 0 |
| C | 0 | 220 | 0 |
| D | 0 | 220 | 0 |
| Mode M0 | |||
|---|---|---|---|
| Quadrant | BADHDUFLAG | Total packets | Discarded packets |
| A | 0 | 22833 | 4 |
| B | 0 | 25043 | 3 |
| C | 0 | 21842 | 3 |
| D | 0 | 24615 | 3 |
| Mode M9 | |||
|---|---|---|---|
| Quadrant | BADHDUFLAG | Total packets | Discarded packets |
| A | 0 | 34 | 0 |
| B | 0 | 34 | 0 |
| C | 0 | 34 | 0 |
| D | 0 | 35 | 0 |
| Quadrant | Total seconds | Saturated seconds | Saturation percentage |
|---|---|---|---|
| A | 10773 | 13 | 0.120672% |
| B | 10773 | 285 | 2.645503% |
| C | 10773 | 22 | 0.204214% |
| D | 10773 | 184 | 1.707974% |
Noise dominated data is calculated using 1-second bins in cleaned event files. If a bin has >2000 counts, and if more than 50% of those come from <1% of pixels, then it is considered to be noise-dominated and hence unusable.
| Quadrant | # 1 sec bins | Bins with >0 counts | Bins with >2000 counts | High rate bins dominated by noise | Noise dominated (total time) | Noise dominated (detector-on time) | Marked lightcurve |
|---|---|---|---|---|---|---|---|
| A | 13579 | 10775 | 4 | 4 | 0.03% | 0.04% | 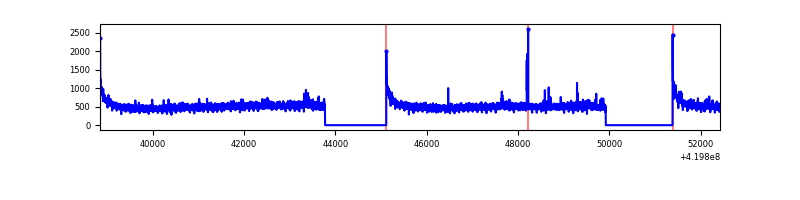 |
| B | 13579 | 10775 | 232 | 232 | 1.71% | 2.15% | 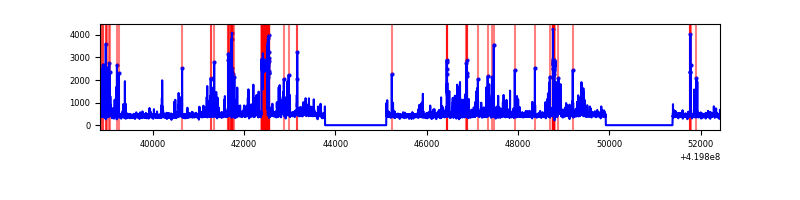 |
| C | 13579 | 10775 | 15 | 15 | 0.11% | 0.14% | 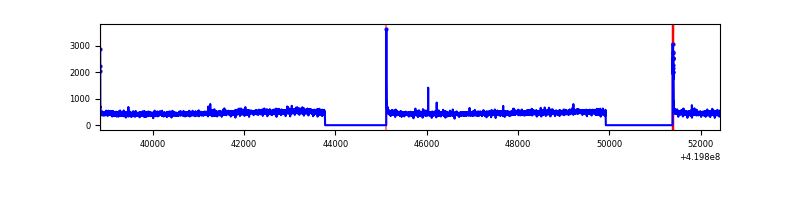 |
| D | 13579 | 10775 | 143 | 143 | 1.05% | 1.33% | 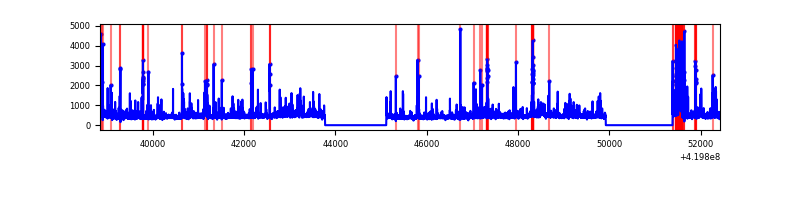 |
Top three noisy pixels from each quadrant. If the there are fewer than three noisy pixels in the level2.evt file, extra rows are filled as -1
| Pixel properties | Quadrant properties | ||||||
|---|---|---|---|---|---|---|---|
| Quadrant | DetID | PixID | Counts | Sigma | Mean | Median | Sigma |
| A | 10 | 83 | 967200 | 4063.29 | 1166 | 1139 | 237.8 |
| A | 12 | 189 | 56896 | 234.52 | 1166 | 1139 | 237.8 |
| A | 6 | 10 | 29637 | 119.86 | 1166 | 1139 | 237.8 |
| B | 5 | 32 | 636392 | 2894.39 | 1146 | 1115 | 219.5 |
| B | 4 | 171 | 319831 | 1452.11 | 1146 | 1115 | 219.5 |
| B | 0 | 190 | 183009 | 828.73 | 1146 | 1115 | 219.5 |
| C | 15 | 214 | 457696 | 1728.17 | 1136 | 1142 | 264.2 |
| C | 0 | 10 | 73556 | 274.11 | 1136 | 1142 | 264.2 |
| C | 10 | 70 | 17955 | 63.64 | 1136 | 1142 | 264.2 |
| D | 12 | 128 | 312274 | 1133.03 | 1130 | 1101 | 274.6 |
| D | 12 | 79 | 228064 | 826.41 | 1130 | 1101 | 274.6 |
| D | 12 | 233 | 175518 | 635.08 | 1130 | 1101 | 274.6 |
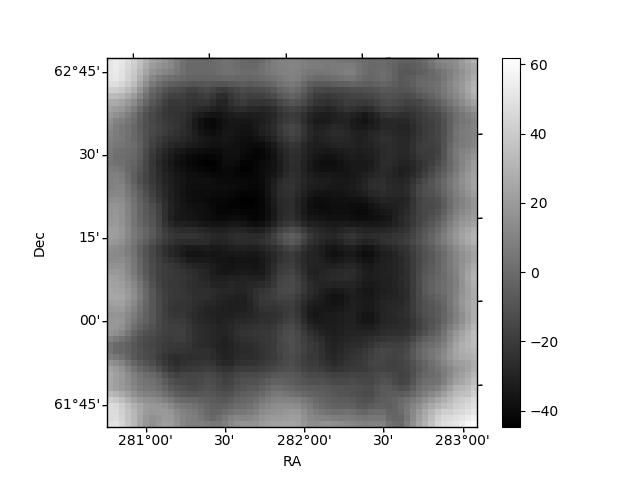
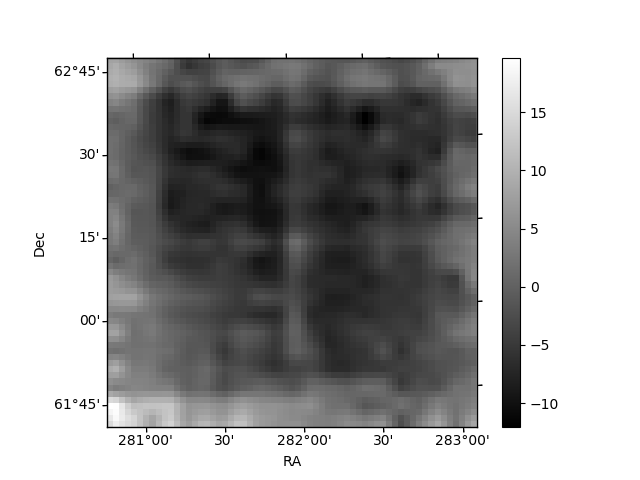
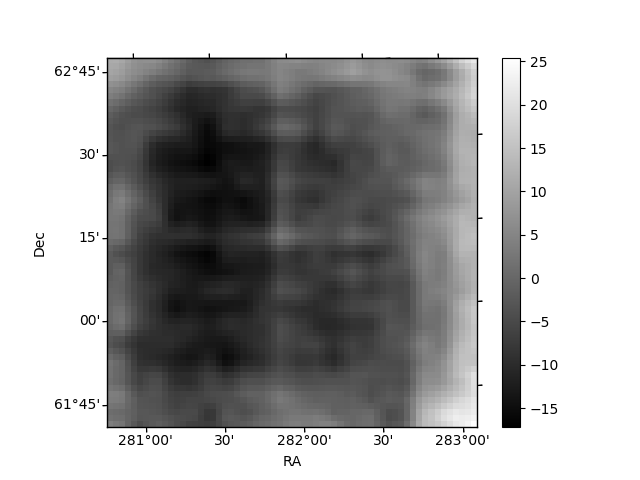
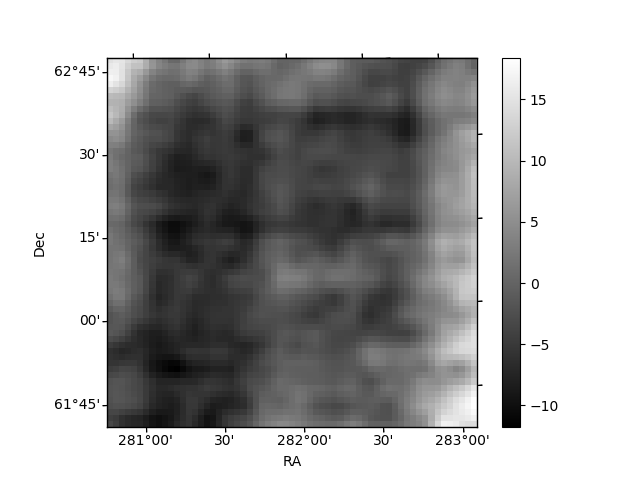
Histogram calculated using DETX and DETY for each event in the final _common_clean file
| Quadrant A | 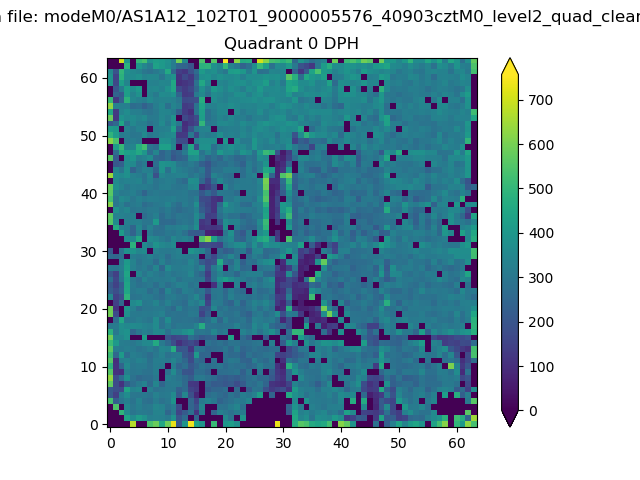 |
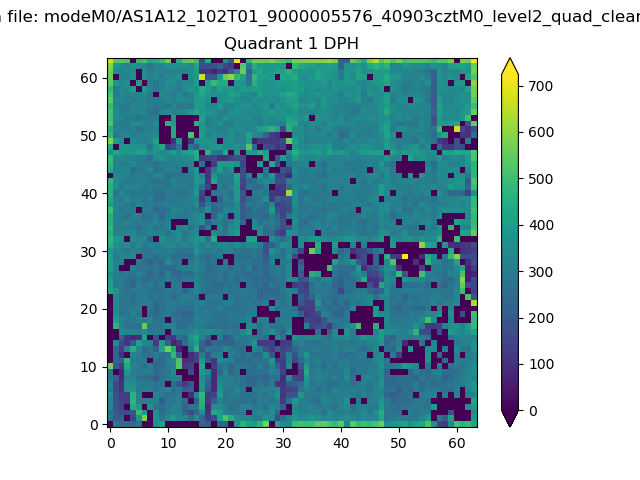 |
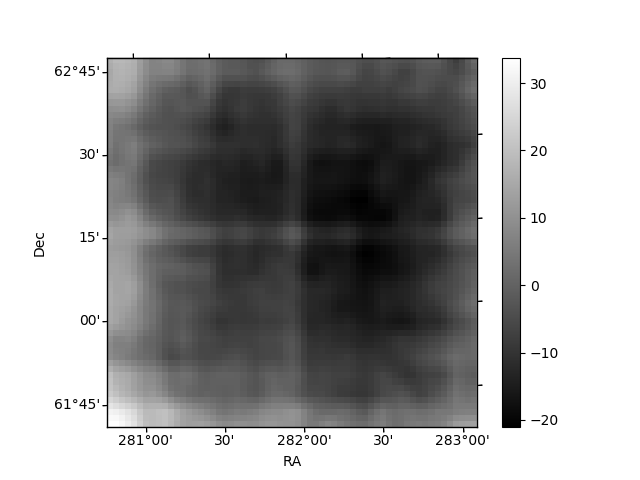
Quadrant B |
|---|---|---|---|
| Quadrant D | 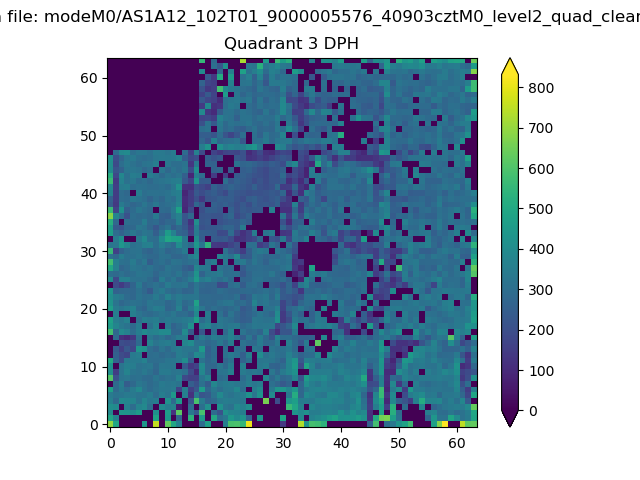 |
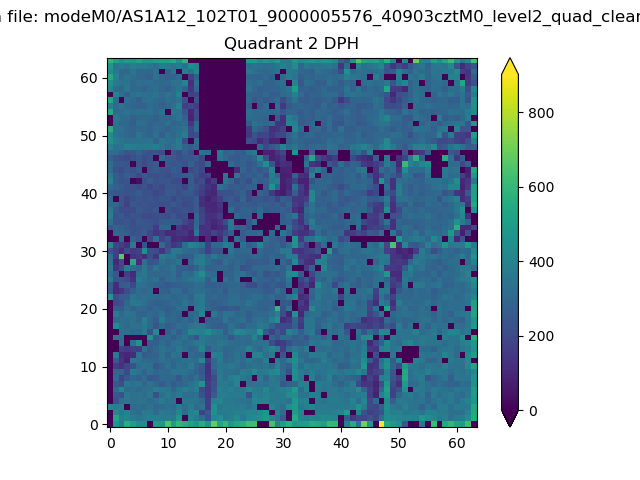 |
Quadrant C |
| Plot type | Count rate plots | Images |
|---|---|---|
| Comparison with Poisson distribution Blue bars denote a histogram of data divided into 1 sec bins. Red curve is a Poisson curve with rate = median count rate of data. |
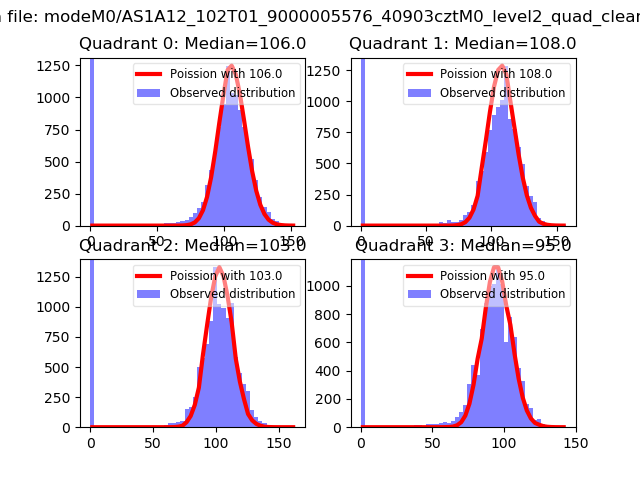 |
 |
| Quadrant-wise count rates Data is divided into 100 sec bins |
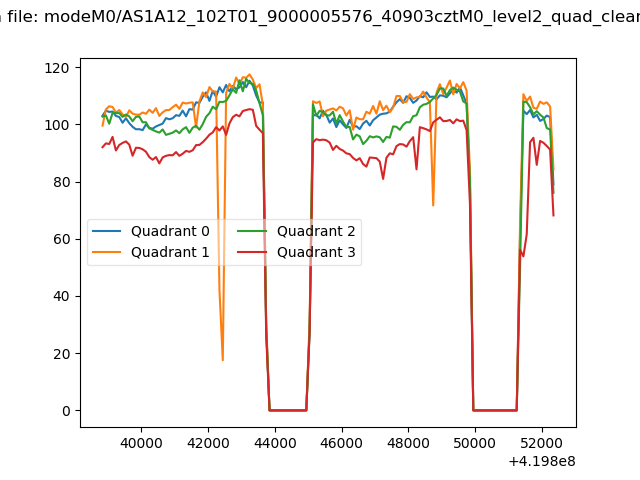 |
|
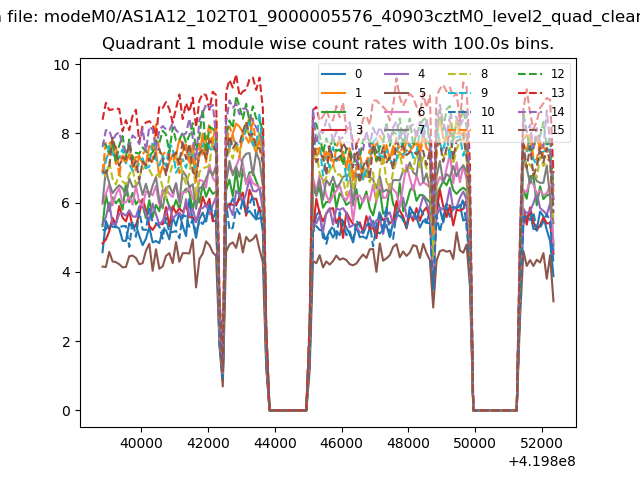
| Module-wise count rates for Quadrant A Data is divided into 100 sec bins |
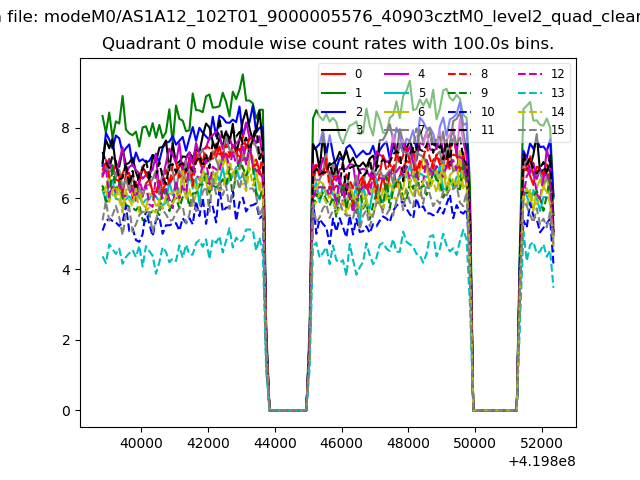 |
 |
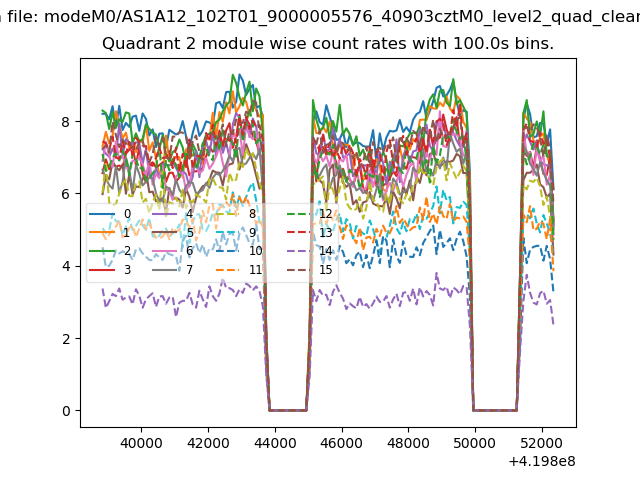
| Module-wise count rates for Quadrant B Data is divided into 100 sec bins |
 |
 |
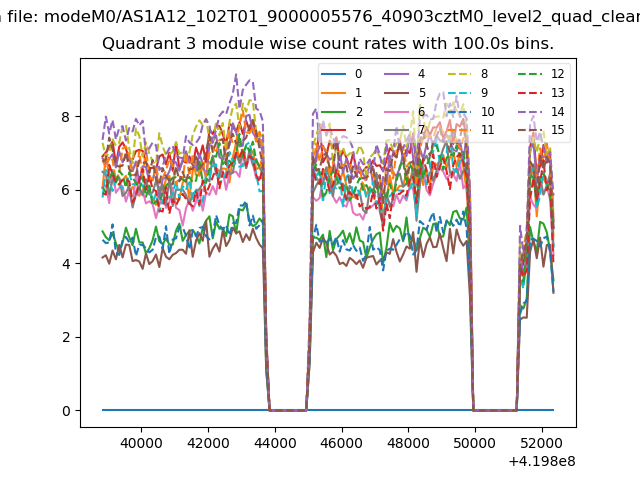
| Module-wise count rates for Quadrant C Data is divided into 100 sec bins |
 |
 |
| Module-wise count rates for Quadrant D Data is divided into 100 sec bins |
 |
 |
| Parameter | Plot |
|---|---|
| CZT HV Monitor | 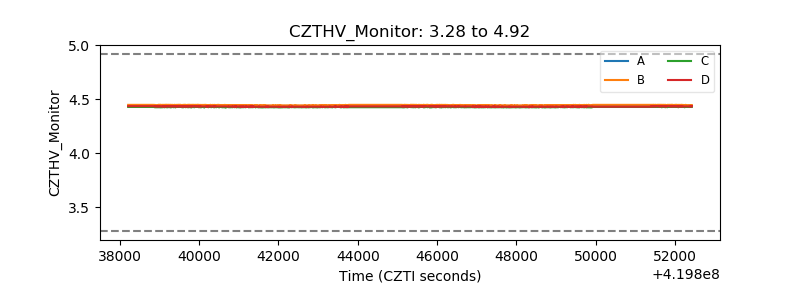 |
| D_VDD | 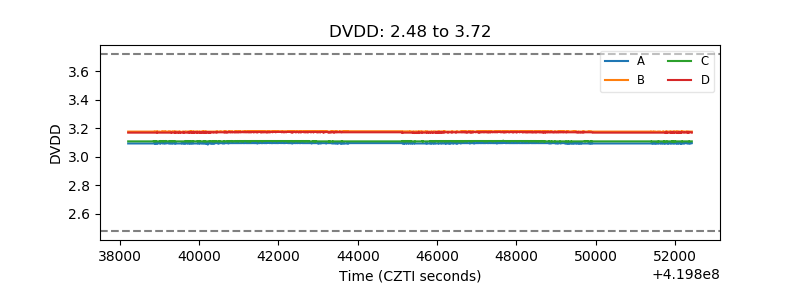 |
| Temperature 1 | 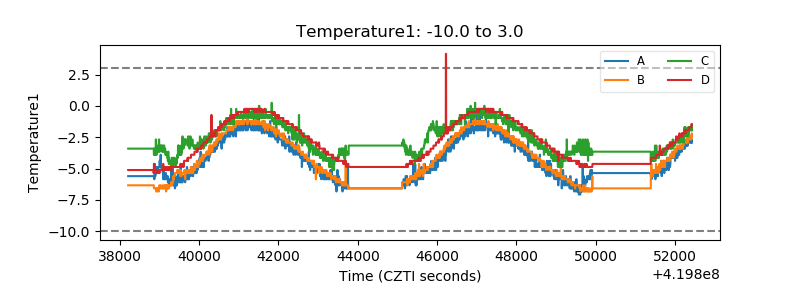 |
| Veto HV Monitor | 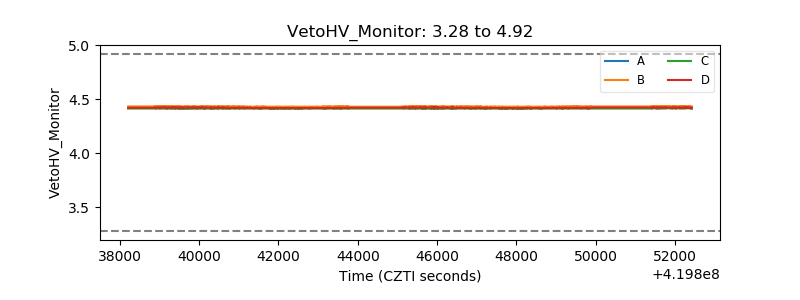 |
| Veto LLD | 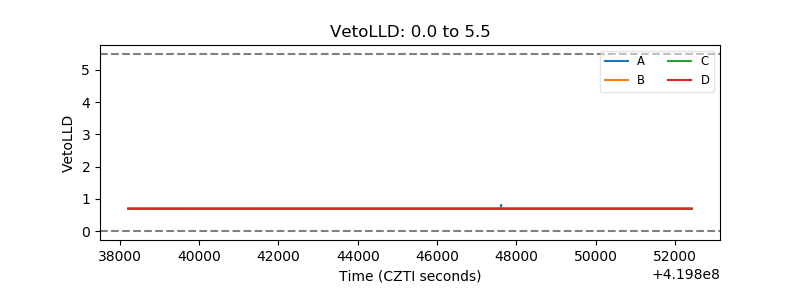 |
| Alpha Counter | 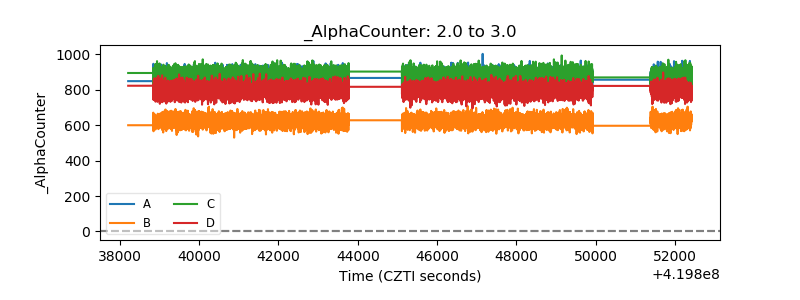 |
| _CPM_Rate | 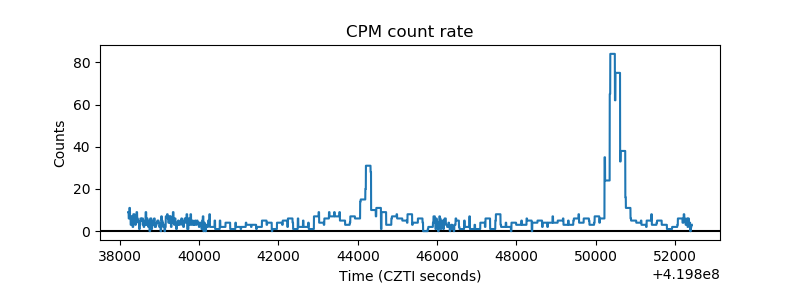 |
| CZT Counter | 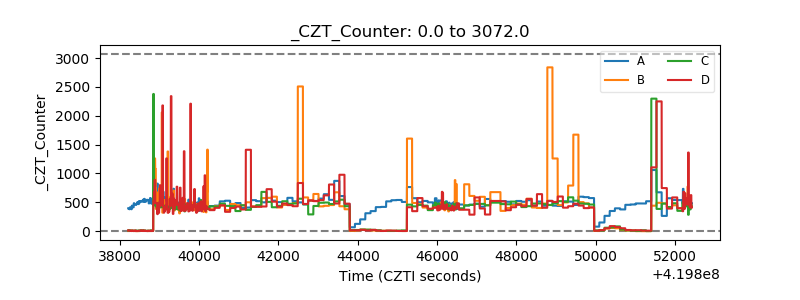 |
| +2.5 Volts monitor | 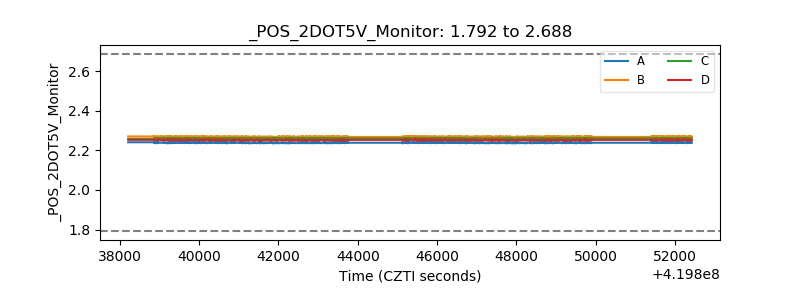 |
| +5 Volts monitor | 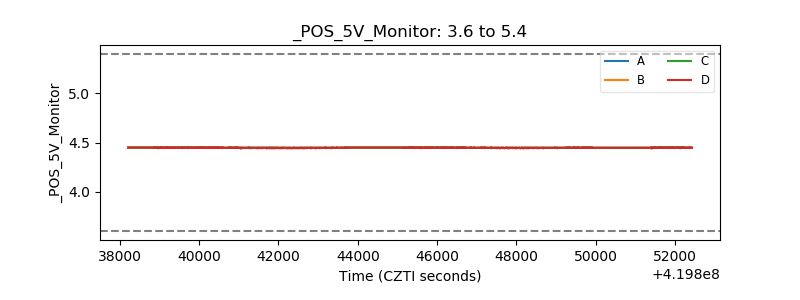 |
| _ROLL_ROT | 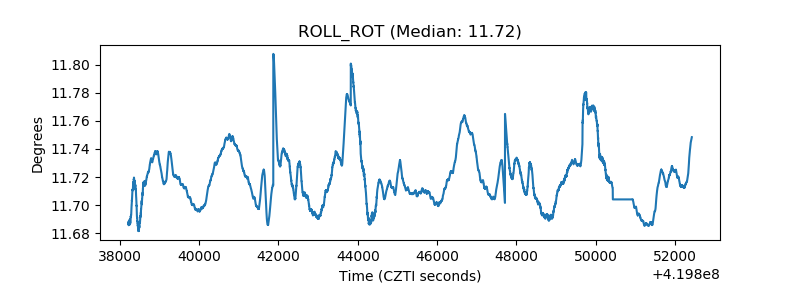 |
| _Roll_DEC | 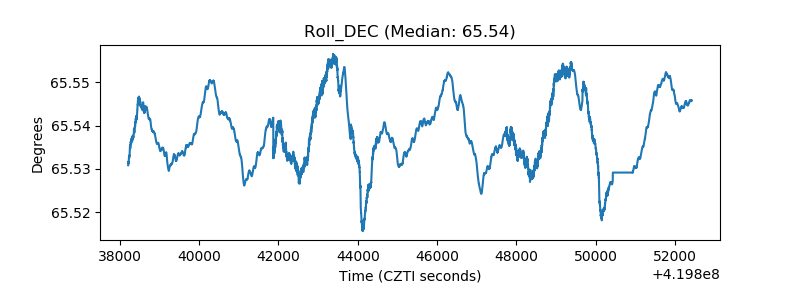 |
| _Roll_RA | 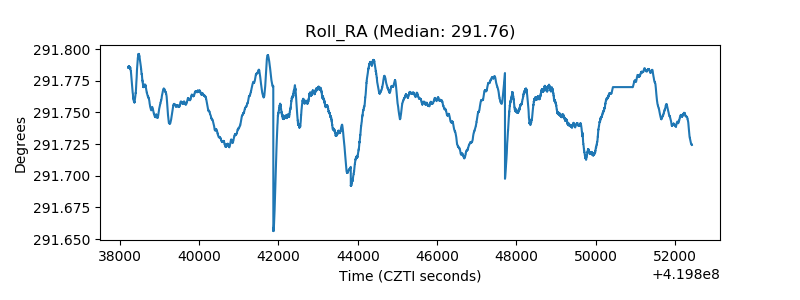 |
| Veto Counter | 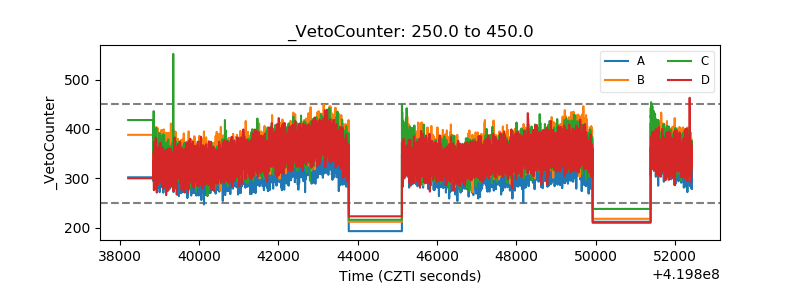 |