| Param | Original file | Final file |
|---|---|---|
| Filename | modeM0/AS1A12_102T01_9000005576_40904cztM0_level2.fits | modeM0/AS1A12_102T01_9000005576_40904cztM0_level2_quad_clean.evt |
| Size (bytes) | 332,533,440 | 89,084,160 |
| Size | 317.1 MB | 85.0 MB |
| Events in quadrant A | 2,876,492 | 597,204 |
| Events in quadrant B | 2,990,838 | 608,479 |
| Events in quadrant C | 2,585,104 | 580,731 |
| Events in quadrant D | 3,421,655 | 520,666 |
| Mode SS | |||
|---|---|---|---|
| Quadrant | BADHDUFLAG | Total packets | Discarded packets |
| A | 0 | 112 | 0 |
| B | 0 | 112 | 0 |
| C | 0 | 112 | 0 |
| D | 0 | 112 | 0 |
| Mode M0 | |||
|---|---|---|---|
| Quadrant | BADHDUFLAG | Total packets | Discarded packets |
| A | 0 | 11807 | 2 |
| B | 0 | 12721 | 1 |
| C | 0 | 11292 | 1 |
| D | 0 | 14097 | 1 |
| Mode M9 | |||
|---|---|---|---|
| Quadrant | BADHDUFLAG | Total packets | Discarded packets |
| A | 0 | 16 | 0 |
| B | 0 | 16 | 0 |
| C | 0 | 16 | 0 |
| D | 0 | 16 | 0 |
| Quadrant | Total seconds | Saturated seconds | Saturation percentage |
|---|---|---|---|
| A | 5583 | 11 | 0.197027% |
| B | 5583 | 115 | 2.059824% |
| C | 5583 | 6 | 0.107469% |
| D | 5583 | 187 | 3.349454% |
Noise dominated data is calculated using 1-second bins in cleaned event files. If a bin has >2000 counts, and if more than 50% of those come from <1% of pixels, then it is considered to be noise-dominated and hence unusable.
| Quadrant | # 1 sec bins | Bins with >0 counts | Bins with >2000 counts | High rate bins dominated by noise | Noise dominated (total time) | Noise dominated (detector-on time) | Marked lightcurve |
|---|---|---|---|---|---|---|---|
| A | 7135 | 5584 | 1 | 1 | 0.01% | 0.02% | 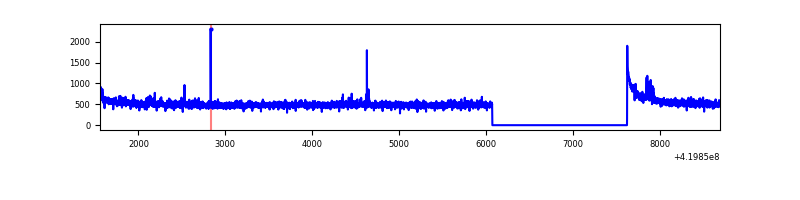 |
| B | 7135 | 5584 | 59 | 59 | 0.83% | 1.06% | 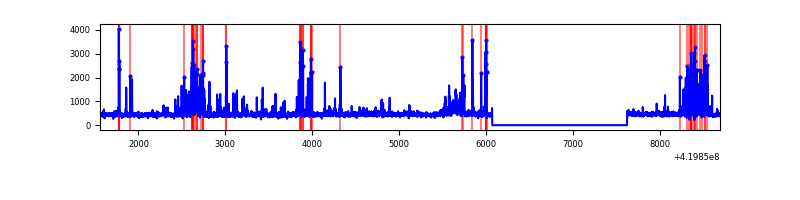 |
| C | 7135 | 5584 | 4 | 4 | 0.06% | 0.07% | 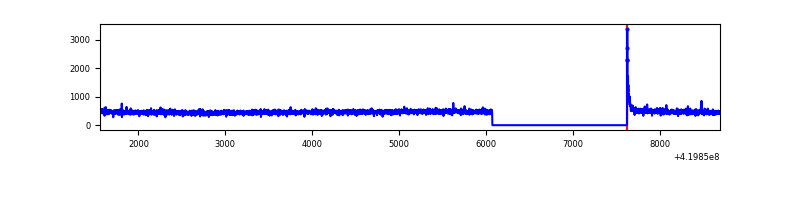 |
| D | 7135 | 5584 | 158 | 158 | 2.21% | 2.83% | 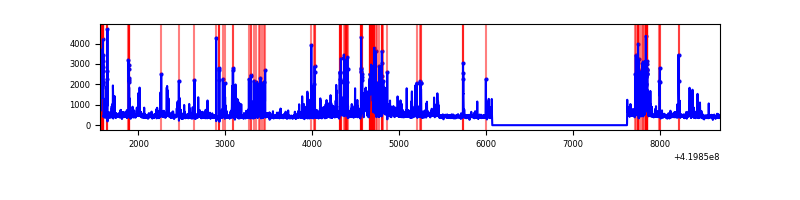 |
Top three noisy pixels from each quadrant. If the there are fewer than three noisy pixels in the level2.evt file, extra rows are filled as -1
| Pixel properties | Quadrant properties | ||||||
|---|---|---|---|---|---|---|---|
| Quadrant | DetID | PixID | Counts | Sigma | Mean | Median | Sigma |
| A | 10 | 83 | 478909 | 3803.0 | 608 | 594 | 125.8 |
| A | 13 | 248 | 18310 | 140.86 | 608 | 594 | 125.8 |
| A | 12 | 189 | 16205 | 124.12 | 608 | 594 | 125.8 |
| B | 4 | 171 | 424889 | 3644.85 | 599 | 582 | 116.4 |
| B | 0 | 190 | 77847 | 663.72 | 599 | 582 | 116.4 |
| B | 15 | 85 | 69748 | 594.15 | 599 | 582 | 116.4 |
| C | 15 | 214 | 234159 | 1694.93 | 589 | 591 | 137.8 |
| C | 0 | 10 | 33611 | 239.62 | 589 | 591 | 137.8 |
| C | 10 | 70 | 9637 | 65.64 | 589 | 591 | 137.8 |
| D | 12 | 128 | 502250 | 3485.75 | 583 | 565 | 143.9 |
| D | 2 | 249 | 170822 | 1182.96 | 583 | 565 | 143.9 |
| D | 13 | 249 | 139739 | 966.99 | 583 | 565 | 143.9 |
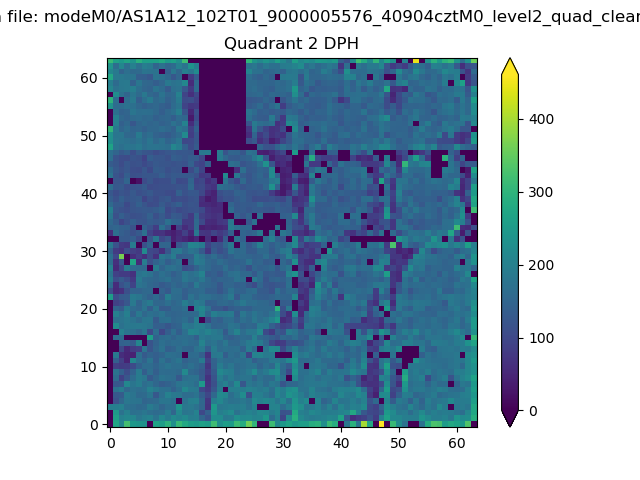
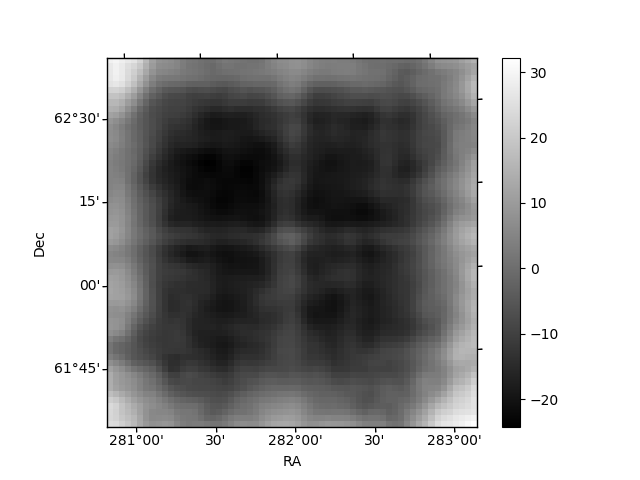
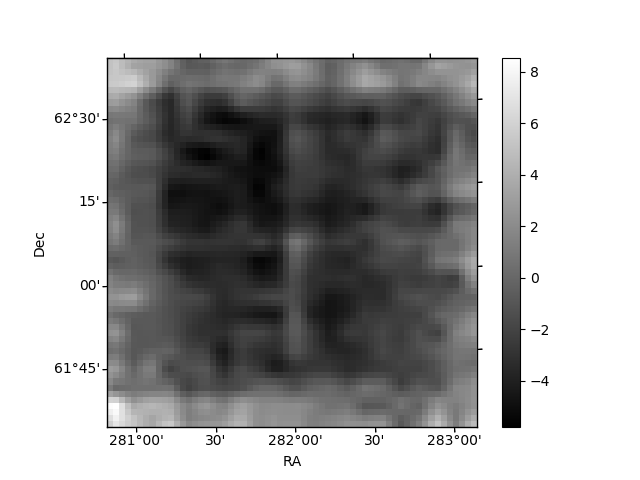
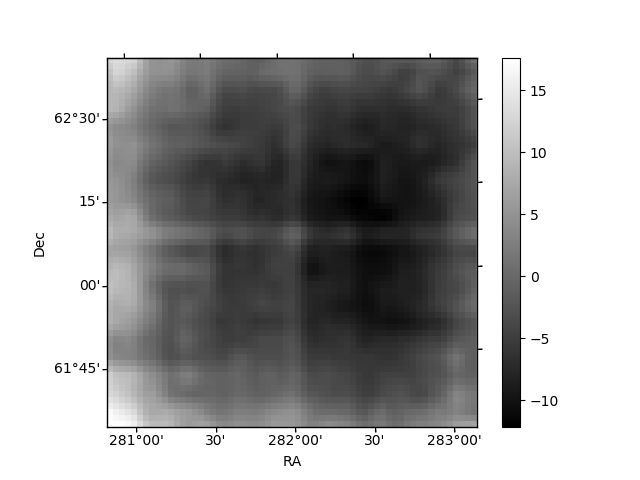
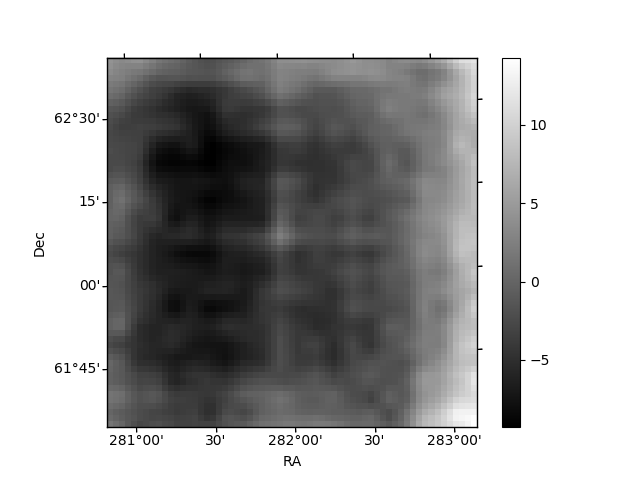
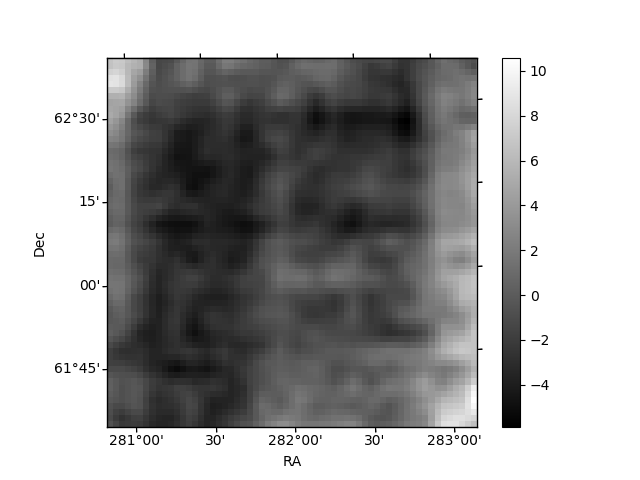
Histogram calculated using DETX and DETY for each event in the final _common_clean file
| Quadrant A | 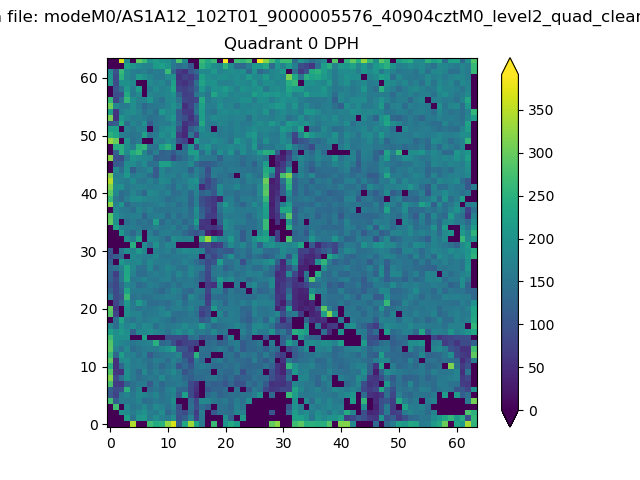 |
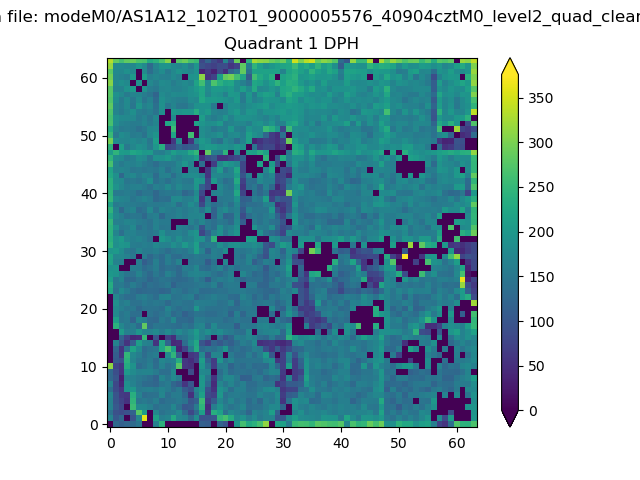 |
Quadrant B |
|---|---|---|---|
| Quadrant D | 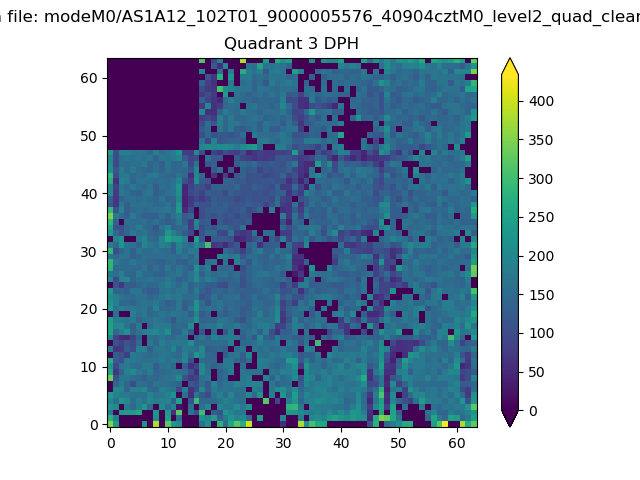 |
 |
Quadrant C |
| Plot type | Count rate plots | Images |
|---|---|---|
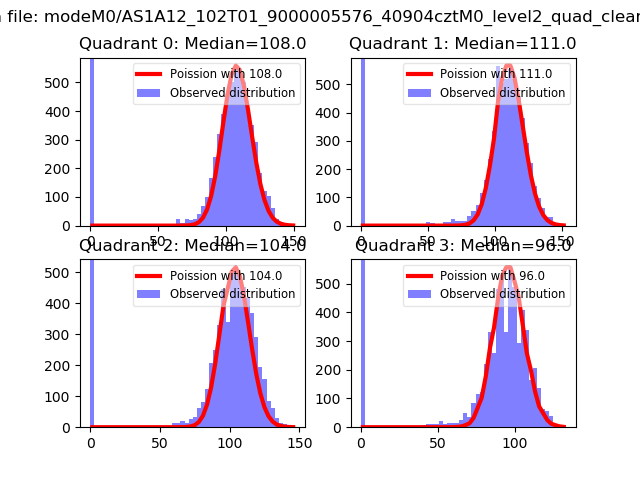
| Comparison with Poisson distribution Blue bars denote a histogram of data divided into 1 sec bins. Red curve is a Poisson curve with rate = median count rate of data. |
 |
 |
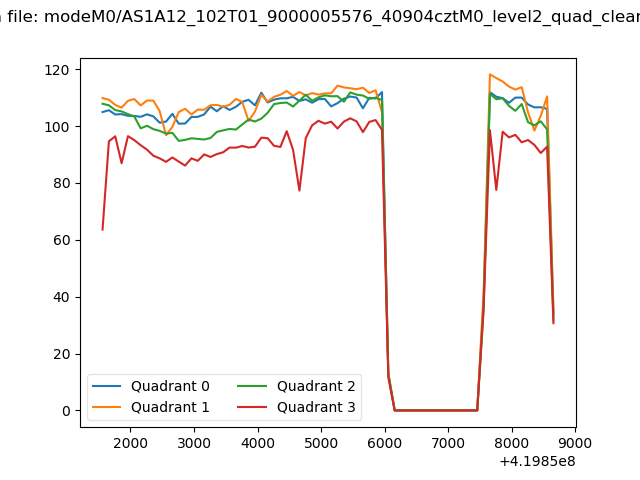
| Quadrant-wise count rates Data is divided into 100 sec bins |
 |
|
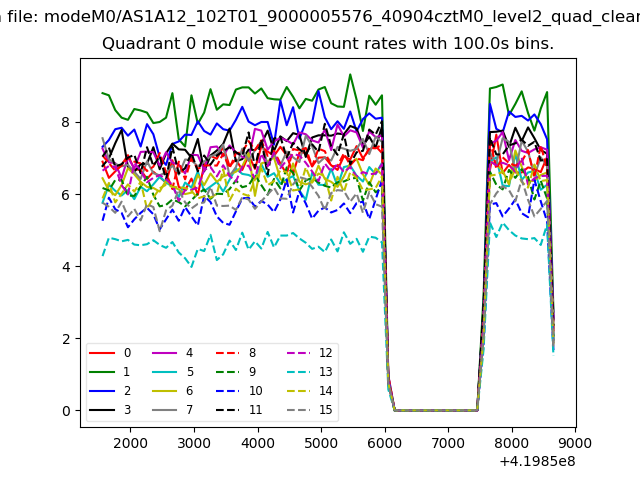
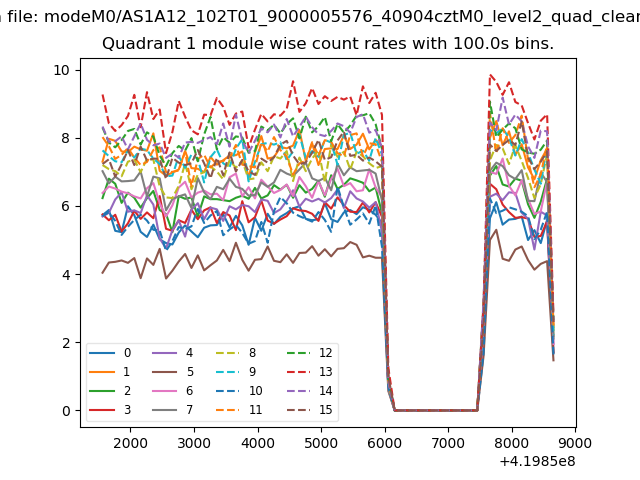
| Module-wise count rates for Quadrant A Data is divided into 100 sec bins |
 |
 |
| Module-wise count rates for Quadrant B Data is divided into 100 sec bins |
 |
 |
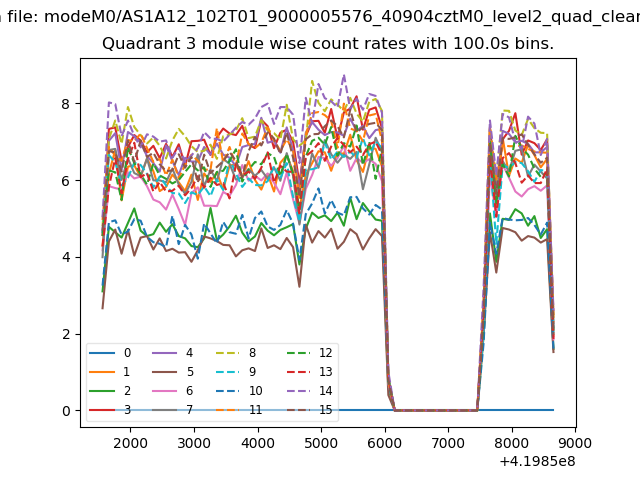
| Module-wise count rates for Quadrant C Data is divided into 100 sec bins |
 |
 |
| Module-wise count rates for Quadrant D Data is divided into 100 sec bins |
 |
 |
| Parameter | Plot |
|---|---|
| CZT HV Monitor | 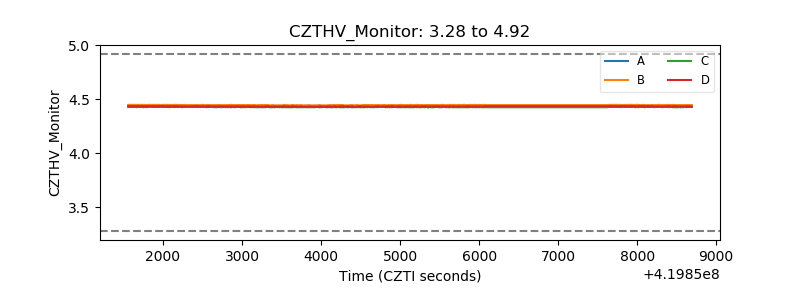 |
| D_VDD | 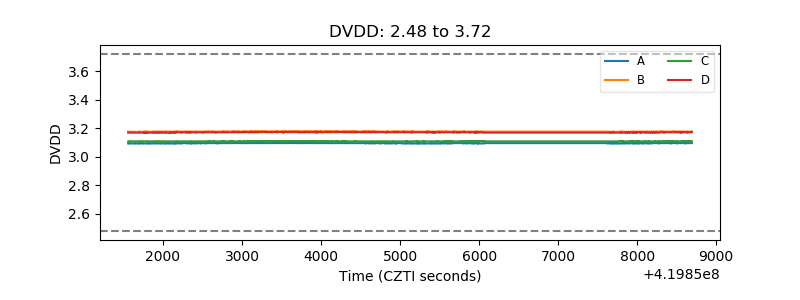 |
| Temperature 1 | 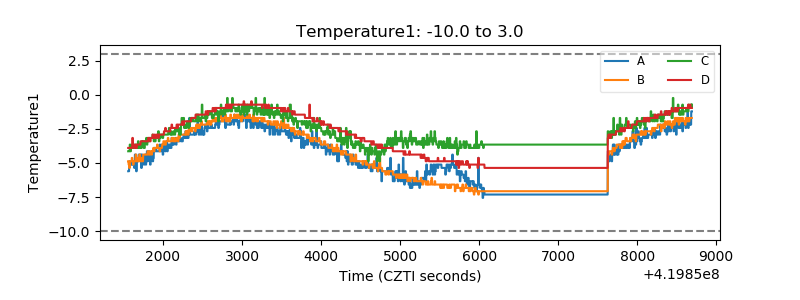 |
| Veto HV Monitor |  |
| Veto LLD | 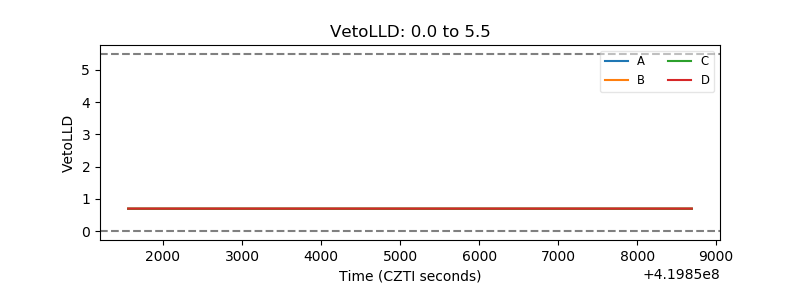 |
| Alpha Counter | 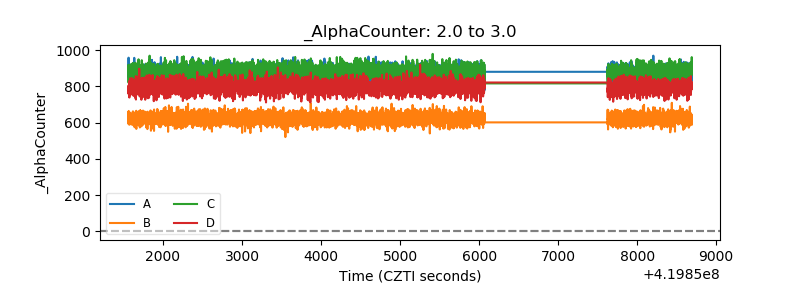 |
| _CPM_Rate | 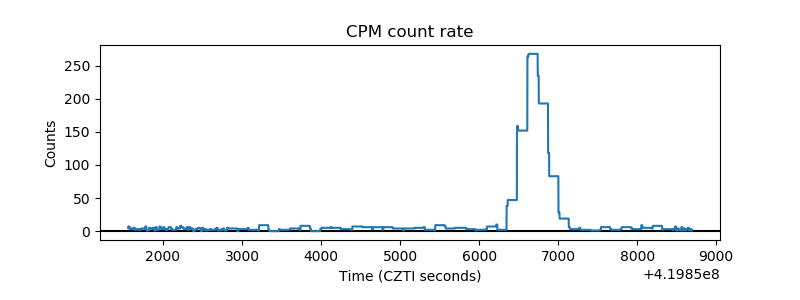 |
| CZT Counter | 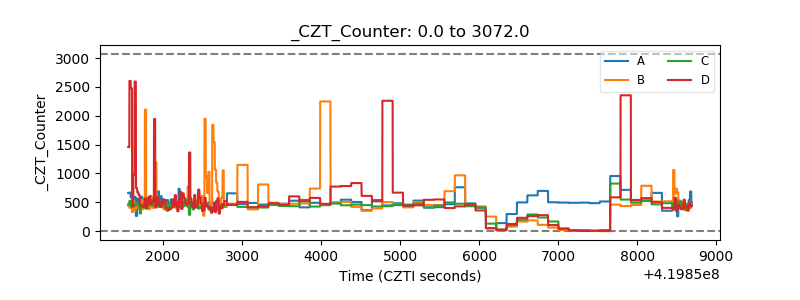 |
| +2.5 Volts monitor | 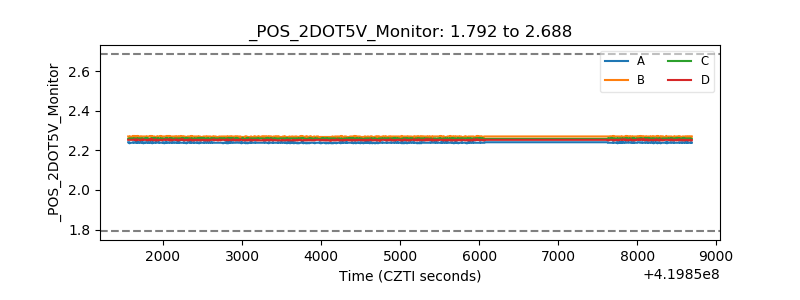 |
| +5 Volts monitor | 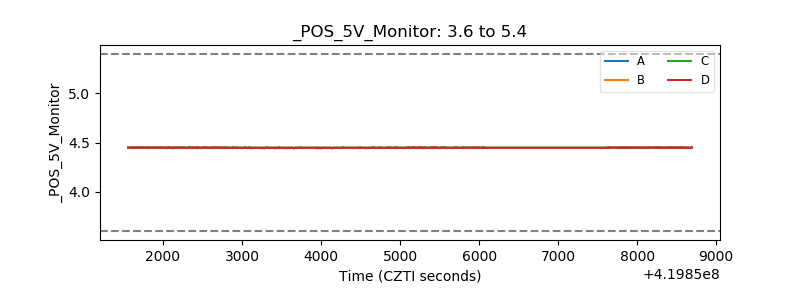 |
| _ROLL_ROT | 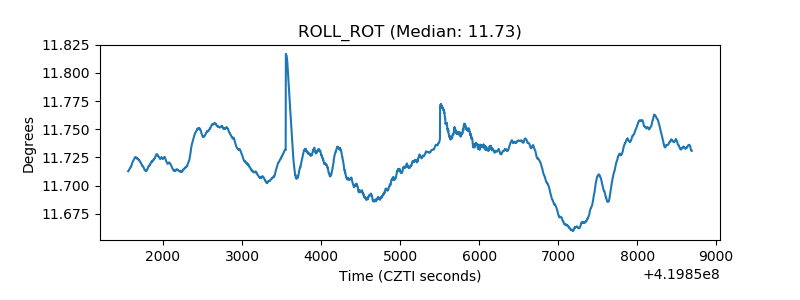 |
| _Roll_DEC | 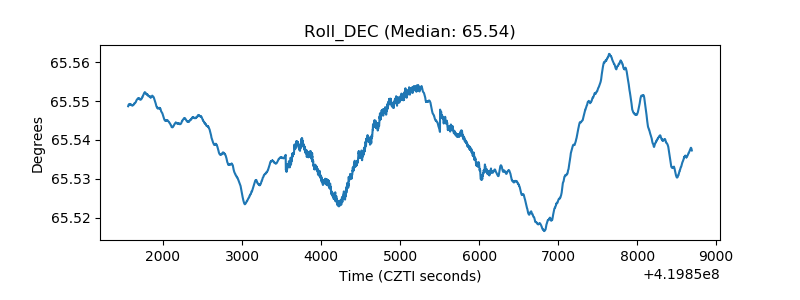 |
| _Roll_RA | 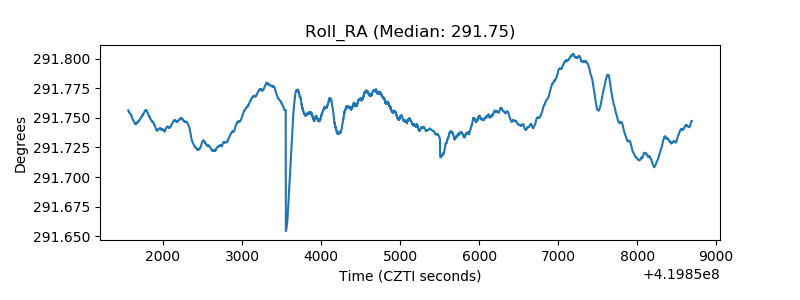 |
| Veto Counter | 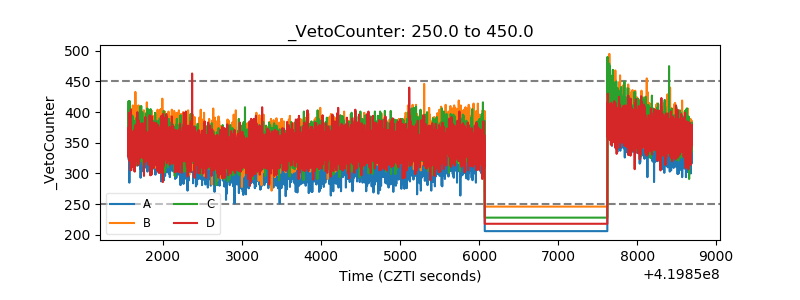 |