| Param | Original file | Final file |
|---|---|---|
| Filename | modeM0/AS1A12_102T01_9000005576_40905cztM0_level2.fits | modeM0/AS1A12_102T01_9000005576_40905cztM0_level2_quad_clean.evt |
| Size (bytes) | 339,287,040 | 92,724,480 |
| Size | 323.6 MB | 88.4 MB |
| Events in quadrant A | 3,022,824 | 625,813 |
| Events in quadrant B | 2,966,411 | 633,060 |
| Events in quadrant C | 2,767,188 | 600,861 |
| Events in quadrant D | 3,359,873 | 550,037 |
| Mode SS | |||
|---|---|---|---|
| Quadrant | BADHDUFLAG | Total packets | Discarded packets |
| A | 0 | 116 | 0 |
| B | 0 | 116 | 0 |
| C | 0 | 116 | 0 |
| D | 0 | 116 | 0 |
| Mode M0 | |||
|---|---|---|---|
| Quadrant | BADHDUFLAG | Total packets | Discarded packets |
| A | 0 | 12448 | 3 |
| B | 0 | 12820 | 2 |
| C | 0 | 11915 | 2 |
| D | 0 | 13924 | 2 |
| Mode M9 | |||
|---|---|---|---|
| Quadrant | BADHDUFLAG | Total packets | Discarded packets |
| A | 0 | 19 | 0 |
| B | 0 | 19 | 0 |
| C | 0 | 19 | 0 |
| D | 0 | 20 | 0 |
| Quadrant | Total seconds | Saturated seconds | Saturation percentage |
|---|---|---|---|
| A | 5689 | 14 | 0.246089% |
| B | 5689 | 106 | 1.863245% |
| C | 5689 | 13 | 0.228511% |
| D | 5689 | 95 | 1.669889% |
Noise dominated data is calculated using 1-second bins in cleaned event files. If a bin has >2000 counts, and if more than 50% of those come from <1% of pixels, then it is considered to be noise-dominated and hence unusable.
| Quadrant | # 1 sec bins | Bins with >0 counts | Bins with >2000 counts | High rate bins dominated by noise | Noise dominated (total time) | Noise dominated (detector-on time) | Marked lightcurve |
|---|---|---|---|---|---|---|---|
| A | 7361 | 5690 | 2 | 2 | 0.03% | 0.04% | 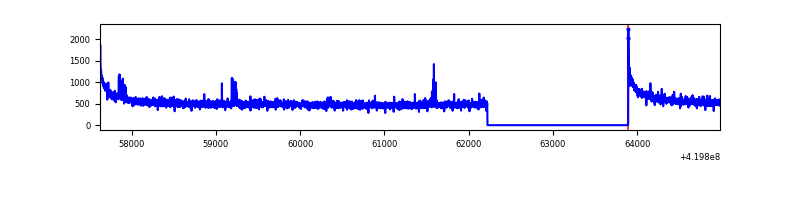 |
| B | 7361 | 5690 | 50 | 50 | 0.68% | 0.88% | 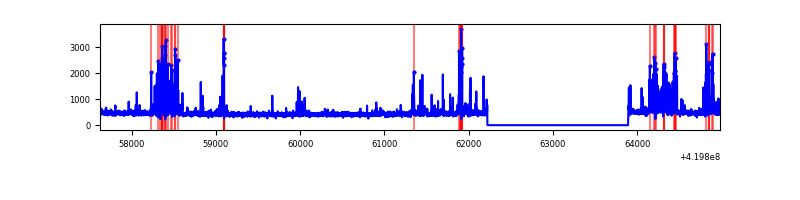 |
| C | 7361 | 5690 | 10 | 10 | 0.14% | 0.18% | 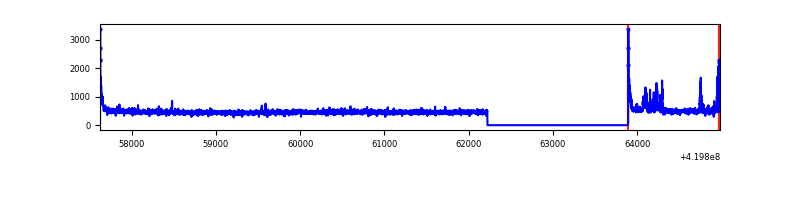 |
| D | 7361 | 5690 | 77 | 77 | 1.05% | 1.35% | 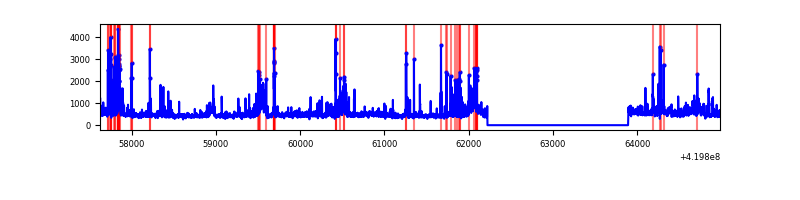 |
Top three noisy pixels from each quadrant. If the there are fewer than three noisy pixels in the level2.evt file, extra rows are filled as -1
| Pixel properties | Quadrant properties | ||||||
|---|---|---|---|---|---|---|---|
| Quadrant | DetID | PixID | Counts | Sigma | Mean | Median | Sigma |
| A | 10 | 83 | 558335 | 4318.35 | 625 | 612 | 129.2 |
| A | 13 | 248 | 24955 | 188.48 | 625 | 612 | 129.2 |
| A | 7 | 3 | 11646 | 85.43 | 625 | 612 | 129.2 |
| B | 4 | 171 | 319805 | 2632.06 | 617 | 598 | 121.3 |
| B | 5 | 255 | 116822 | 958.34 | 617 | 598 | 121.3 |
| B | 15 | 85 | 48842 | 397.8 | 617 | 598 | 121.3 |
| C | 15 | 214 | 240953 | 1691.65 | 608 | 609 | 142.1 |
| C | 14 | 254 | 84027 | 587.13 | 608 | 609 | 142.1 |
| C | 0 | 10 | 64171 | 447.38 | 608 | 609 | 142.1 |
| D | 12 | 79 | 216089 | 1468.72 | 603 | 587 | 146.7 |
| D | 12 | 128 | 121719 | 825.56 | 603 | 587 | 146.7 |
| D | 2 | 249 | 119294 | 809.03 | 603 | 587 | 146.7 |
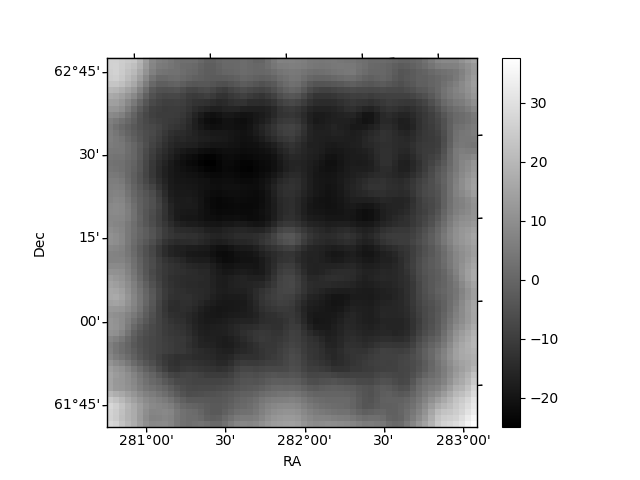
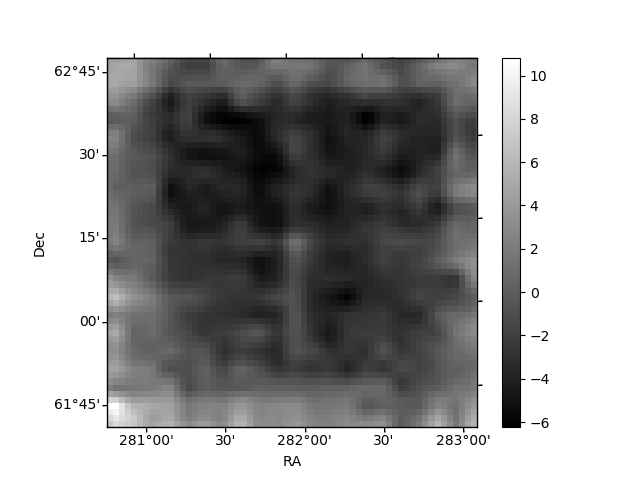
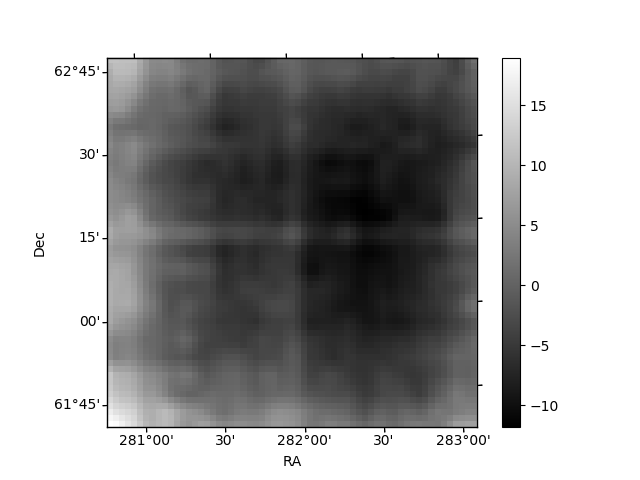
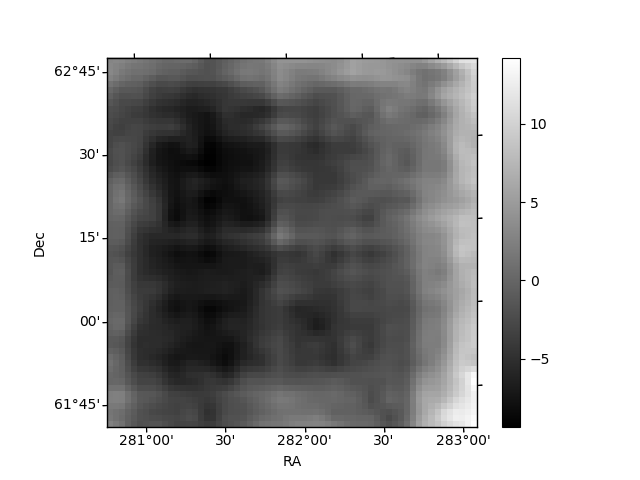
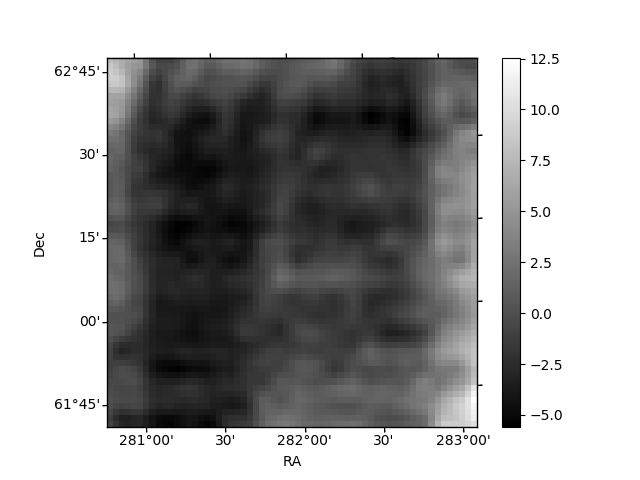
Histogram calculated using DETX and DETY for each event in the final _common_clean file
| Quadrant A | 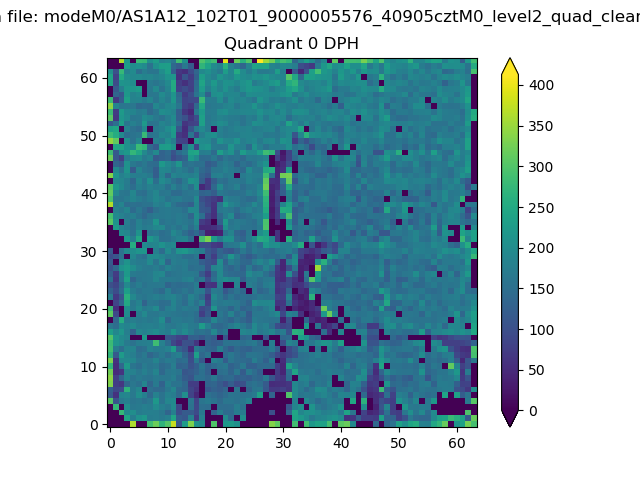 |
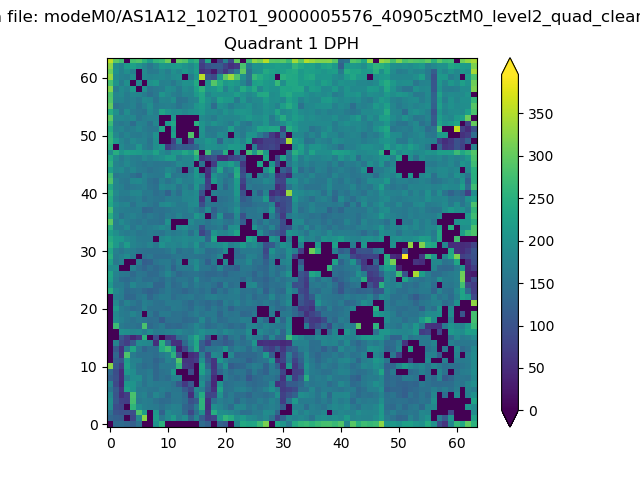 |
Quadrant B |
|---|---|---|---|
| Quadrant D | 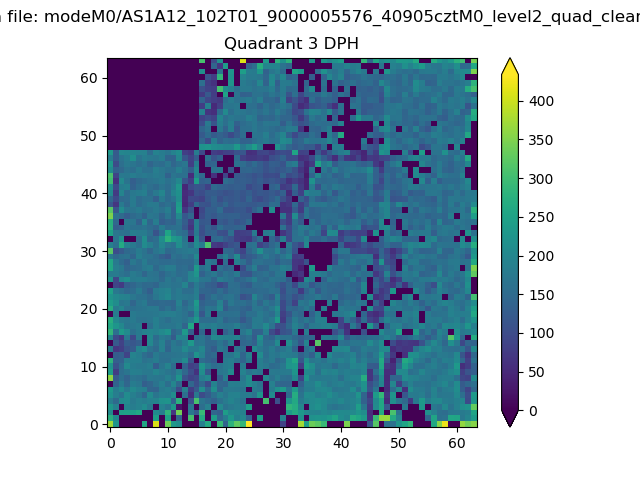 |
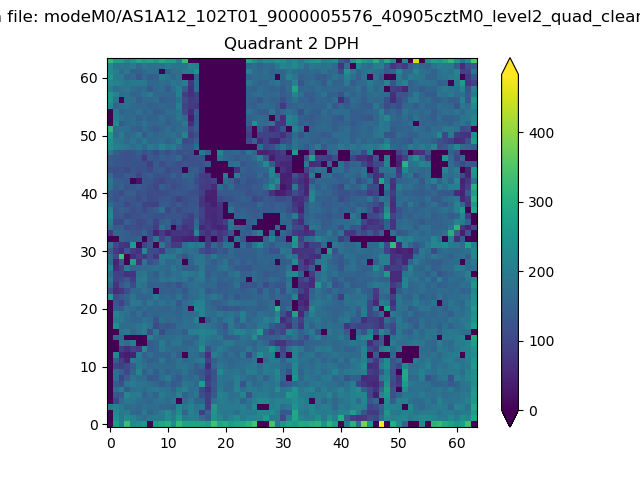 |
Quadrant C |
| Plot type | Count rate plots | Images |
|---|---|---|
| Comparison with Poisson distribution Blue bars denote a histogram of data divided into 1 sec bins. Red curve is a Poisson curve with rate = median count rate of data. |
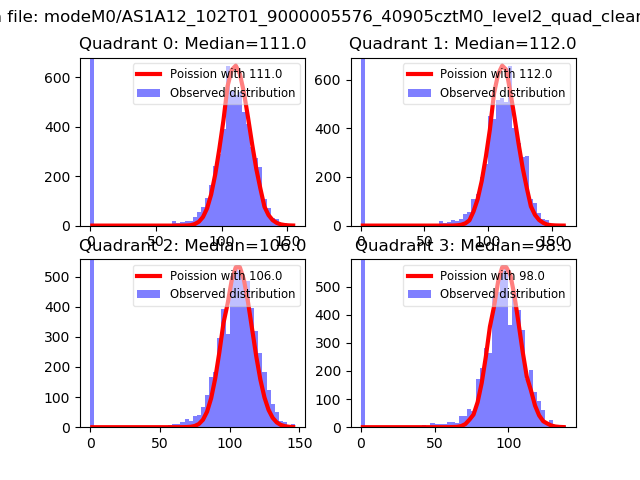 |
 |
| Quadrant-wise count rates Data is divided into 100 sec bins |
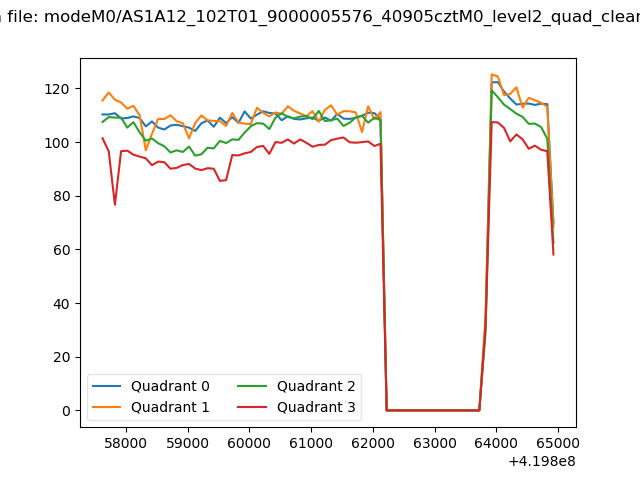 |
|
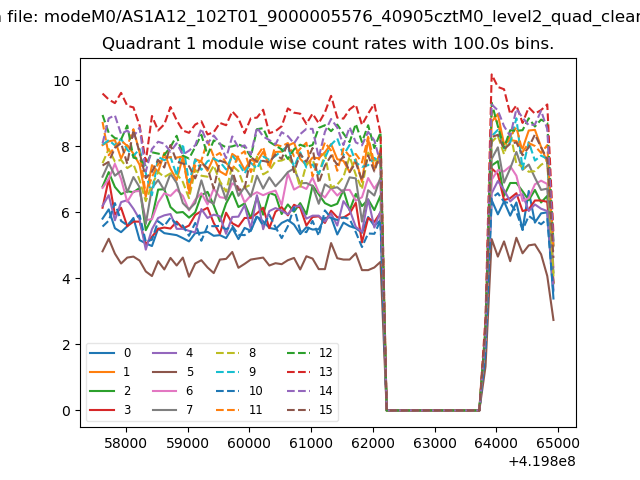
| Module-wise count rates for Quadrant A Data is divided into 100 sec bins |
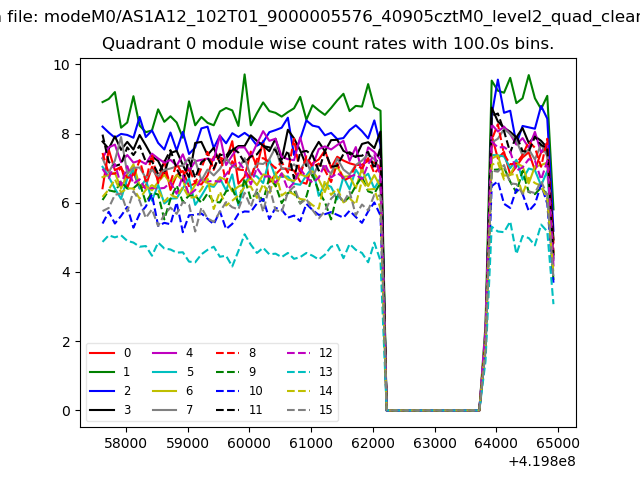 |
 |
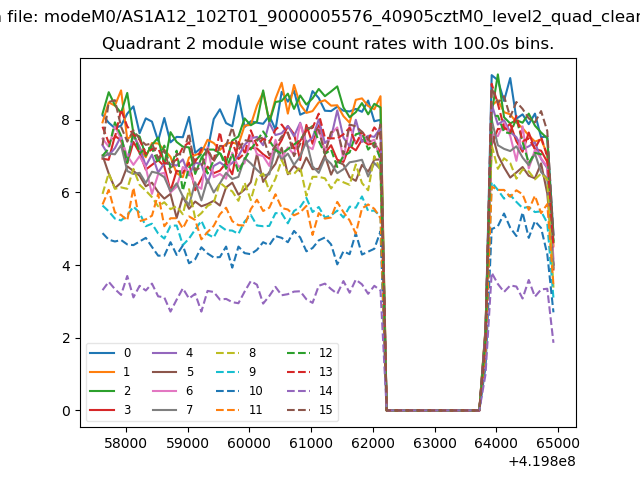
| Module-wise count rates for Quadrant B Data is divided into 100 sec bins |
 |
 |
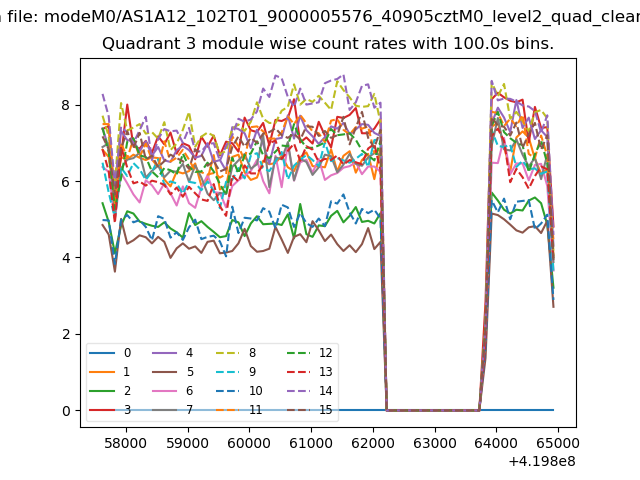
| Module-wise count rates for Quadrant C Data is divided into 100 sec bins |
 |
 |
| Module-wise count rates for Quadrant D Data is divided into 100 sec bins |
 |
 |
| Parameter | Plot |
|---|---|
| CZT HV Monitor | 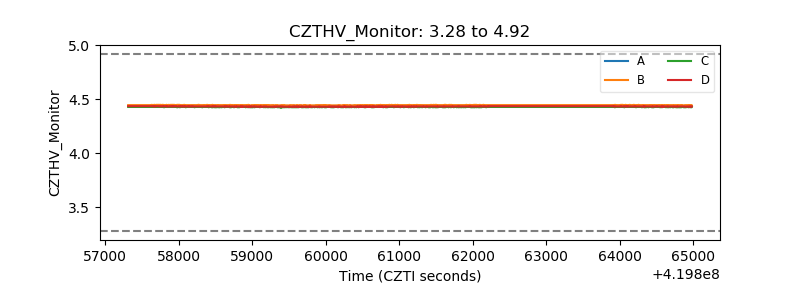 |
| D_VDD | 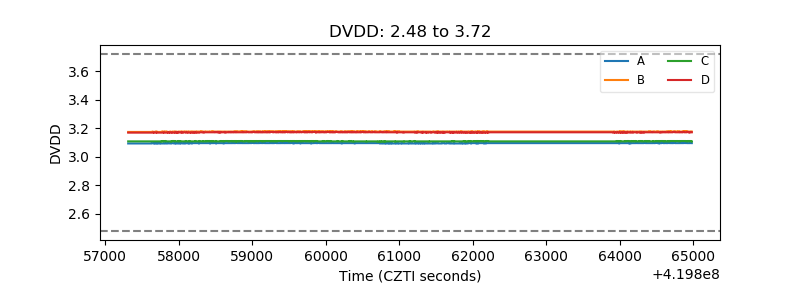 |
| Temperature 1 | 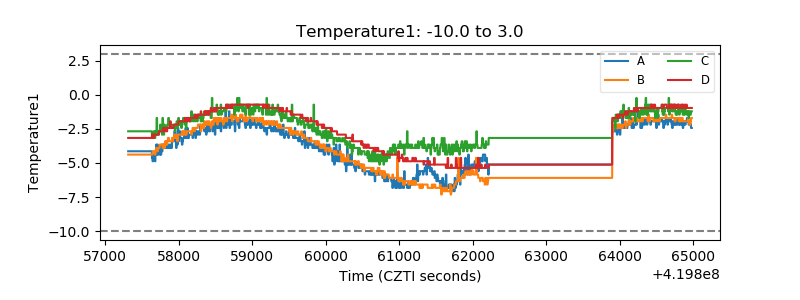 |
| Veto HV Monitor | 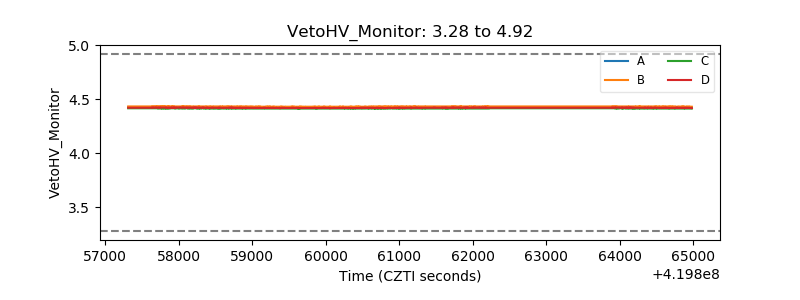 |
| Veto LLD | 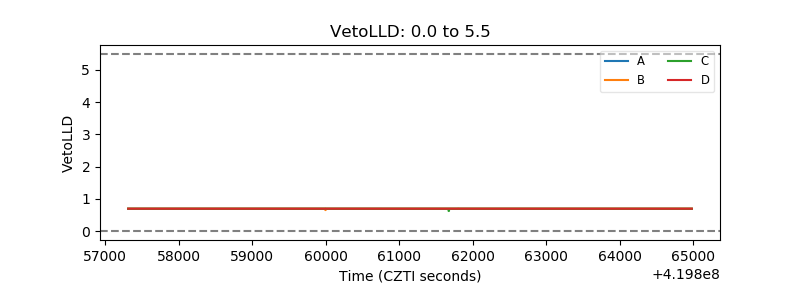 |
| Alpha Counter | 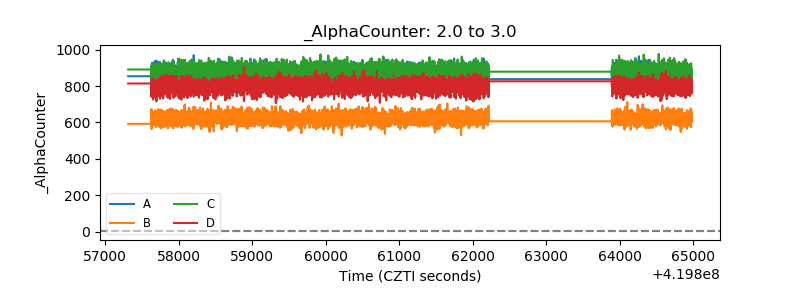 |
| _CPM_Rate | 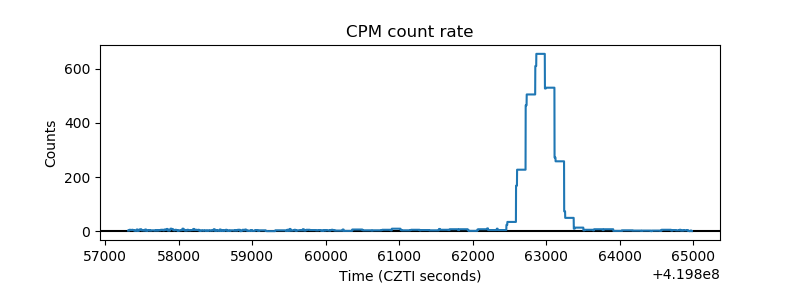 |
| CZT Counter | 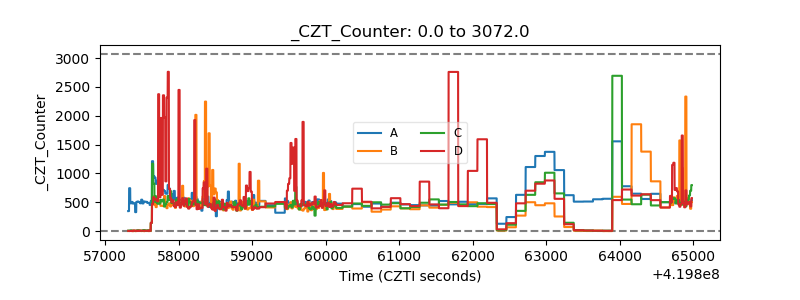 |
| +2.5 Volts monitor | 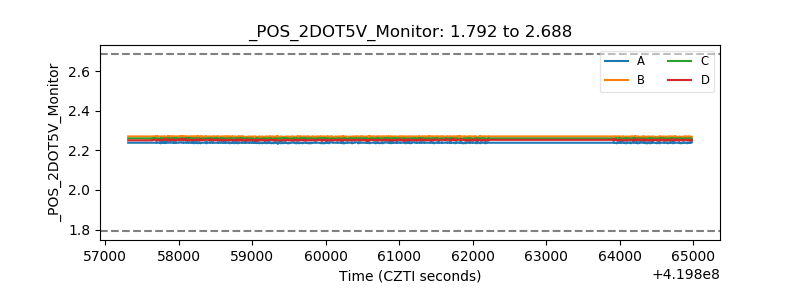 |
| +5 Volts monitor | 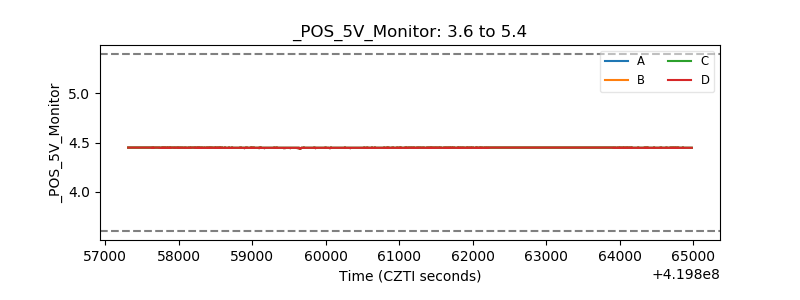 |
| _ROLL_ROT | 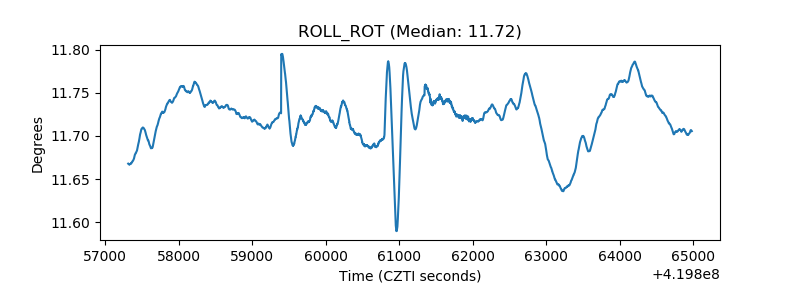 |
| _Roll_DEC | 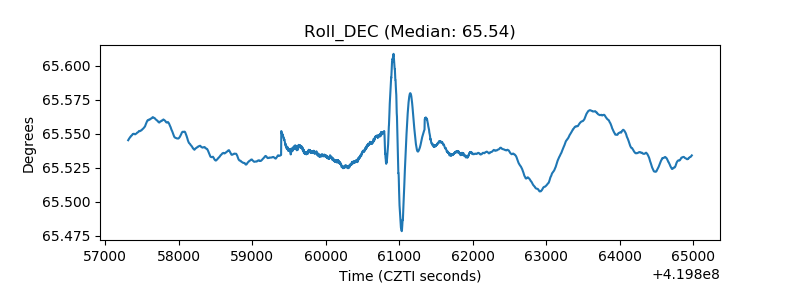 |
| _Roll_RA | 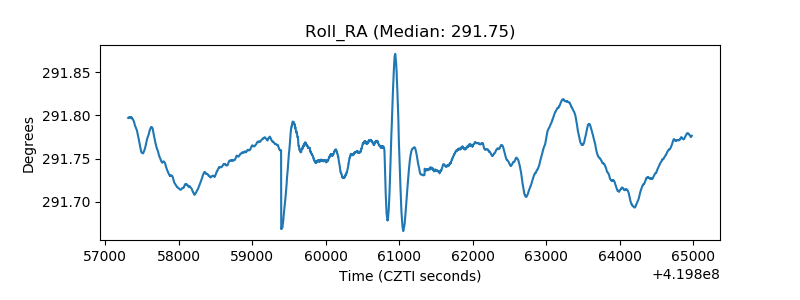 |
| Veto Counter | 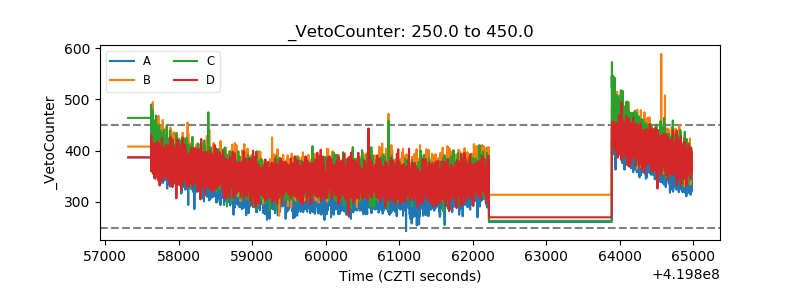 |