| Param | Original file | Final file |
|---|---|---|
| Filename | modeM0/AS1A12_102T01_9000005576_40907cztM0_level2.fits | modeM0/AS1A12_102T01_9000005576_40907cztM0_level2_quad_clean.evt |
| Size (bytes) | 344,594,880 | 92,730,240 |
| Size | 328.6 MB | 88.4 MB |
| Events in quadrant A | 2,949,066 | 628,193 |
| Events in quadrant B | 2,969,814 | 638,533 |
| Events in quadrant C | 2,959,539 | 604,088 |
| Events in quadrant D | 3,450,624 | 553,191 |
| Mode SS | |||
|---|---|---|---|
| Quadrant | BADHDUFLAG | Total packets | Discarded packets |
| A | 0 | 112 | 0 |
| B | 0 | 112 | 0 |
| C | 0 | 112 | 0 |
| D | 0 | 112 | 0 |
| Mode M0 | |||
|---|---|---|---|
| Quadrant | BADHDUFLAG | Total packets | Discarded packets |
| A | 0 | 12207 | 3 |
| B | 0 | 12696 | 2 |
| C | 0 | 12248 | 2 |
| D | 0 | 14156 | 2 |
| Mode M9 | |||
|---|---|---|---|
| Quadrant | BADHDUFLAG | Total packets | Discarded packets |
| A | 0 | 25 | 0 |
| B | 0 | 25 | 0 |
| C | 0 | 25 | 0 |
| D | 0 | 26 | 0 |
| Quadrant | Total seconds | Saturated seconds | Saturation percentage |
|---|---|---|---|
| A | 5482 | 18 | 0.328347% |
| B | 5482 | 80 | 1.459321% |
| C | 5482 | 59 | 1.076250% |
| D | 5482 | 103 | 1.878876% |
Noise dominated data is calculated using 1-second bins in cleaned event files. If a bin has >2000 counts, and if more than 50% of those come from <1% of pixels, then it is considered to be noise-dominated and hence unusable.
| Quadrant | # 1 sec bins | Bins with >0 counts | Bins with >2000 counts | High rate bins dominated by noise | Noise dominated (total time) | Noise dominated (detector-on time) | Marked lightcurve |
|---|---|---|---|---|---|---|---|
| A | 7305 | 5483 | 4 | 4 | 0.05% | 0.07% | 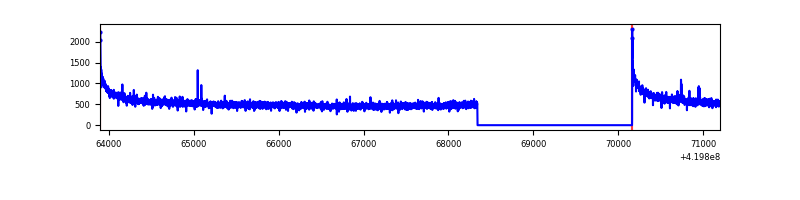 |
| B | 7305 | 5483 | 38 | 38 | 0.52% | 0.69% | 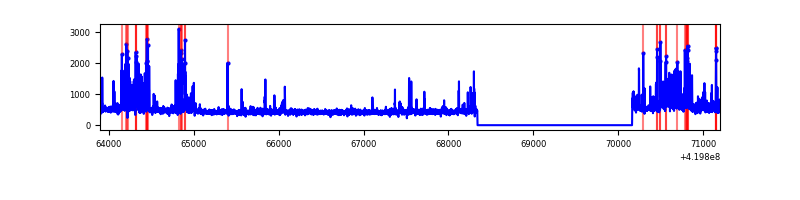 |
| C | 7305 | 5483 | 52 | 52 | 0.71% | 0.95% | 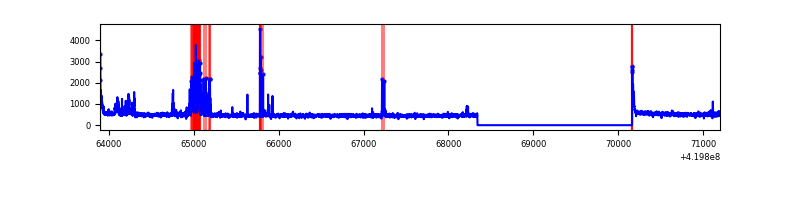 |
| D | 7304 | 5482 | 85 | 85 | 1.16% | 1.55% | 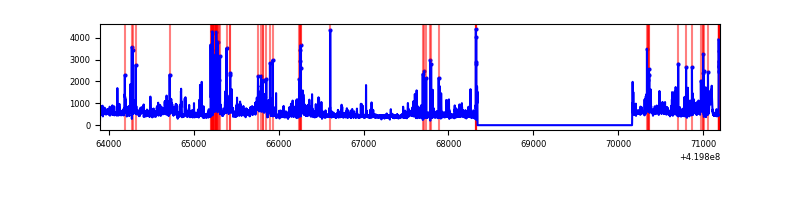 |
Top three noisy pixels from each quadrant. If the there are fewer than three noisy pixels in the level2.evt file, extra rows are filled as -1
| Pixel properties | Quadrant properties | ||||||
|---|---|---|---|---|---|---|---|
| Quadrant | DetID | PixID | Counts | Sigma | Mean | Median | Sigma |
| A | 10 | 83 | 558639 | 4386.86 | 612 | 600 | 127.2 |
| A | 13 | 254 | 9513 | 70.07 | 612 | 600 | 127.2 |
| A | 13 | 6 | 7490 | 54.16 | 612 | 600 | 127.2 |
| B | 4 | 171 | 382897 | 3248.47 | 607 | 591 | 117.7 |
| B | 5 | 255 | 63569 | 535.13 | 607 | 591 | 117.7 |
| B | 0 | 190 | 49346 | 414.27 | 607 | 591 | 117.7 |
| C | 14 | 254 | 325228 | 2343.91 | 597 | 598 | 138.5 |
| C | 15 | 214 | 231276 | 1665.55 | 597 | 598 | 138.5 |
| C | 0 | 10 | 64803 | 463.58 | 597 | 598 | 138.5 |
| D | 12 | 79 | 397397 | 2738.17 | 593 | 577 | 144.9 |
| D | 12 | 233 | 206228 | 1419.05 | 593 | 577 | 144.9 |
| D | 12 | 128 | 134327 | 922.91 | 593 | 577 | 144.9 |
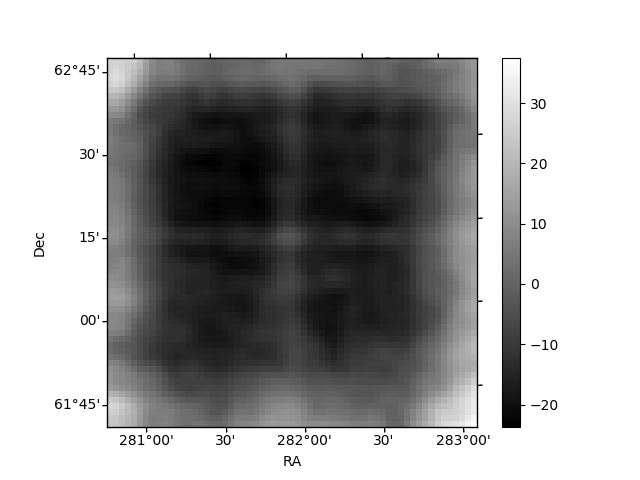
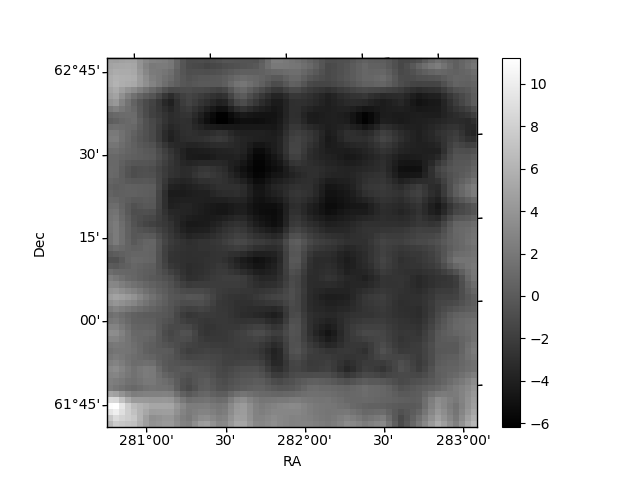
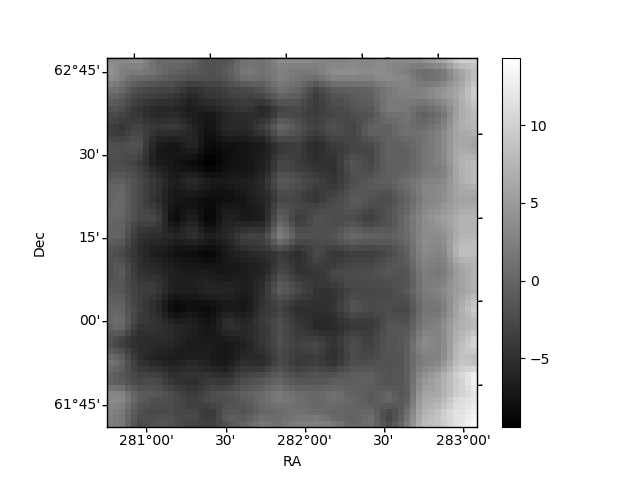
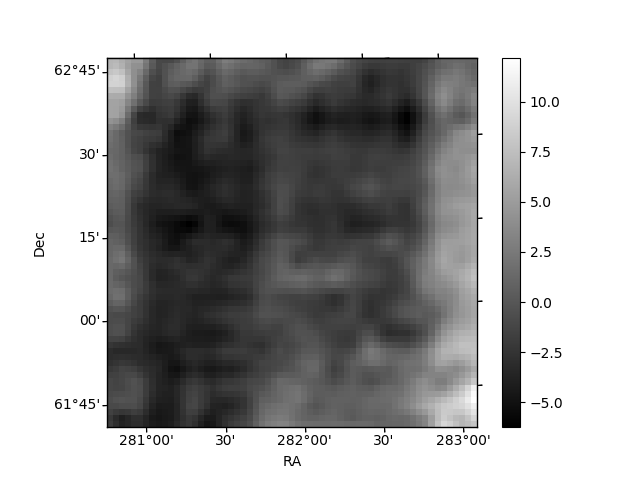
Histogram calculated using DETX and DETY for each event in the final _common_clean file
| Quadrant A | 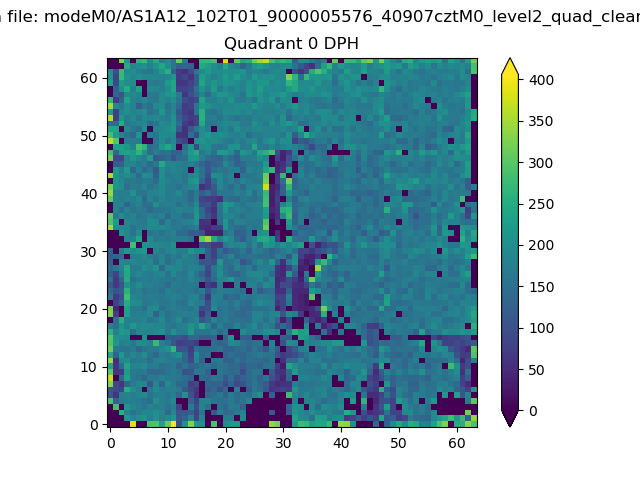 |
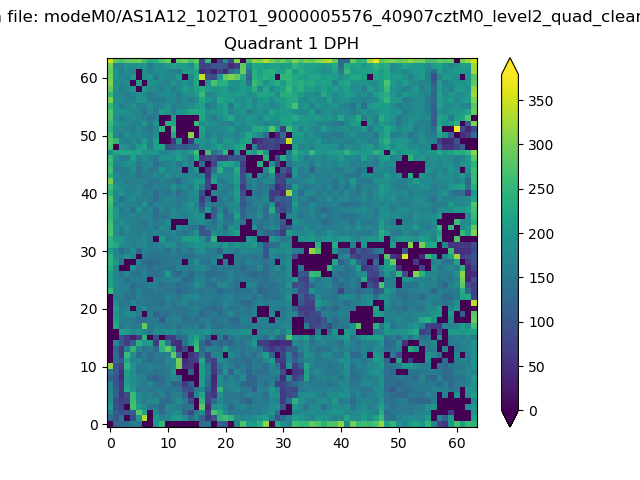 |
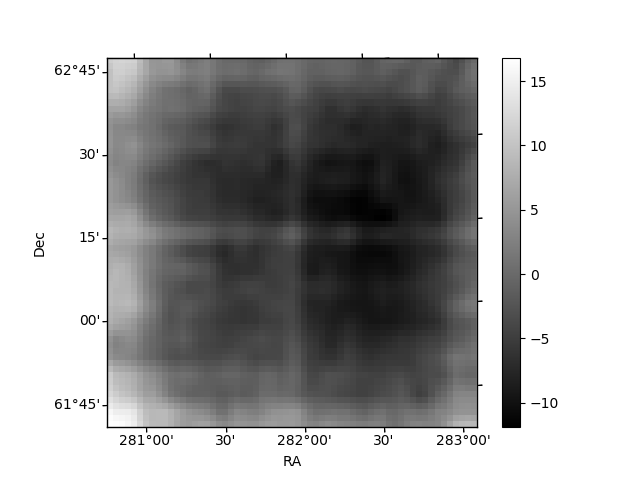
Quadrant B |
|---|---|---|---|
| Quadrant D | 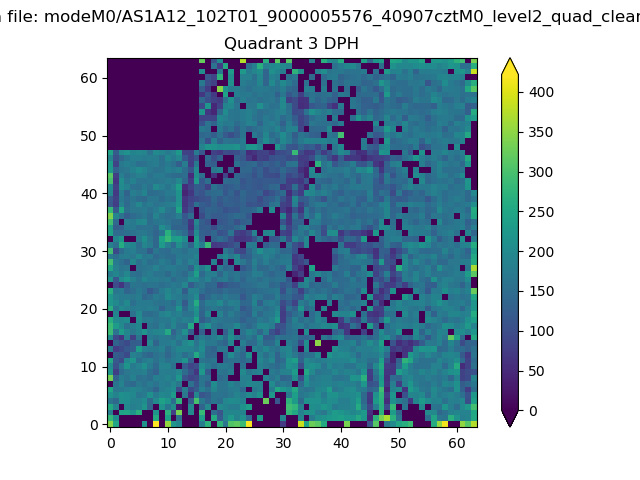 |
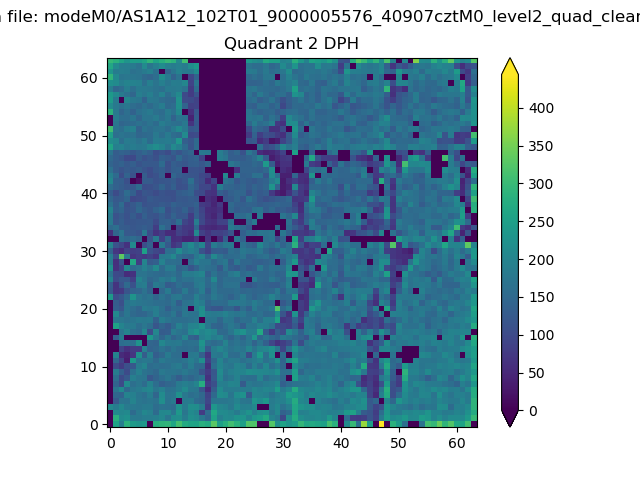 |
Quadrant C |
| Plot type | Count rate plots | Images |
|---|---|---|
| Comparison with Poisson distribution Blue bars denote a histogram of data divided into 1 sec bins. Red curve is a Poisson curve with rate = median count rate of data. |
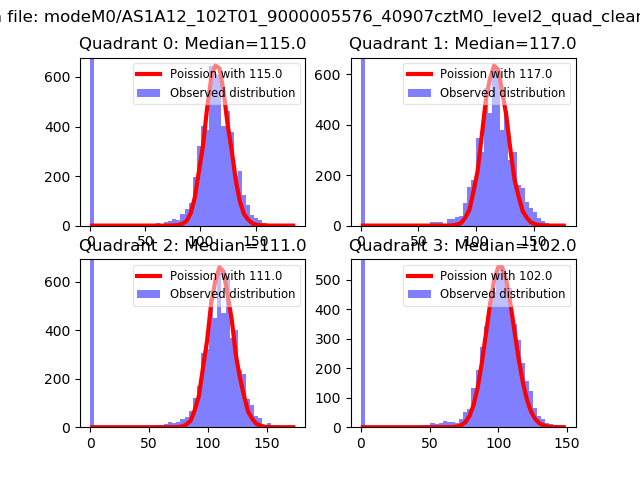 |
 |
| Quadrant-wise count rates Data is divided into 100 sec bins |
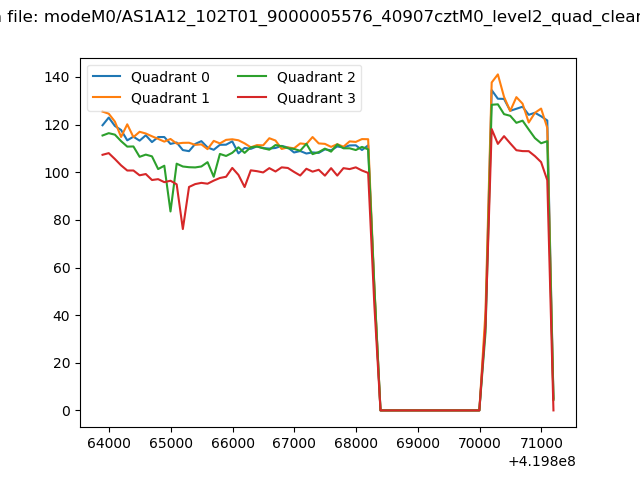 |
|
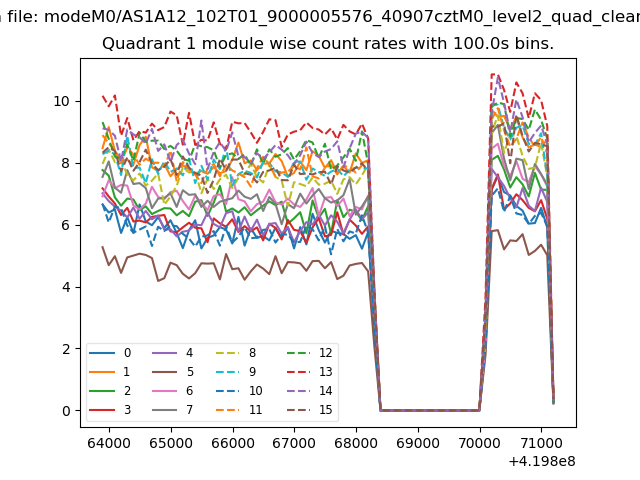
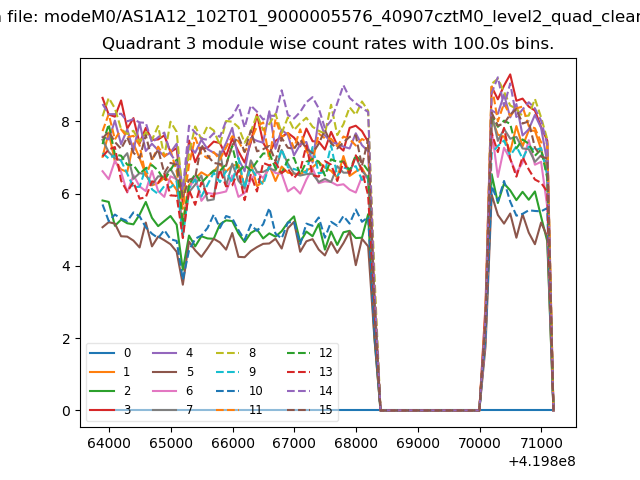
| Module-wise count rates for Quadrant A Data is divided into 100 sec bins |
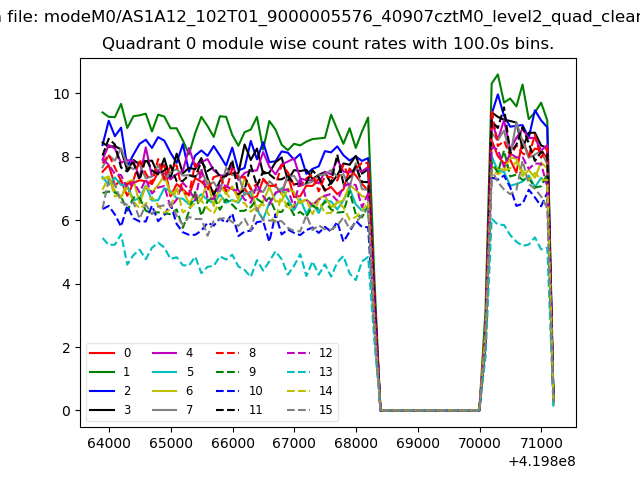 |
 |
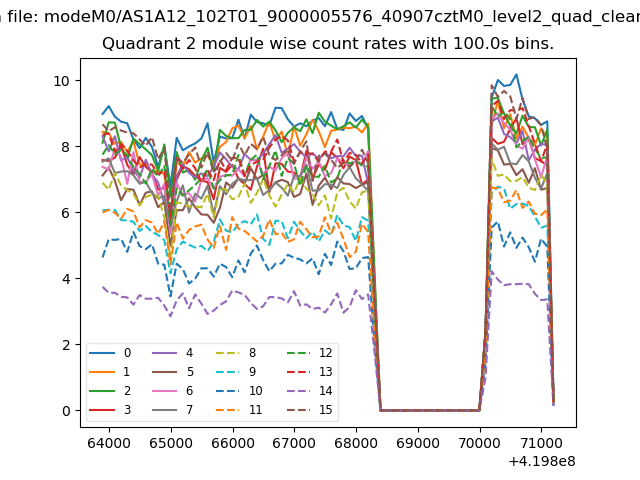
| Module-wise count rates for Quadrant B Data is divided into 100 sec bins |
 |
 |
| Module-wise count rates for Quadrant C Data is divided into 100 sec bins |
 |
 |
| Module-wise count rates for Quadrant D Data is divided into 100 sec bins |
 |
 |
| Parameter | Plot |
|---|---|
| CZT HV Monitor | 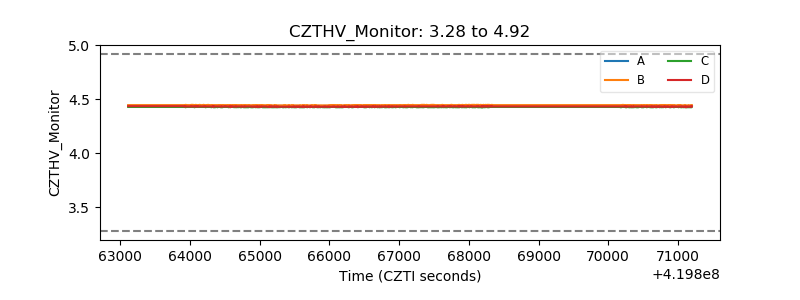 |
| D_VDD | 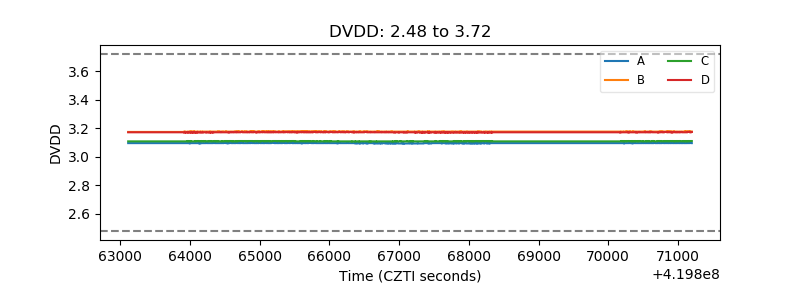 |
| Temperature 1 | 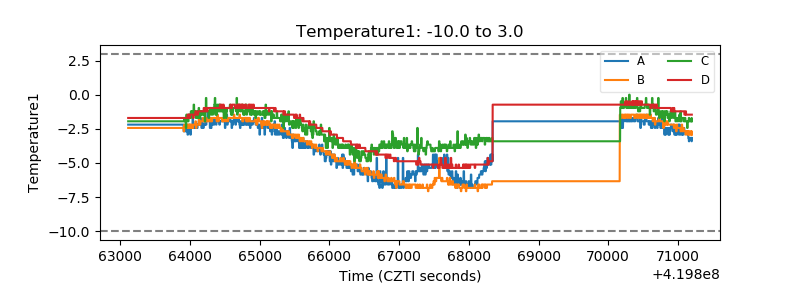 |
| Veto HV Monitor | 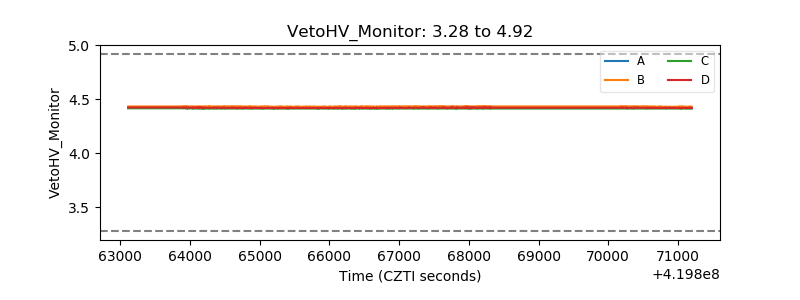 |
| Veto LLD | 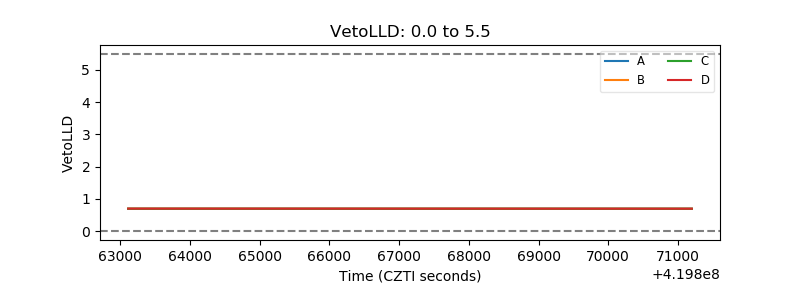 |
| Alpha Counter | 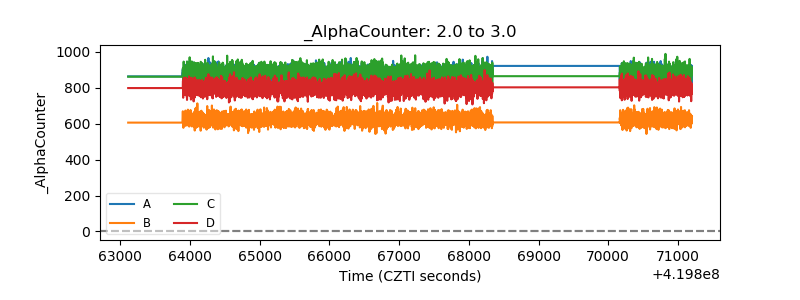 |
| _CPM_Rate | 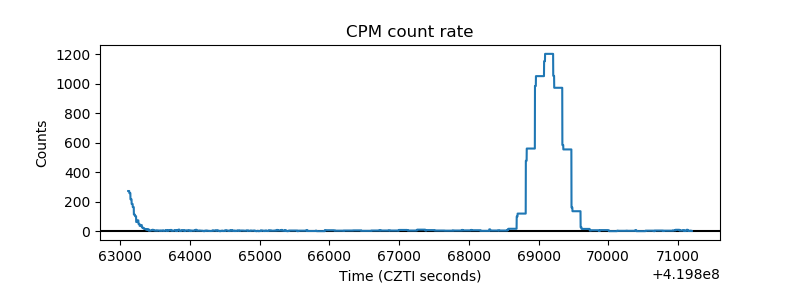 |
| CZT Counter | 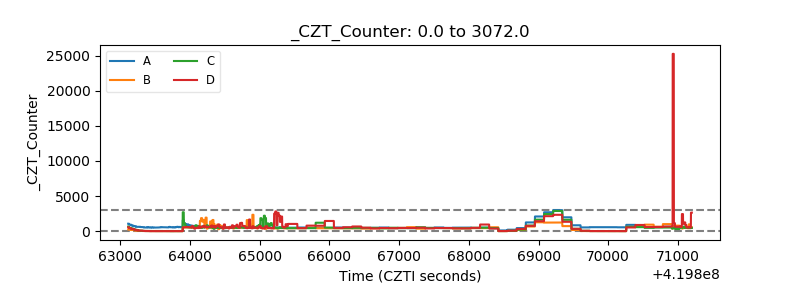 |
| +2.5 Volts monitor | 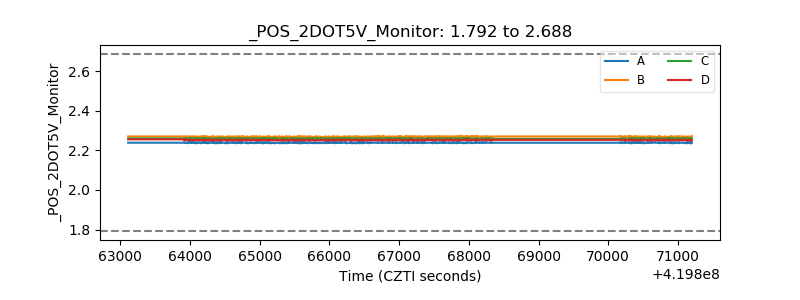 |
| +5 Volts monitor | 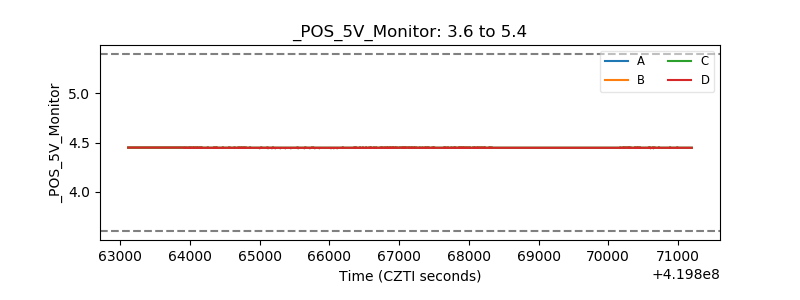 |
| _ROLL_ROT | 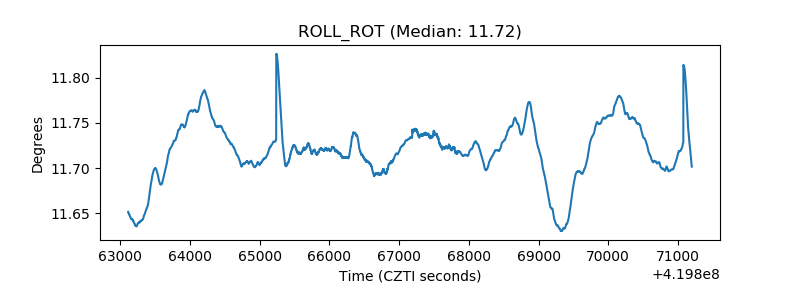 |
| _Roll_DEC | 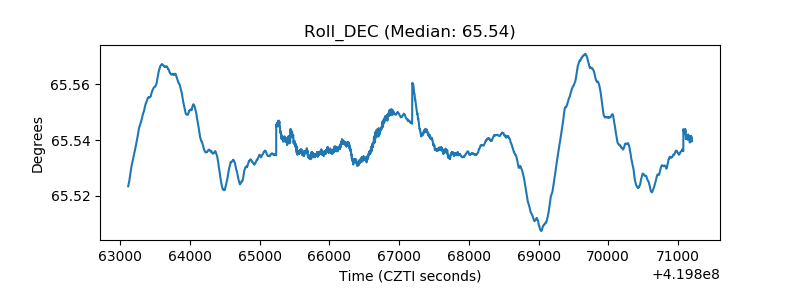 |
| _Roll_RA | 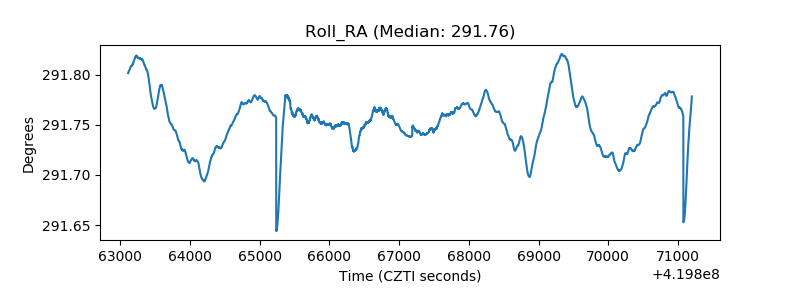 |
| Veto Counter | 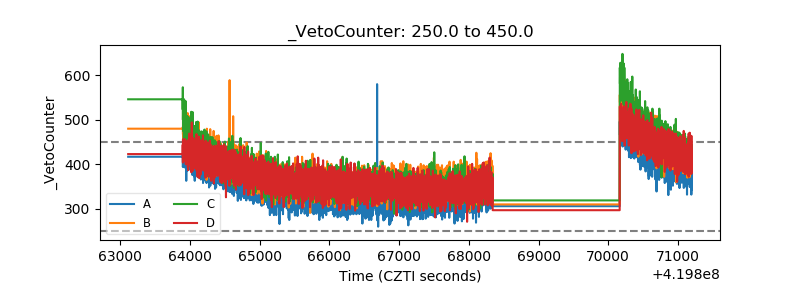 |