| Param | Original file | Final file |
|---|---|---|
| Filename | modeM0/AS1A12_102T01_9000005576_40908cztM0_level2.fits | modeM0/AS1A12_102T01_9000005576_40908cztM0_level2_quad_clean.evt |
| Size (bytes) | 378,869,760 | 91,895,040 |
| Size | 361.3 MB | 87.6 MB |
| Events in quadrant A | 2,955,783 | 635,139 |
| Events in quadrant B | 3,591,209 | 616,971 |
| Events in quadrant C | 2,747,655 | 618,638 |
| Events in quadrant D | 4,318,665 | 542,295 |
| Mode SS | |||
|---|---|---|---|
| Quadrant | BADHDUFLAG | Total packets | Discarded packets |
| A | 0 | 106 | 0 |
| B | 0 | 106 | 0 |
| C | 0 | 106 | 0 |
| D | 0 | 106 | 0 |
| Mode M0 | |||
|---|---|---|---|
| Quadrant | BADHDUFLAG | Total packets | Discarded packets |
| A | 0 | 12131 | 3 |
| B | 0 | 14262 | 2 |
| C | 0 | 11345 | 2 |
| D | 0 | 16448 | 2 |
| Mode M9 | |||
|---|---|---|---|
| Quadrant | BADHDUFLAG | Total packets | Discarded packets |
| A | 0 | 23 | 0 |
| B | 0 | 23 | 0 |
| C | 0 | 23 | 0 |
| D | 0 | 24 | 0 |
| Quadrant | Total seconds | Saturated seconds | Saturation percentage |
|---|---|---|---|
| A | 5283 | 37 | 0.700360% |
| B | 5283 | 348 | 6.587166% |
| C | 5283 | 35 | 0.662502% |
| D | 5283 | 369 | 6.984668% |
Noise dominated data is calculated using 1-second bins in cleaned event files. If a bin has >2000 counts, and if more than 50% of those come from <1% of pixels, then it is considered to be noise-dominated and hence unusable.
| Quadrant | # 1 sec bins | Bins with >0 counts | Bins with >2000 counts | High rate bins dominated by noise | Noise dominated (total time) | Noise dominated (detector-on time) | Marked lightcurve |
|---|---|---|---|---|---|---|---|
| A | 7225 | 5284 | 12 | 12 | 0.17% | 0.23% | 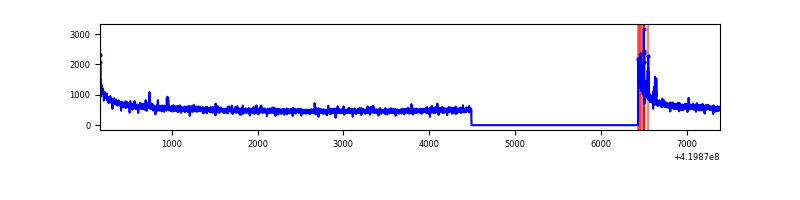 |
| B | 7225 | 5284 | 263 | 263 | 3.64% | 4.98% | 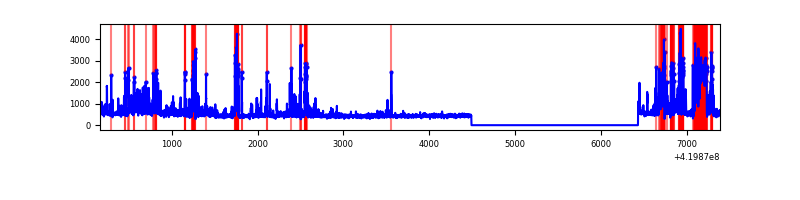 |
| C | 7225 | 5284 | 29 | 29 | 0.40% | 0.55% | 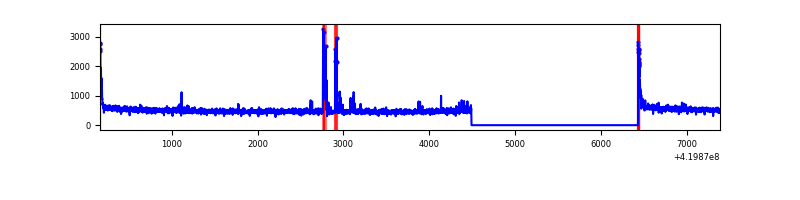 |
| D | 7225 | 5284 | 400 | 400 | 5.54% | 7.57% | 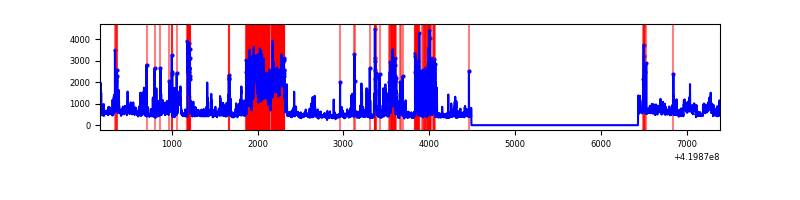 |
Top three noisy pixels from each quadrant. If the there are fewer than three noisy pixels in the level2.evt file, extra rows are filled as -1
| Pixel properties | Quadrant properties | ||||||
|---|---|---|---|---|---|---|---|
| Quadrant | DetID | PixID | Counts | Sigma | Mean | Median | Sigma |
| A | 10 | 83 | 538120 | 4379.1 | 603 | 591 | 122.7 |
| A | 7 | 3 | 66720 | 538.73 | 603 | 591 | 122.7 |
| A | 13 | 254 | 8955 | 68.14 | 603 | 591 | 122.7 |
| B | 5 | 32 | 524152 | 4714.46 | 583 | 567 | 111.1 |
| B | 4 | 171 | 382104 | 3435.43 | 583 | 567 | 111.1 |
| B | 5 | 255 | 268753 | 2414.8 | 583 | 567 | 111.1 |
| C | 15 | 214 | 223992 | 1641.49 | 594 | 598 | 136.1 |
| C | 14 | 254 | 102845 | 751.31 | 594 | 598 | 136.1 |
| C | 0 | 10 | 80008 | 583.5 | 594 | 598 | 136.1 |
| D | 2 | 153 | 773268 | 5518.33 | 579 | 564 | 140.0 |
| D | 12 | 128 | 343018 | 2445.67 | 579 | 564 | 140.0 |
| D | 12 | 79 | 309293 | 2204.82 | 579 | 564 | 140.0 |
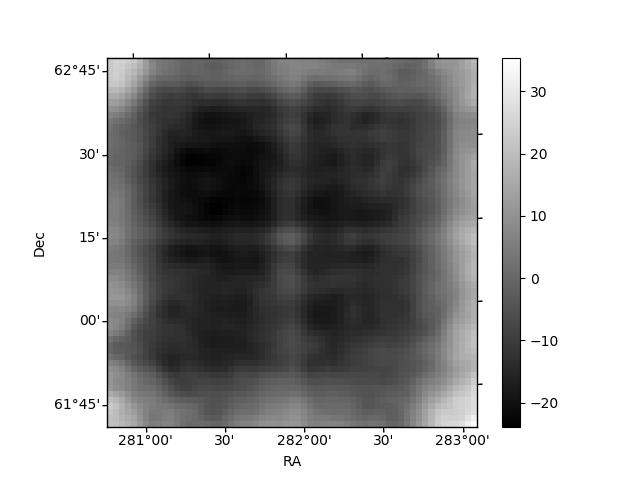
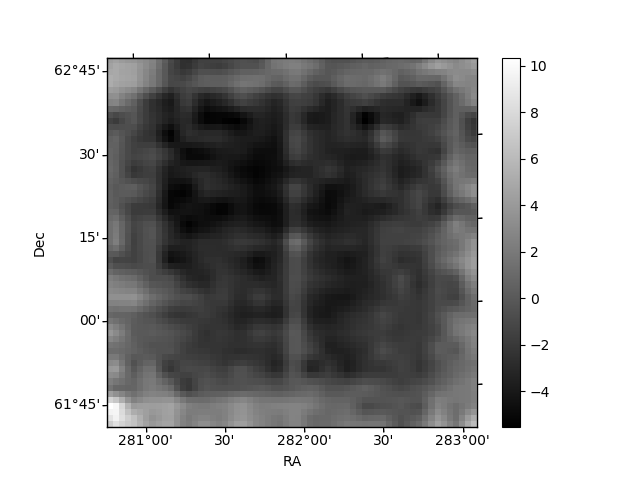
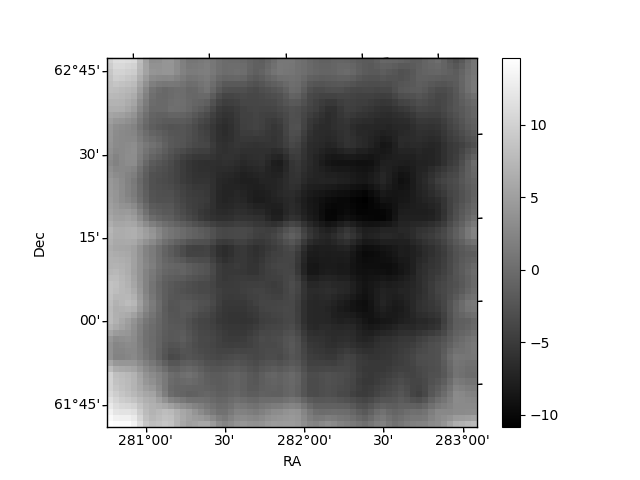
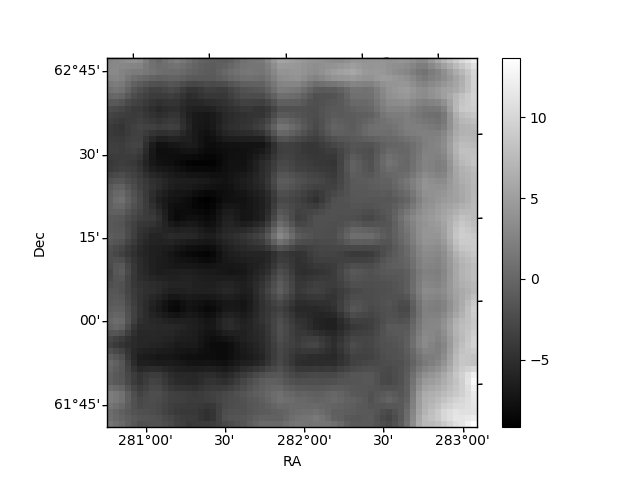
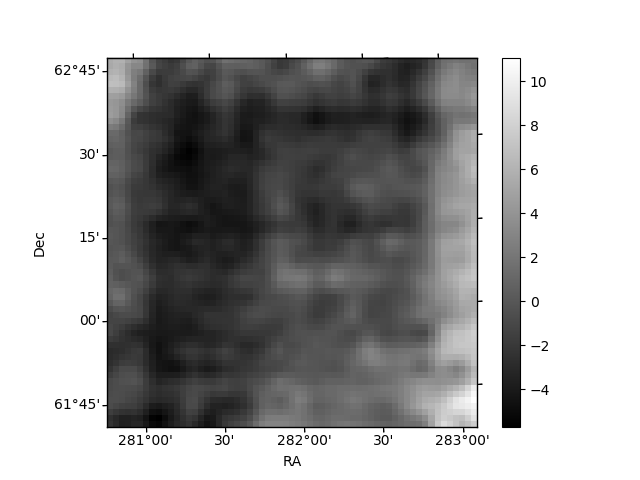
Histogram calculated using DETX and DETY for each event in the final _common_clean file
| Quadrant A | 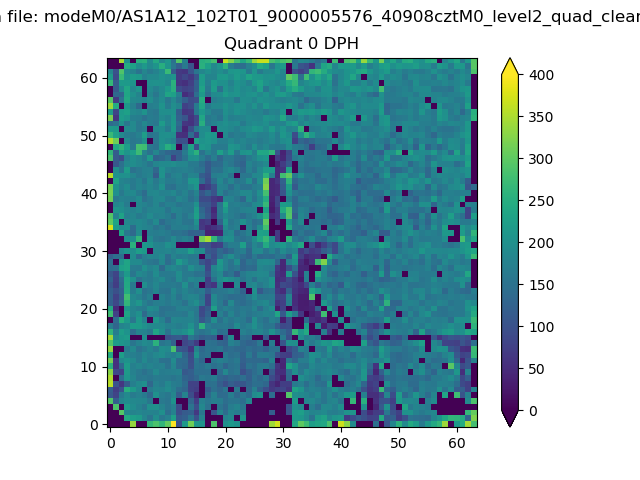 |
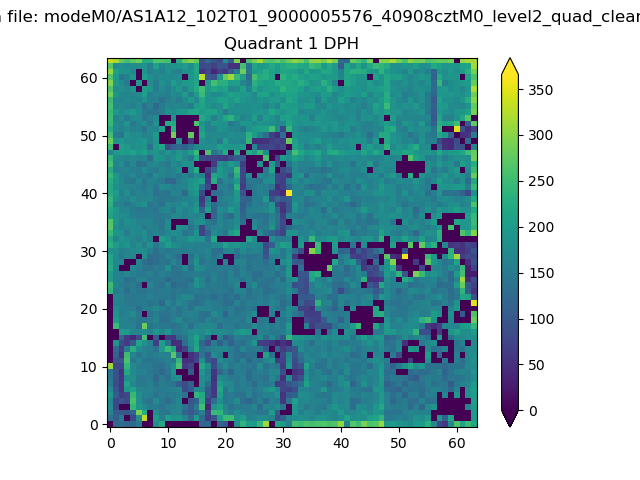 |
Quadrant B |
|---|---|---|---|
| Quadrant D | 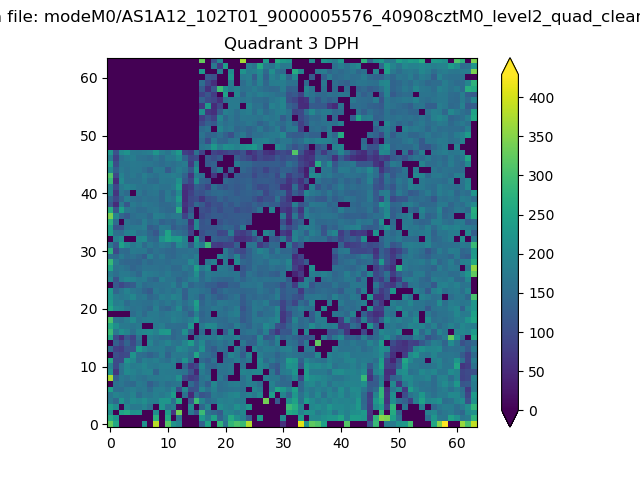 |
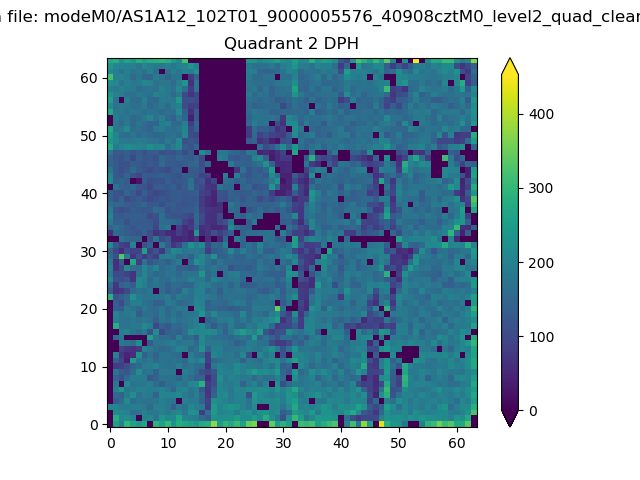 |
Quadrant C |
| Plot type | Count rate plots | Images |
|---|---|---|
| Comparison with Poisson distribution Blue bars denote a histogram of data divided into 1 sec bins. Red curve is a Poisson curve with rate = median count rate of data. |
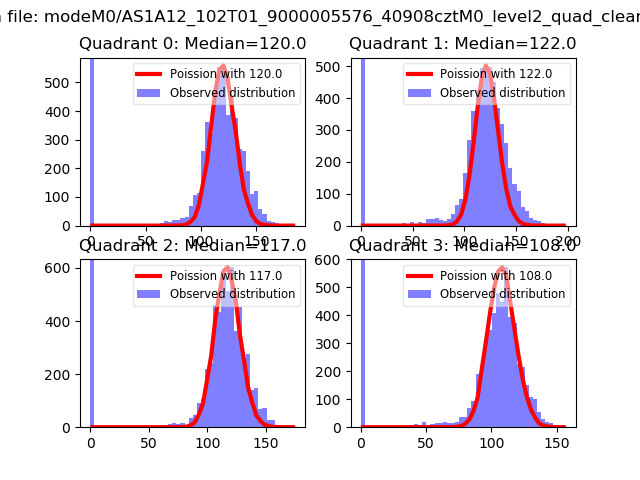 |
 |
| Quadrant-wise count rates Data is divided into 100 sec bins |
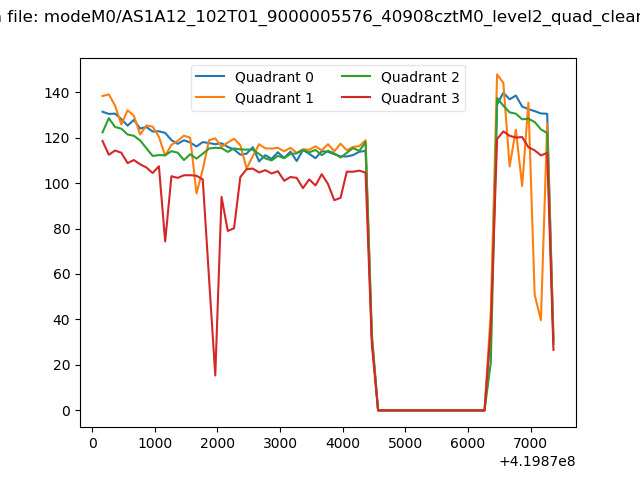 |
|
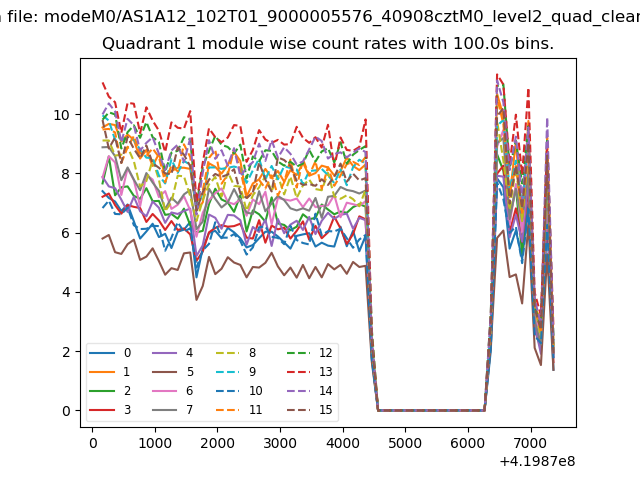
| Module-wise count rates for Quadrant A Data is divided into 100 sec bins |
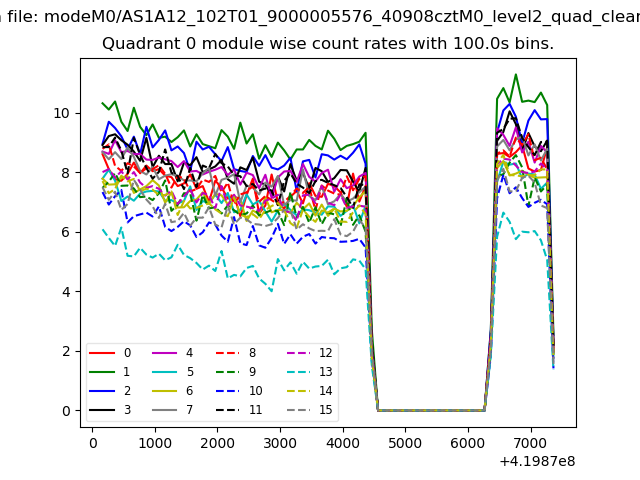 |
 |
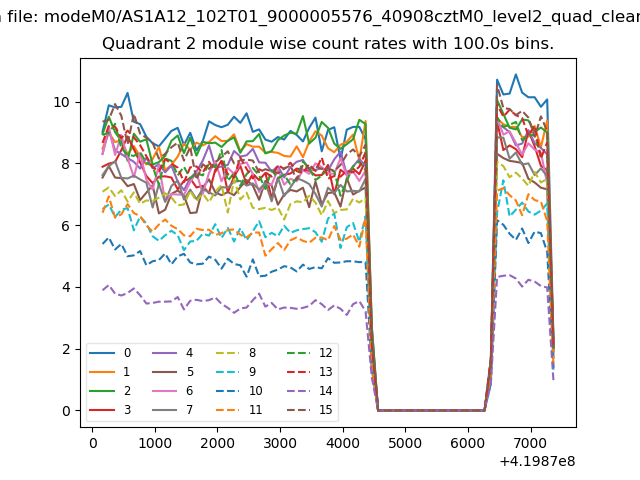
| Module-wise count rates for Quadrant B Data is divided into 100 sec bins |
 |
 |
| Module-wise count rates for Quadrant C Data is divided into 100 sec bins |
 |
 |
| Module-wise count rates for Quadrant D Data is divided into 100 sec bins |
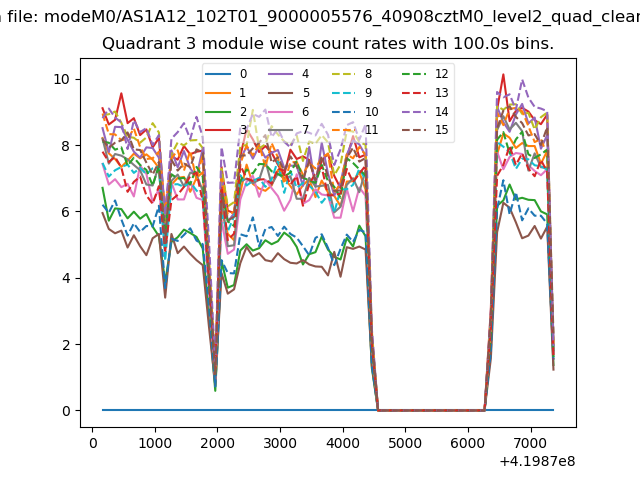 |
 |
| Parameter | Plot |
|---|---|
| CZT HV Monitor | 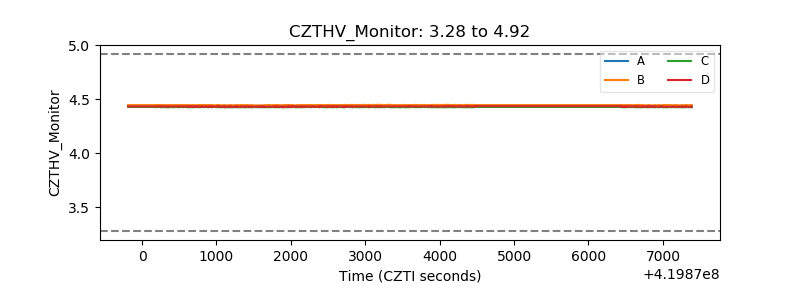 |
| D_VDD | 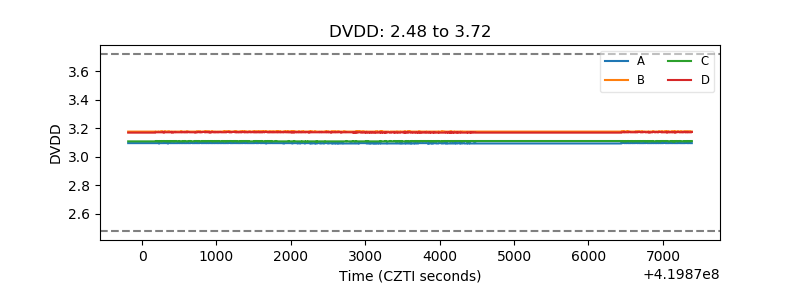 |
| Temperature 1 | 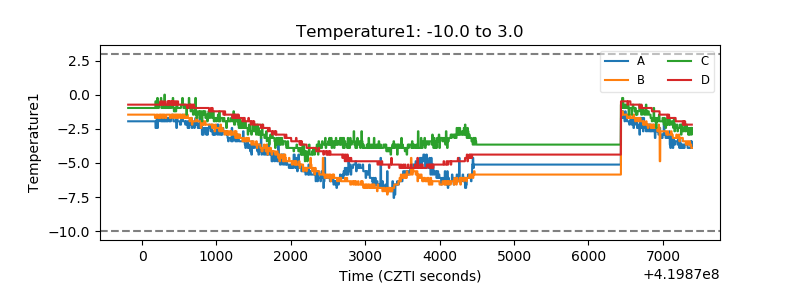 |
| Veto HV Monitor | 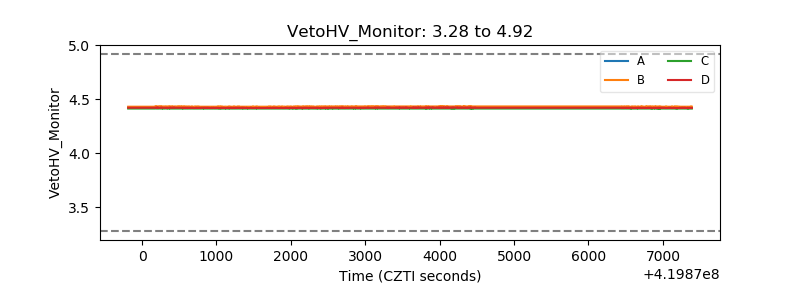 |
| Veto LLD | 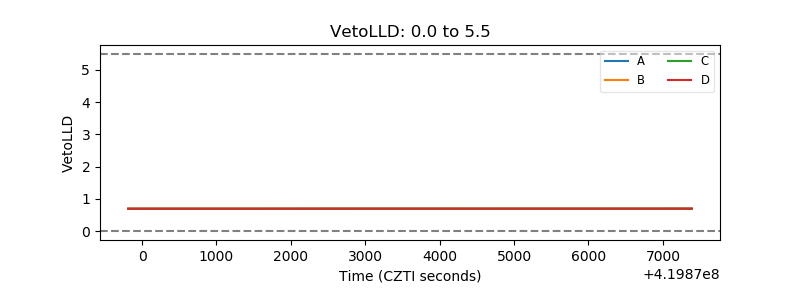 |
| Alpha Counter | 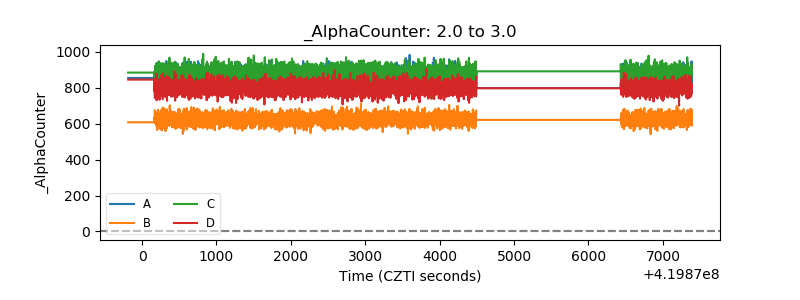 |
| _CPM_Rate |  |
| CZT Counter | 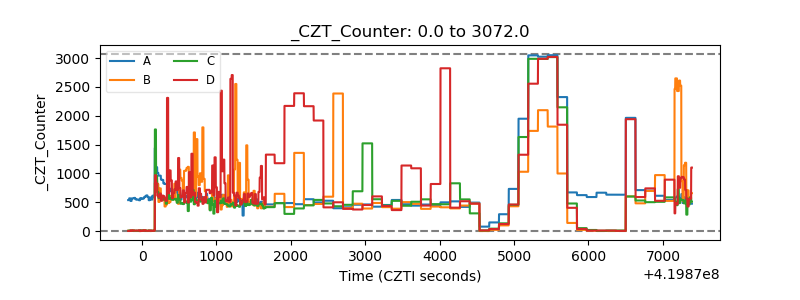 |
| +2.5 Volts monitor | 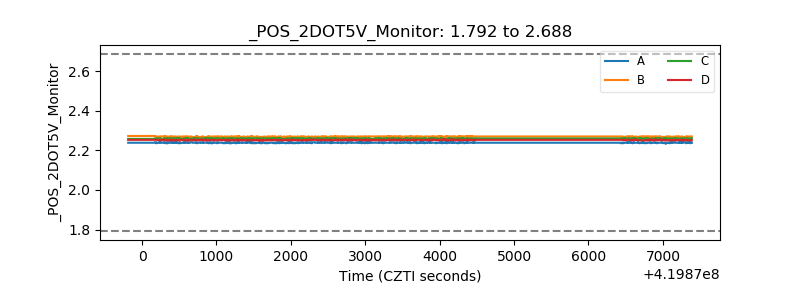 |
| +5 Volts monitor | 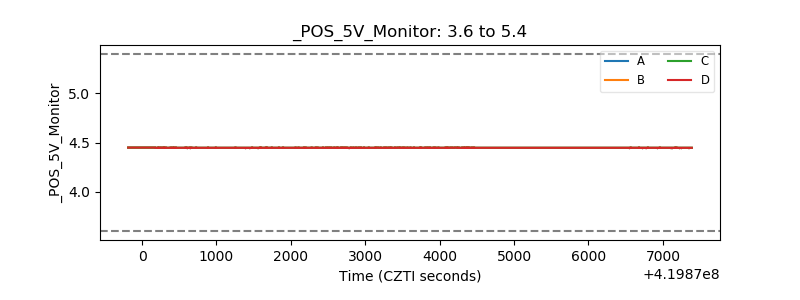 |
| _ROLL_ROT | 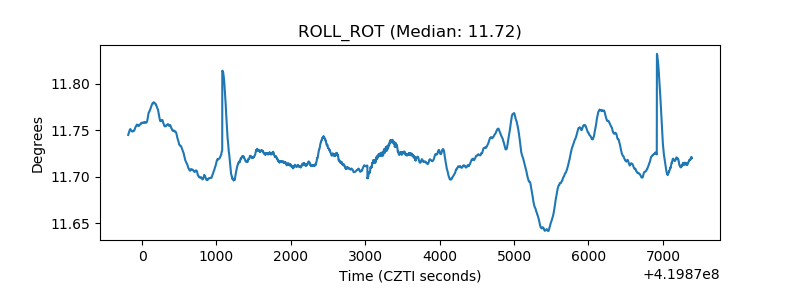 |
| _Roll_DEC | 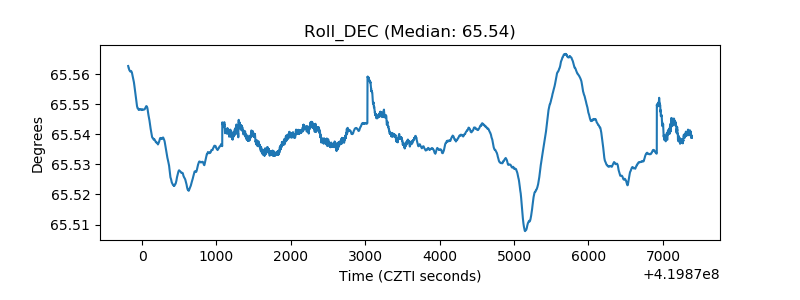 |
| _Roll_RA | 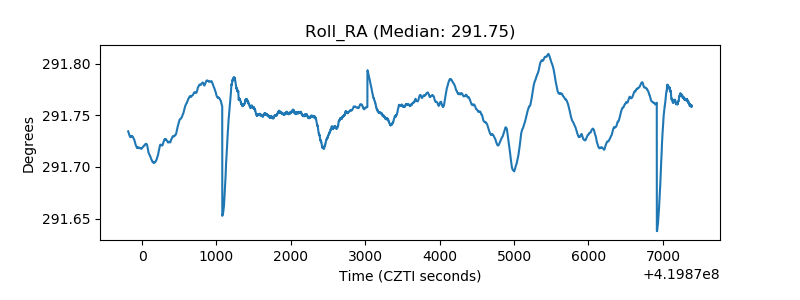 |
| Veto Counter | 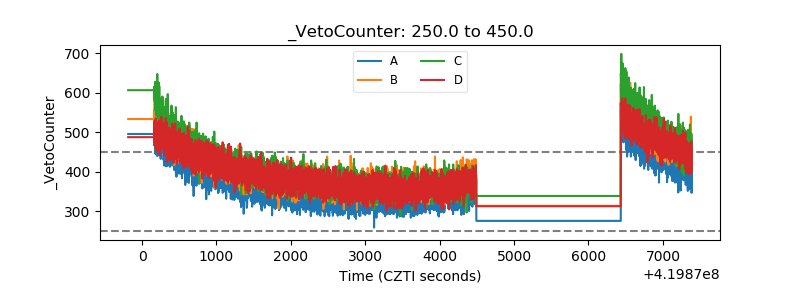 |