| Param | Original file | Final file |
|---|---|---|
| Filename | modeM0/AS1A12_102T01_9000005576_40909cztM0_level2.fits | modeM0/AS1A12_102T01_9000005576_40909cztM0_level2_quad_clean.evt |
| Size (bytes) | 318,971,520 | 88,464,960 |
| Size | 304.2 MB | 84.4 MB |
| Events in quadrant A | 2,781,267 | 606,454 |
| Events in quadrant B | 3,070,571 | 593,615 |
| Events in quadrant C | 2,520,649 | 593,318 |
| Events in quadrant D | 3,054,030 | 542,772 |
| Mode SS | |||
|---|---|---|---|
| Quadrant | BADHDUFLAG | Total packets | Discarded packets |
| A | 0 | 100 | 0 |
| B | 0 | 100 | 0 |
| C | 0 | 100 | 0 |
| D | 0 | 100 | 0 |
| Mode M0 | |||
|---|---|---|---|
| Quadrant | BADHDUFLAG | Total packets | Discarded packets |
| A | 0 | 11347 | 3 |
| B | 0 | 12416 | 2 |
| C | 0 | 10436 | 2 |
| D | 0 | 12426 | 2 |
| Mode M9 | |||
|---|---|---|---|
| Quadrant | BADHDUFLAG | Total packets | Discarded packets |
| A | 0 | 31 | 0 |
| B | 0 | 31 | 0 |
| C | 0 | 31 | 0 |
| D | 0 | 32 | 0 |
| Quadrant | Total seconds | Saturated seconds | Saturation percentage |
|---|---|---|---|
| A | 4885 | 34 | 0.696008% |
| B | 4885 | 281 | 5.752303% |
| C | 4885 | 49 | 1.003071% |
| D | 4885 | 77 | 1.576254% |
Noise dominated data is calculated using 1-second bins in cleaned event files. If a bin has >2000 counts, and if more than 50% of those come from <1% of pixels, then it is considered to be noise-dominated and hence unusable.
| Quadrant | # 1 sec bins | Bins with >0 counts | Bins with >2000 counts | High rate bins dominated by noise | Noise dominated (total time) | Noise dominated (detector-on time) | Marked lightcurve |
|---|---|---|---|---|---|---|---|
| A | 6948 | 4886 | 12 | 12 | 0.17% | 0.25% | 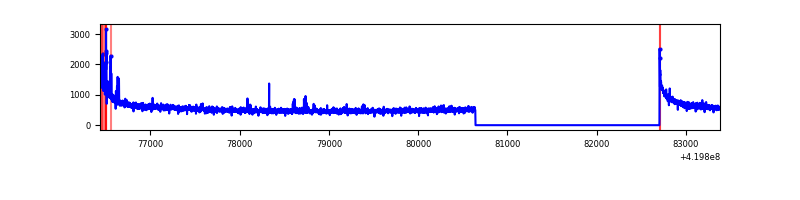 |
| B | 6948 | 4886 | 209 | 209 | 3.01% | 4.28% | 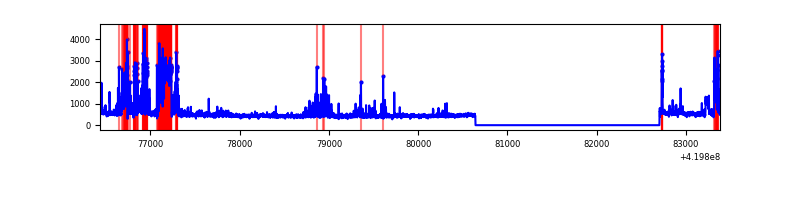 |
| C | 6948 | 4886 | 36 | 36 | 0.52% | 0.74% | 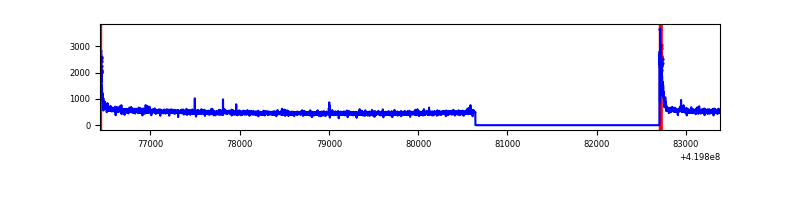 |
| D | 6948 | 4886 | 64 | 64 | 0.92% | 1.31% | 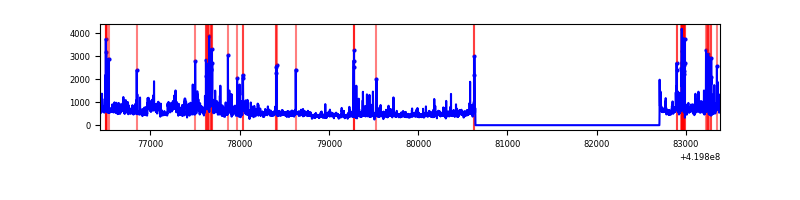 |
Top three noisy pixels from each quadrant. If the there are fewer than three noisy pixels in the level2.evt file, extra rows are filled as -1
| Pixel properties | Quadrant properties | ||||||
|---|---|---|---|---|---|---|---|
| Quadrant | DetID | PixID | Counts | Sigma | Mean | Median | Sigma |
| A | 10 | 83 | 513613 | 4479.39 | 559 | 549 | 114.5 |
| A | 7 | 3 | 60988 | 527.67 | 559 | 549 | 114.5 |
| A | 12 | 189 | 21959 | 186.92 | 559 | 549 | 114.5 |
| B | 5 | 32 | 639039 | 6267.38 | 546 | 534 | 101.9 |
| B | 5 | 255 | 115535 | 1128.82 | 546 | 534 | 101.9 |
| B | 4 | 171 | 86601 | 844.81 | 546 | 534 | 101.9 |
| C | 15 | 214 | 208457 | 1621.63 | 555 | 559 | 128.2 |
| C | 0 | 10 | 130289 | 1011.91 | 555 | 559 | 128.2 |
| C | 14 | 254 | 5171 | 35.97 | 555 | 559 | 128.2 |
| D | 12 | 79 | 462711 | 3483.24 | 548 | 534 | 132.7 |
| D | 12 | 233 | 102736 | 770.26 | 548 | 534 | 132.7 |
| D | 2 | 249 | 98442 | 737.89 | 548 | 534 | 132.7 |
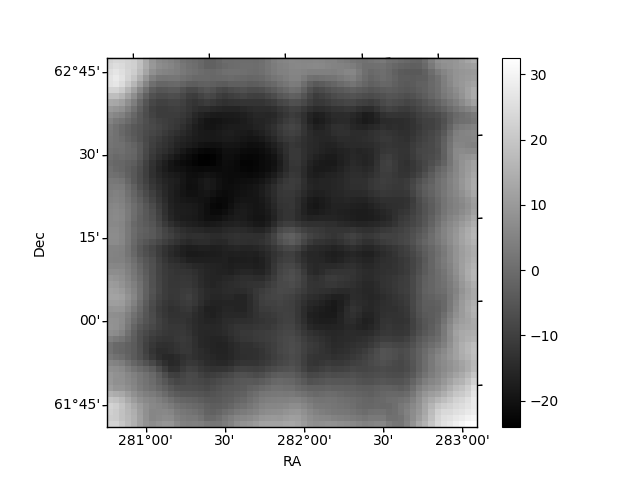
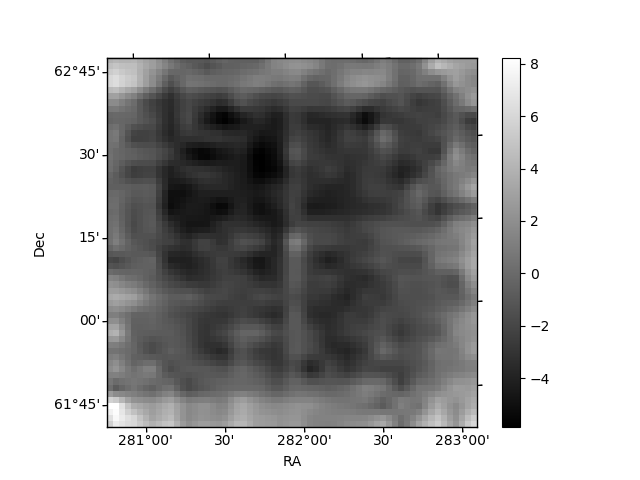
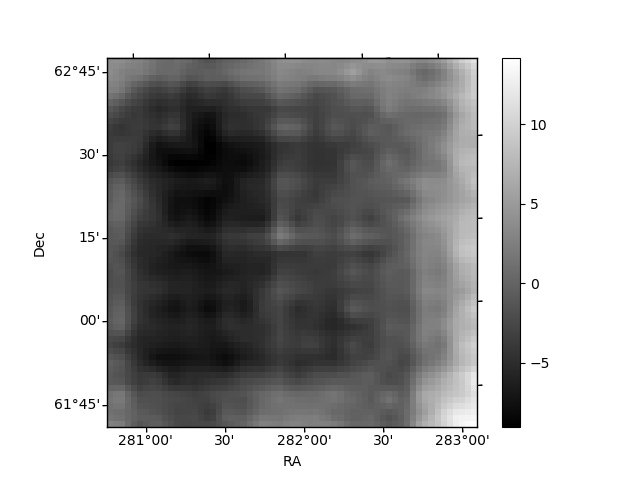
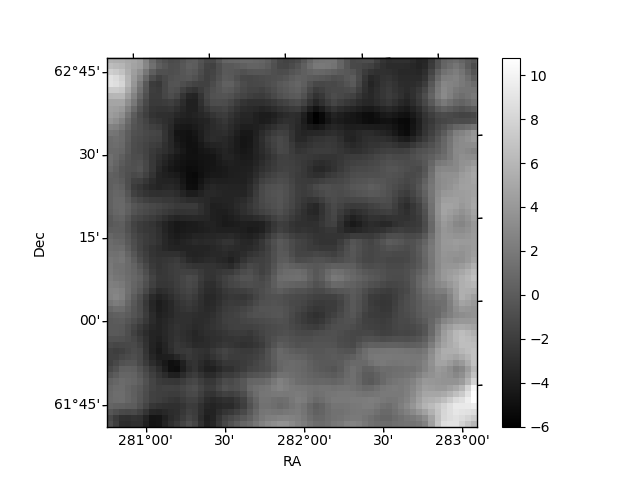
Histogram calculated using DETX and DETY for each event in the final _common_clean file
| Quadrant A | 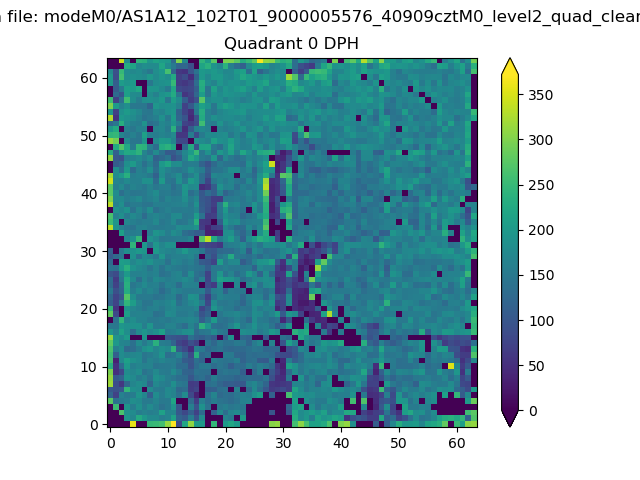 |
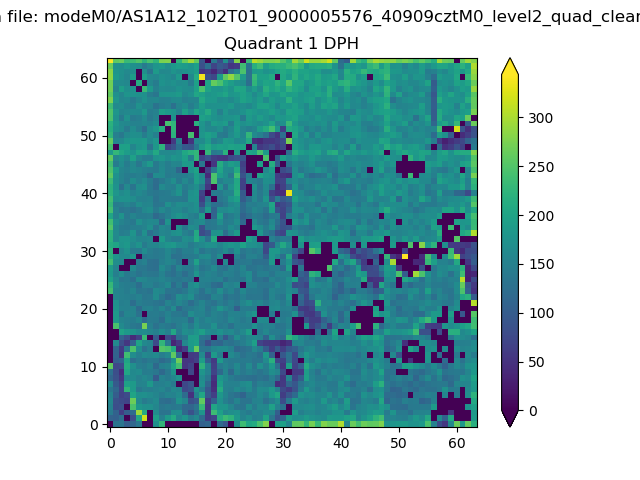 |
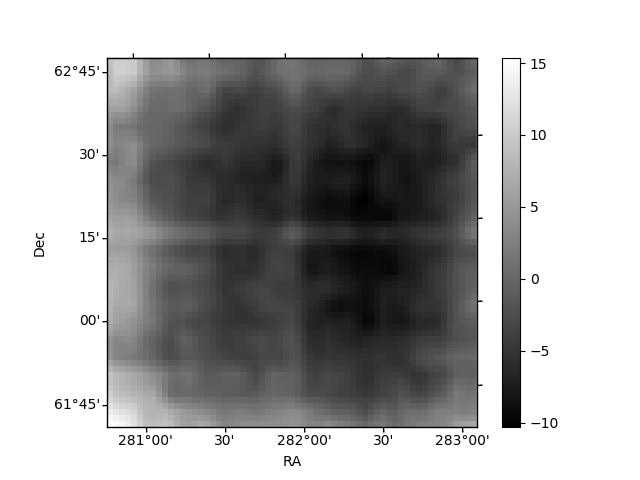
Quadrant B |
|---|---|---|---|
| Quadrant D | 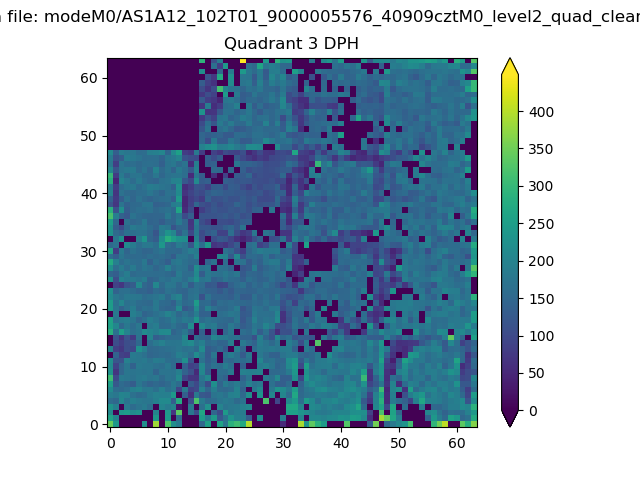 |
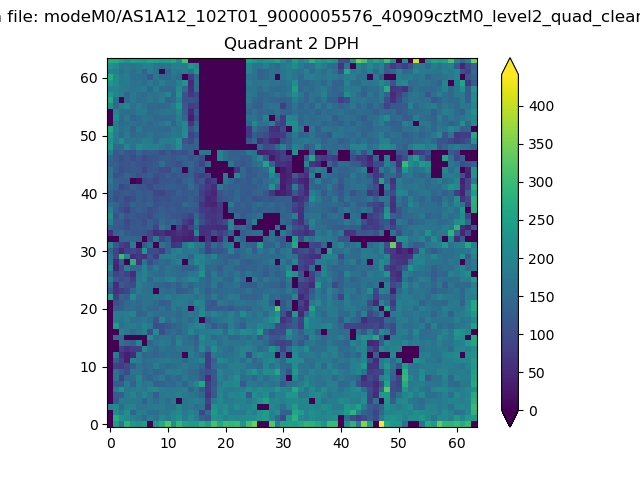 |
Quadrant C |
| Plot type | Count rate plots | Images |
|---|---|---|
| Comparison with Poisson distribution Blue bars denote a histogram of data divided into 1 sec bins. Red curve is a Poisson curve with rate = median count rate of data. |
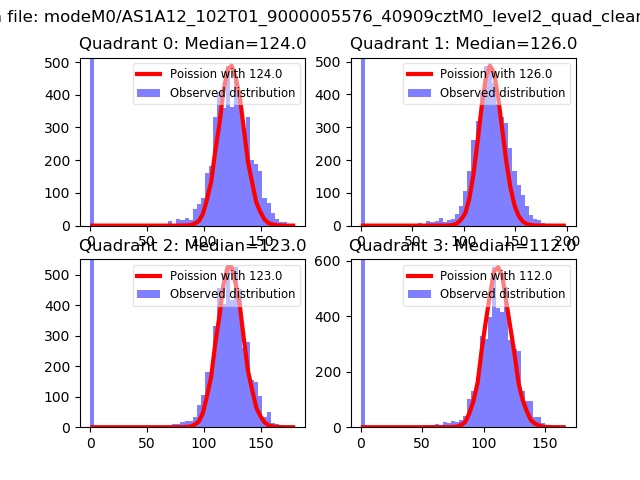 |
 |
| Quadrant-wise count rates Data is divided into 100 sec bins |
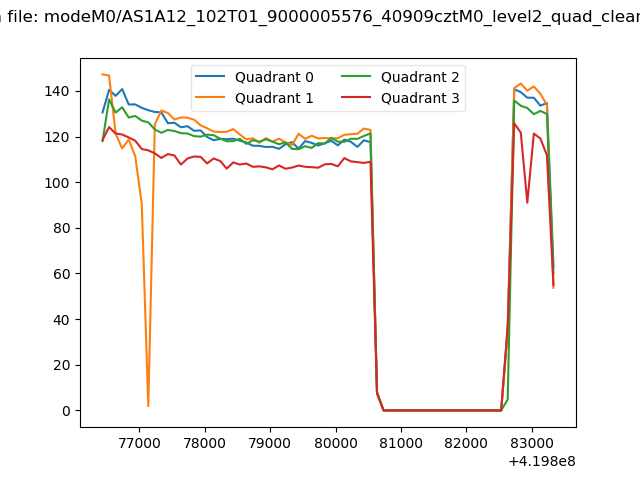 |
|
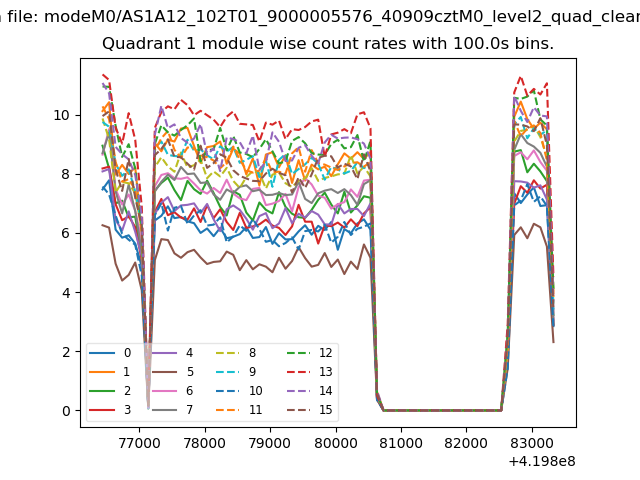
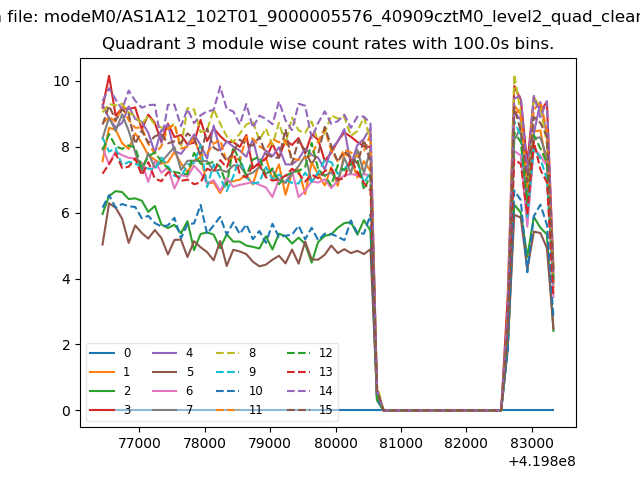
| Module-wise count rates for Quadrant A Data is divided into 100 sec bins |
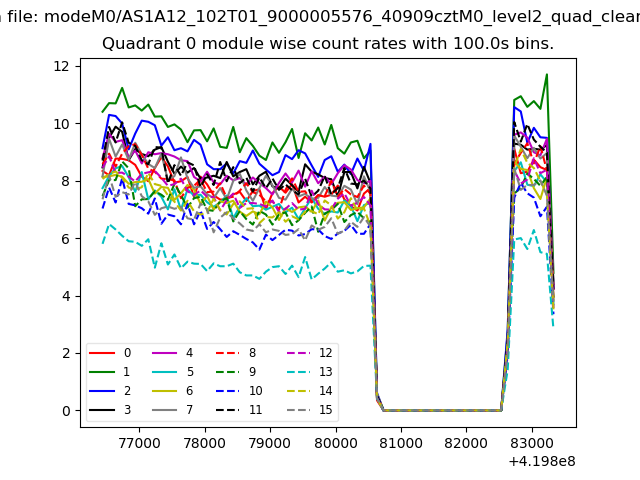 |
 |
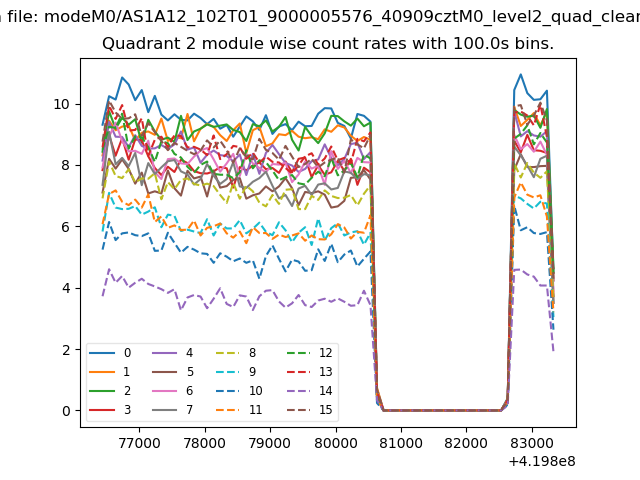
| Module-wise count rates for Quadrant B Data is divided into 100 sec bins |
 |
 |
| Module-wise count rates for Quadrant C Data is divided into 100 sec bins |
 |
 |
| Module-wise count rates for Quadrant D Data is divided into 100 sec bins |
 |
 |
| Parameter | Plot |
|---|---|
| CZT HV Monitor | 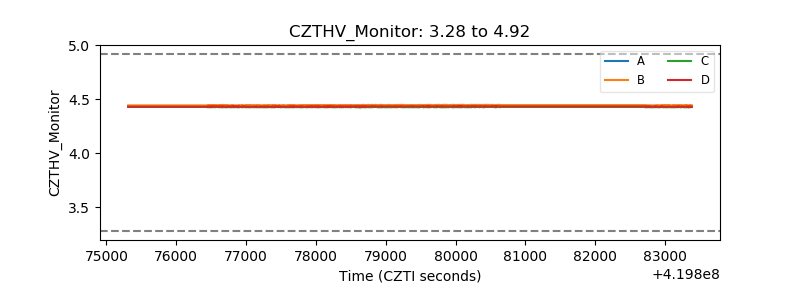 |
| D_VDD | 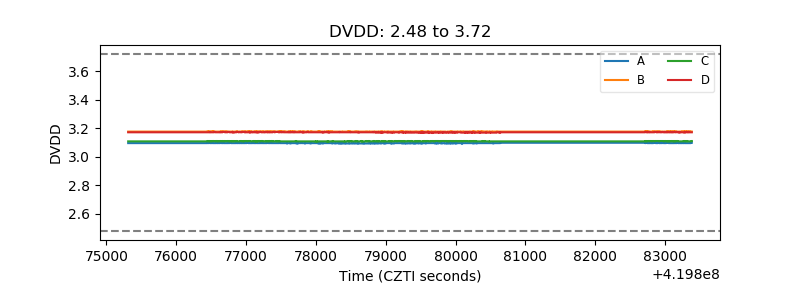 |
| Temperature 1 | 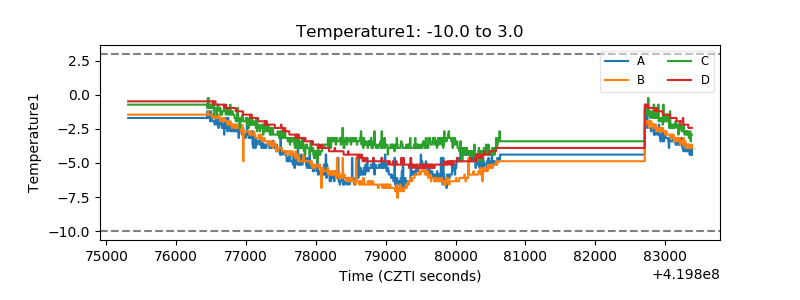 |
| Veto HV Monitor | 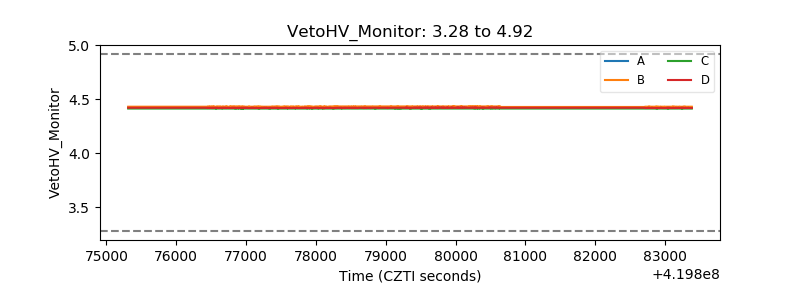 |
| Veto LLD | 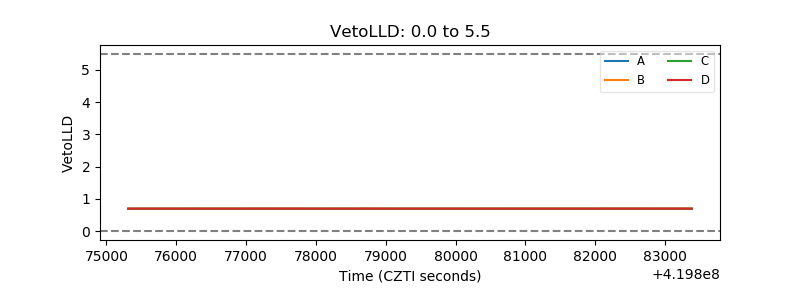 |
| Alpha Counter | 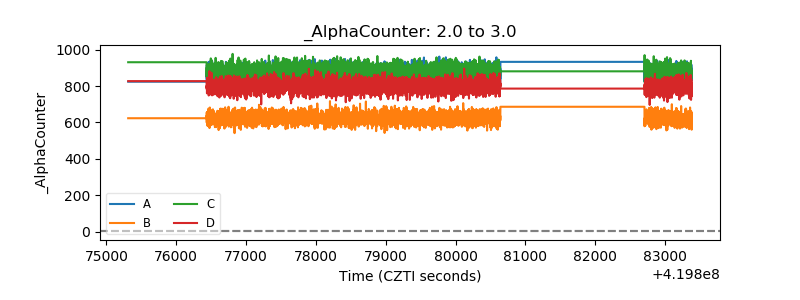 |
| _CPM_Rate | 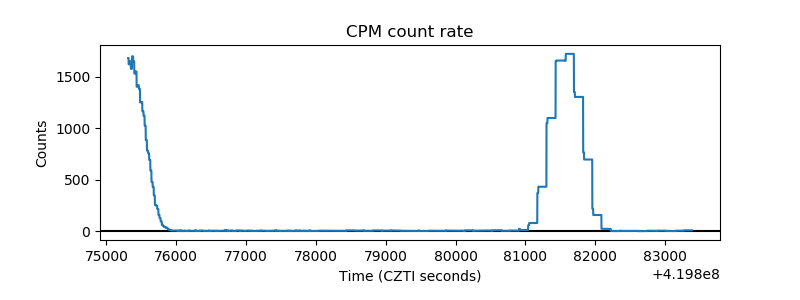 |
| CZT Counter | 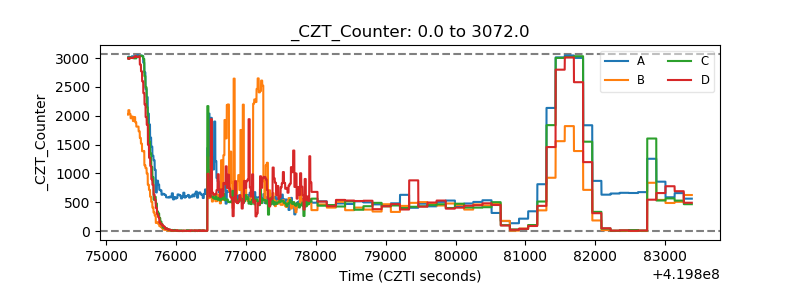 |
| +2.5 Volts monitor |  |
| +5 Volts monitor | 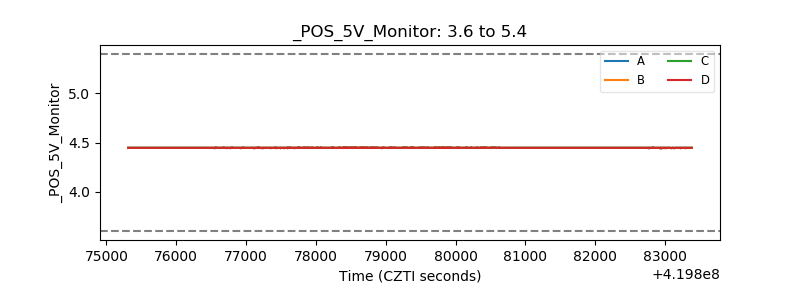 |
| _ROLL_ROT | 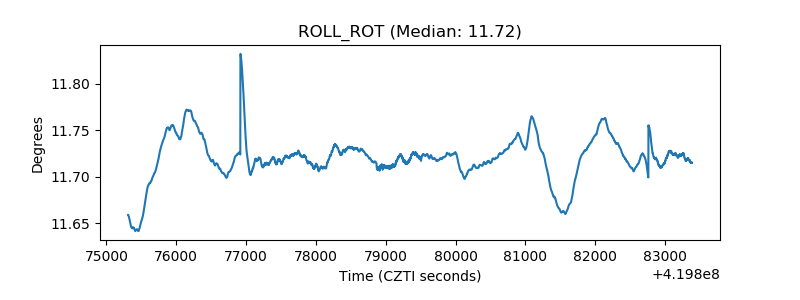 |
| _Roll_DEC | 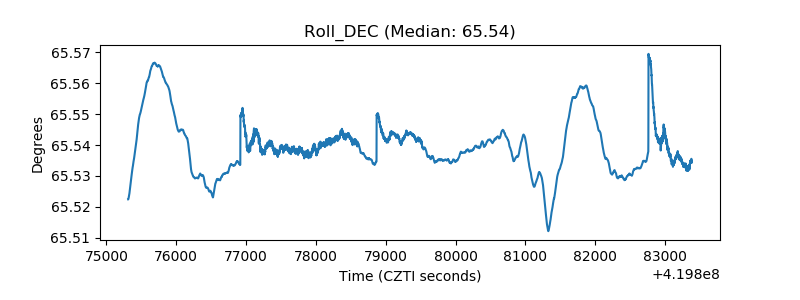 |
| _Roll_RA | 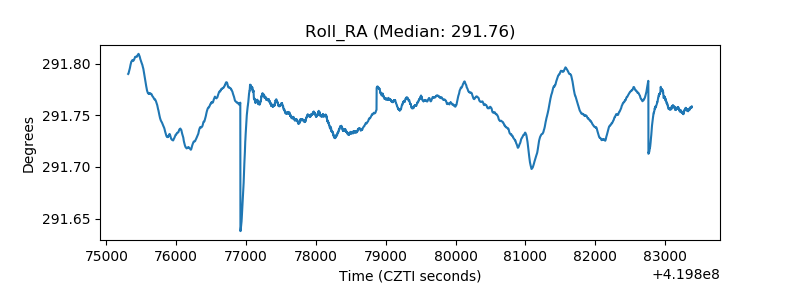 |
| Veto Counter | 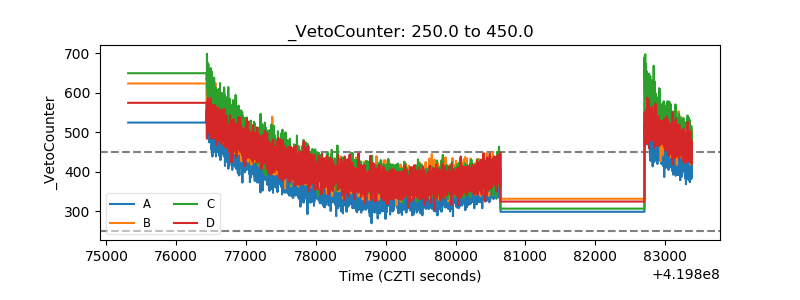 |