| Param | Original file | Final file |
|---|---|---|
| Filename | modeM0/AS1A12_102T01_9000005576_40910cztM0_level2.fits | modeM0/AS1A12_102T01_9000005576_40910cztM0_level2_quad_clean.evt |
| Size (bytes) | 317,001,600 | 88,833,600 |
| Size | 302.3 MB | 84.7 MB |
| Events in quadrant A | 2,720,106 | 603,370 |
| Events in quadrant B | 2,939,859 | 597,343 |
| Events in quadrant C | 2,556,647 | 599,898 |
| Events in quadrant D | 3,133,120 | 542,972 |
| Mode SS | |||
|---|---|---|---|
| Quadrant | BADHDUFLAG | Total packets | Discarded packets |
| A | 0 | 102 | 0 |
| B | 0 | 102 | 0 |
| C | 0 | 102 | 0 |
| D | 0 | 102 | 0 |
| Mode M0 | |||
|---|---|---|---|
| Quadrant | BADHDUFLAG | Total packets | Discarded packets |
| A | 0 | 11144 | 3 |
| B | 0 | 12180 | 2 |
| C | 0 | 10603 | 2 |
| D | 0 | 12844 | 2 |
| Mode M9 | |||
|---|---|---|---|
| Quadrant | BADHDUFLAG | Total packets | Discarded packets |
| A | 0 | 38 | 0 |
| B | 0 | 38 | 0 |
| C | 0 | 38 | 0 |
| D | 0 | 39 | 0 |
| Quadrant | Total seconds | Saturated seconds | Saturation percentage |
|---|---|---|---|
| A | 4936 | 11 | 0.222853% |
| B | 4936 | 239 | 4.841977% |
| C | 4936 | 64 | 1.296596% |
| D | 4936 | 122 | 2.471637% |
Noise dominated data is calculated using 1-second bins in cleaned event files. If a bin has >2000 counts, and if more than 50% of those come from <1% of pixels, then it is considered to be noise-dominated and hence unusable.
| Quadrant | # 1 sec bins | Bins with >0 counts | Bins with >2000 counts | High rate bins dominated by noise | Noise dominated (total time) | Noise dominated (detector-on time) | Marked lightcurve |
|---|---|---|---|---|---|---|---|
| A | 7088 | 4937 | 4 | 4 | 0.06% | 0.08% | 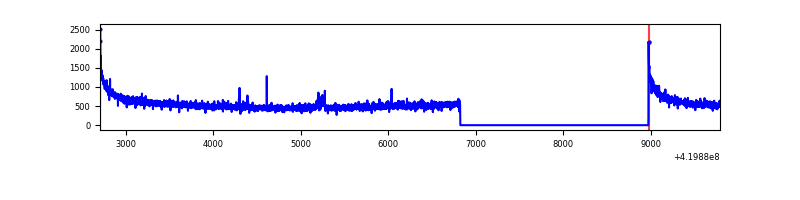 |
| B | 7088 | 4937 | 179 | 179 | 2.53% | 3.63% | 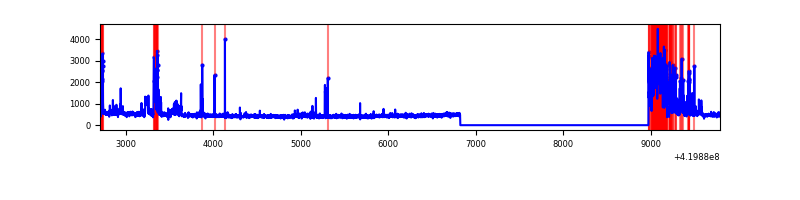 |
| C | 7088 | 4937 | 47 | 47 | 0.66% | 0.95% | 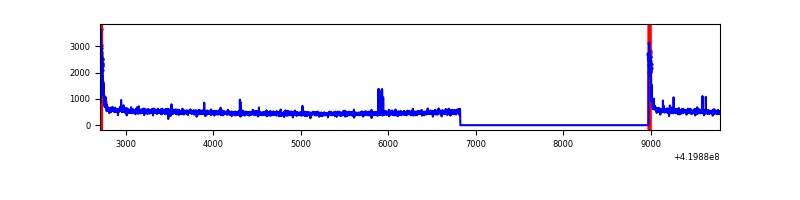 |
| D | 7088 | 4937 | 106 | 106 | 1.50% | 2.15% | 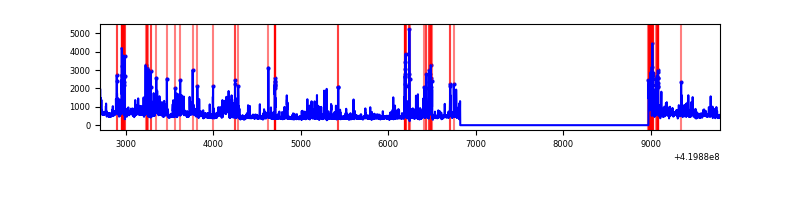 |
Top three noisy pixels from each quadrant. If the there are fewer than three noisy pixels in the level2.evt file, extra rows are filled as -1
| Pixel properties | Quadrant properties | ||||||
|---|---|---|---|---|---|---|---|
| Quadrant | DetID | PixID | Counts | Sigma | Mean | Median | Sigma |
| A | 10 | 83 | 510852 | 4499.04 | 555 | 544 | 113.4 |
| A | 12 | 189 | 32713 | 283.61 | 555 | 544 | 113.4 |
| A | 13 | 248 | 10035 | 83.68 | 555 | 544 | 113.4 |
| B | 5 | 32 | 695070 | 6647.28 | 549 | 536 | 104.5 |
| B | 5 | 255 | 30549 | 287.25 | 549 | 536 | 104.5 |
| B | 0 | 245 | 17572 | 163.05 | 549 | 536 | 104.5 |
| C | 15 | 214 | 208438 | 1624.69 | 554 | 560 | 127.9 |
| C | 0 | 10 | 159176 | 1239.68 | 554 | 560 | 127.9 |
| C | 14 | 83 | 15939 | 120.2 | 554 | 560 | 127.9 |
| D | 12 | 79 | 246228 | 1862.71 | 544 | 530 | 131.9 |
| D | 2 | 249 | 202491 | 1531.13 | 544 | 530 | 131.9 |
| D | 12 | 233 | 149236 | 1127.38 | 544 | 530 | 131.9 |
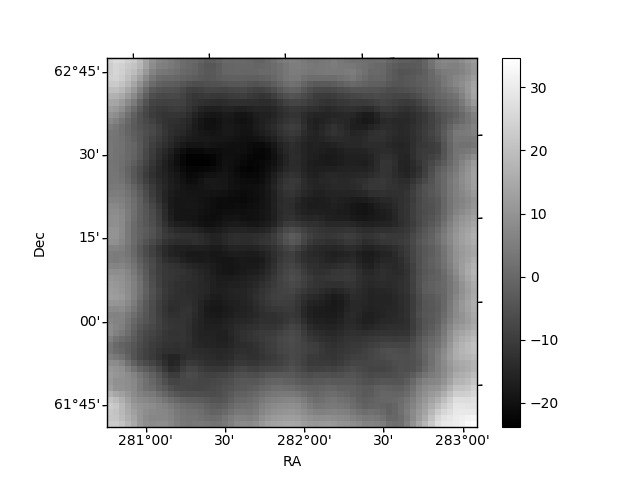
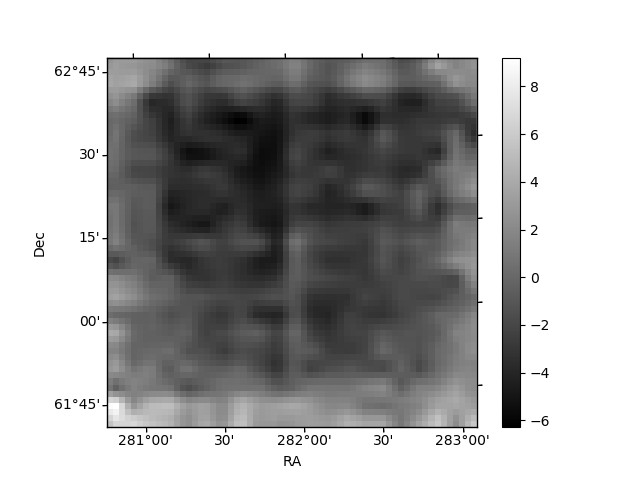
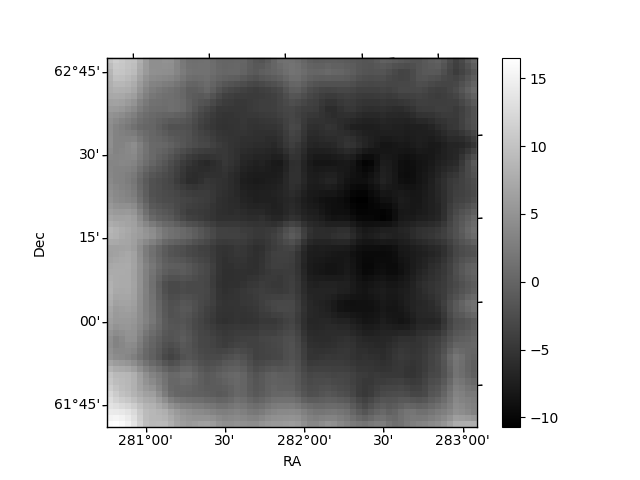
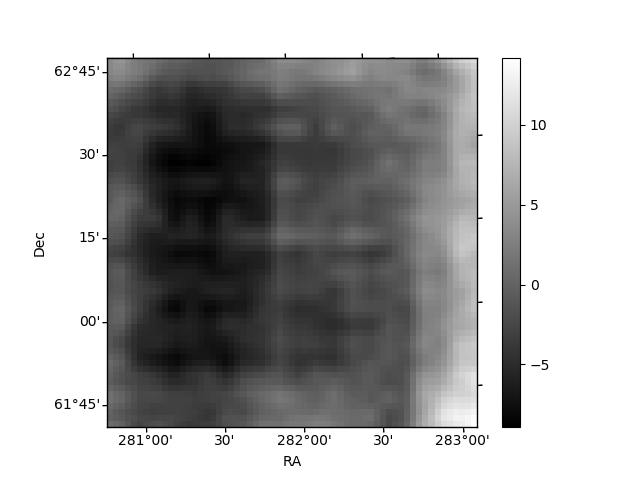
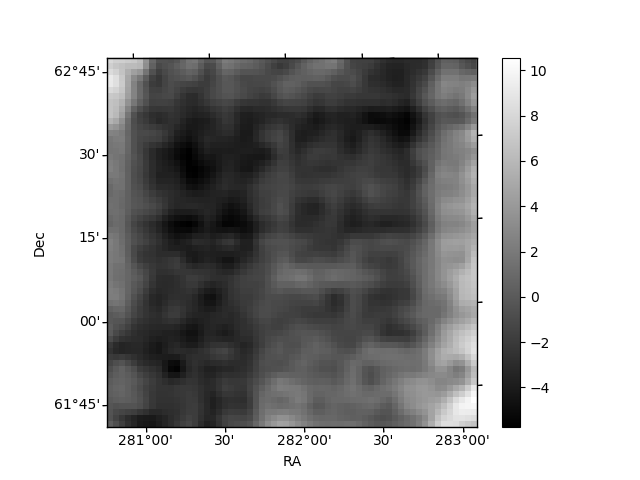
Histogram calculated using DETX and DETY for each event in the final _common_clean file
| Quadrant A | 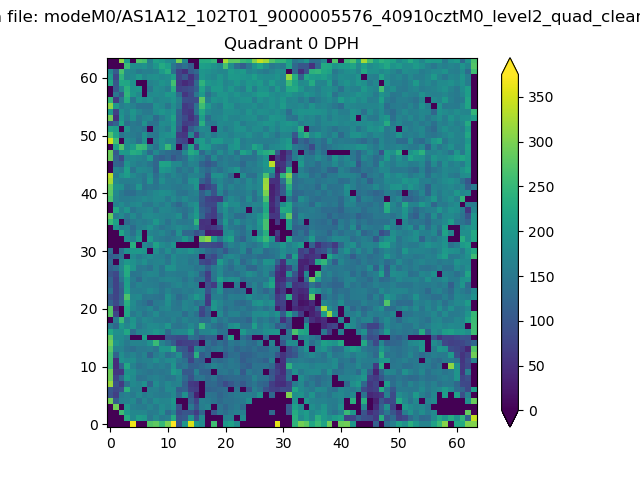 |
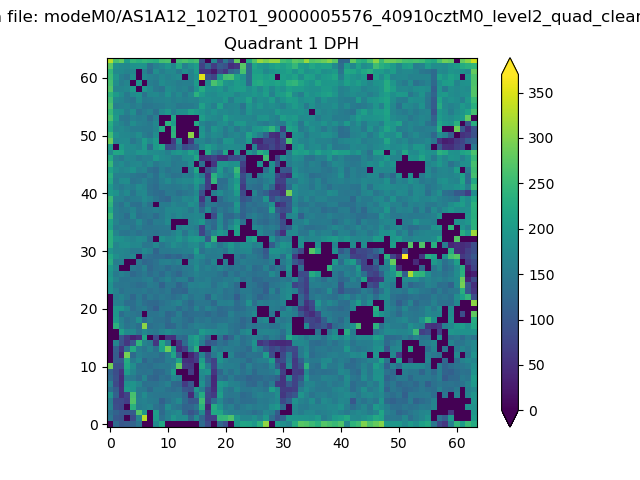 |
Quadrant B |
|---|---|---|---|
| Quadrant D | 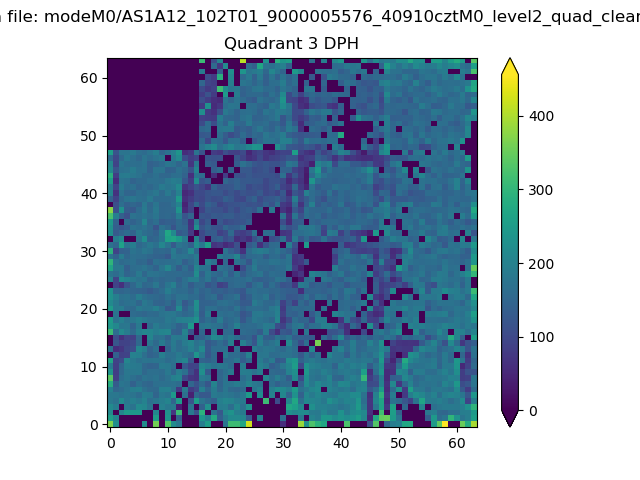 |
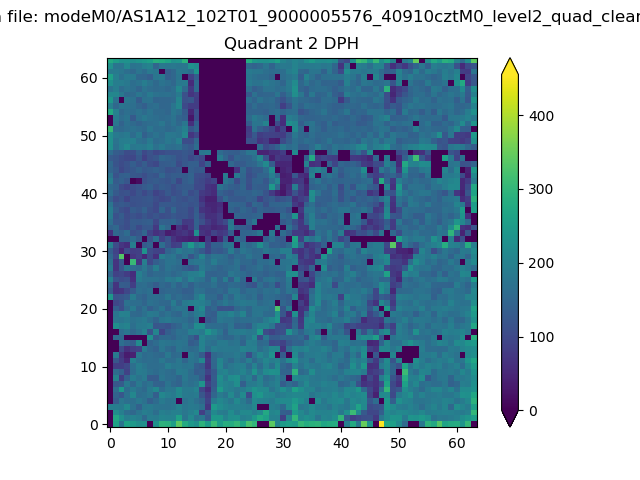 |
Quadrant C |
| Plot type | Count rate plots | Images |
|---|---|---|
| Comparison with Poisson distribution Blue bars denote a histogram of data divided into 1 sec bins. Red curve is a Poisson curve with rate = median count rate of data. |
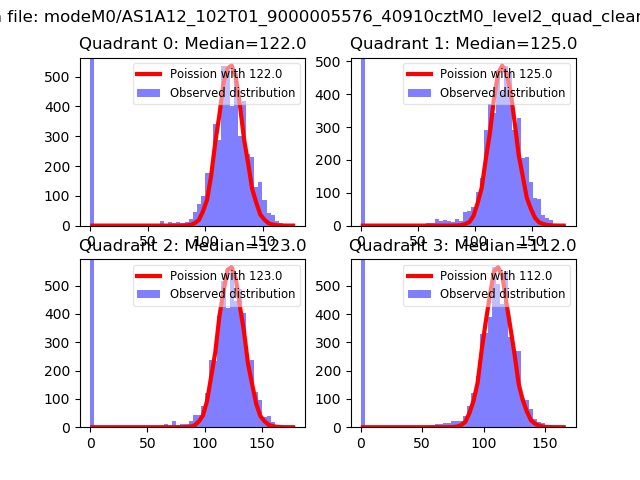 |
 |
| Quadrant-wise count rates Data is divided into 100 sec bins |
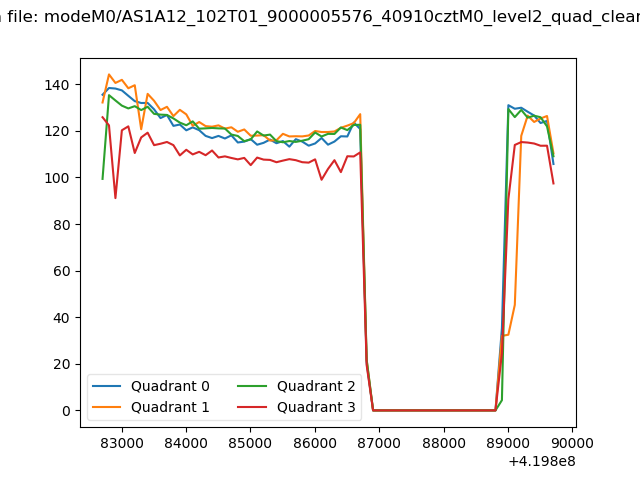 |
|
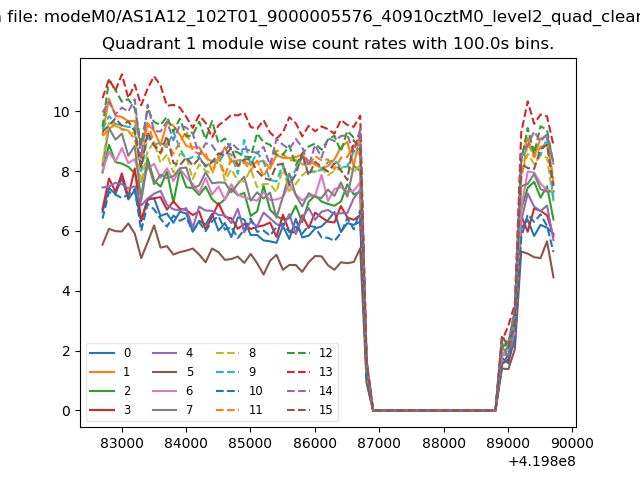
| Module-wise count rates for Quadrant A Data is divided into 100 sec bins |
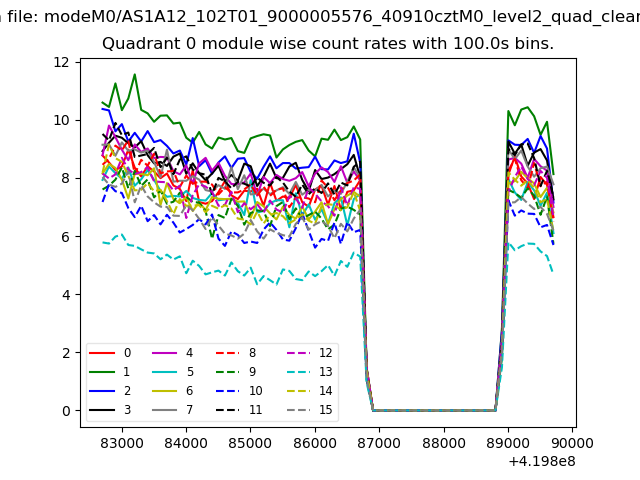 |
 |
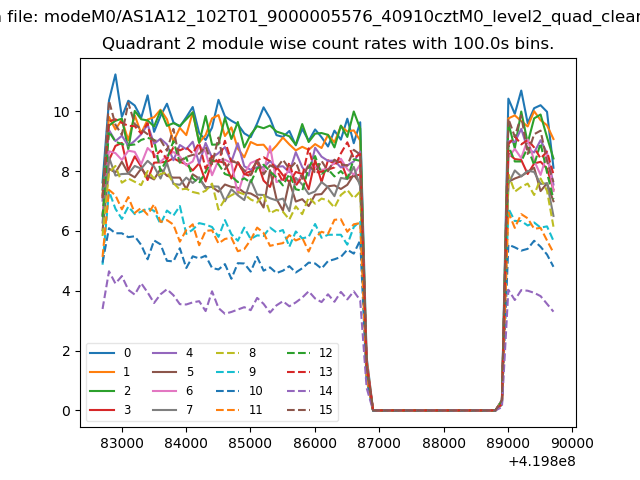
| Module-wise count rates for Quadrant B Data is divided into 100 sec bins |
 |
 |
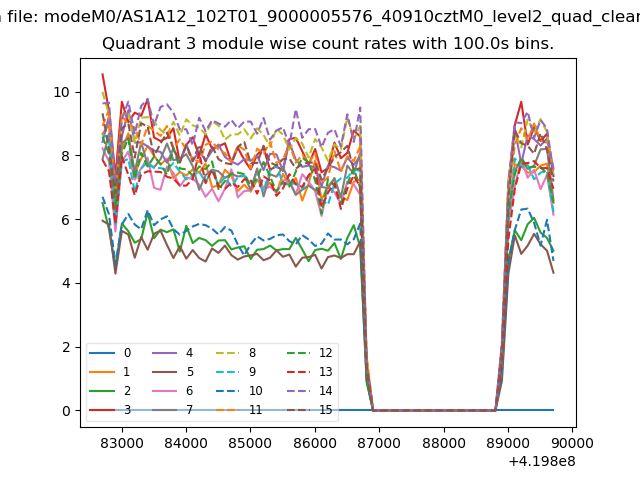
| Module-wise count rates for Quadrant C Data is divided into 100 sec bins |
 |
 |
| Module-wise count rates for Quadrant D Data is divided into 100 sec bins |
 |
 |
| Parameter | Plot |
|---|---|
| CZT HV Monitor | 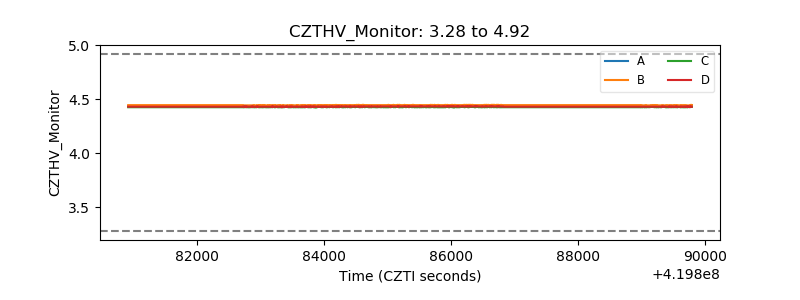 |
| D_VDD | 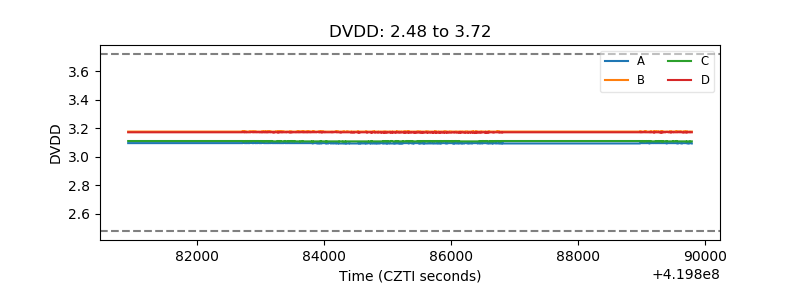 |
| Temperature 1 | 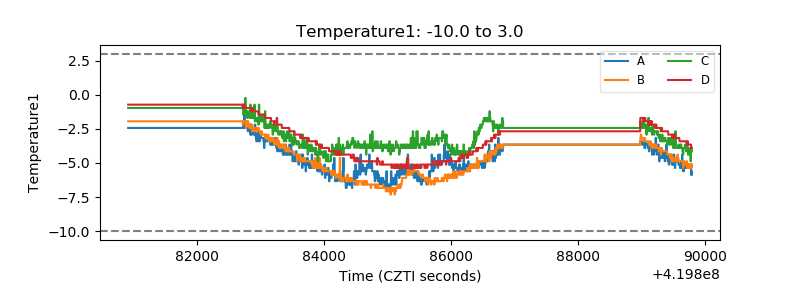 |
| Veto HV Monitor | 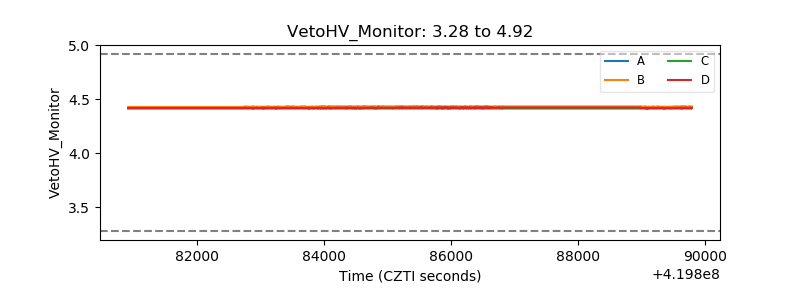 |
| Veto LLD | 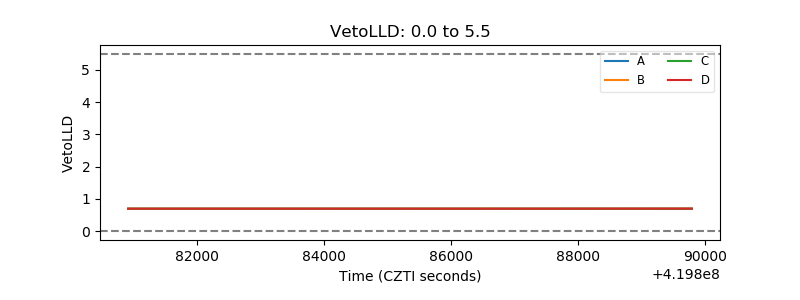 |
| Alpha Counter | 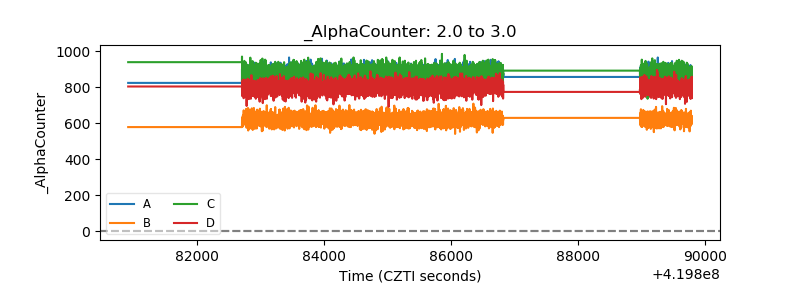 |
| _CPM_Rate | 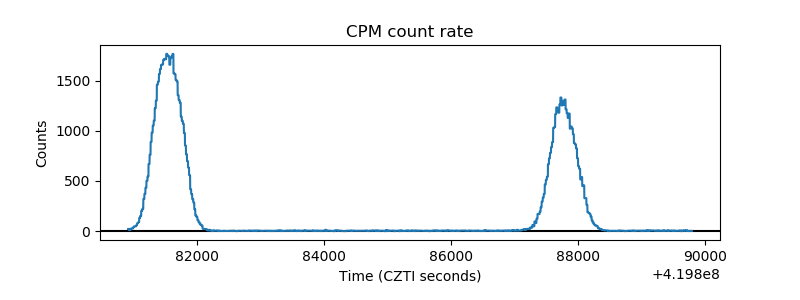 |
| CZT Counter | 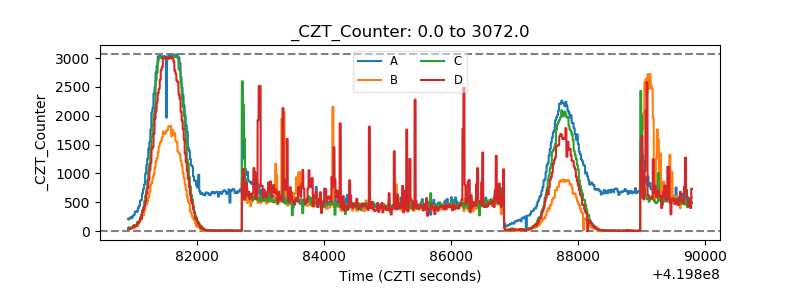 |
| +2.5 Volts monitor | 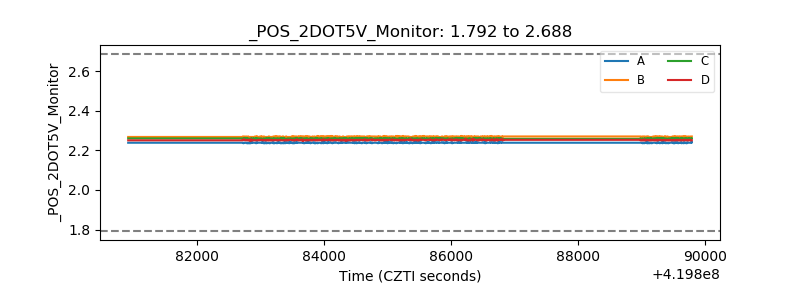 |
| +5 Volts monitor | 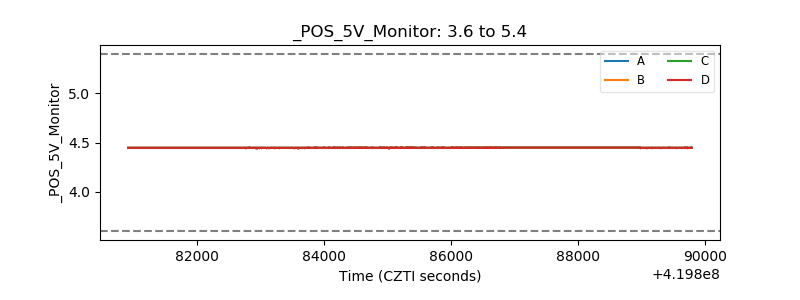 |
| _ROLL_ROT | 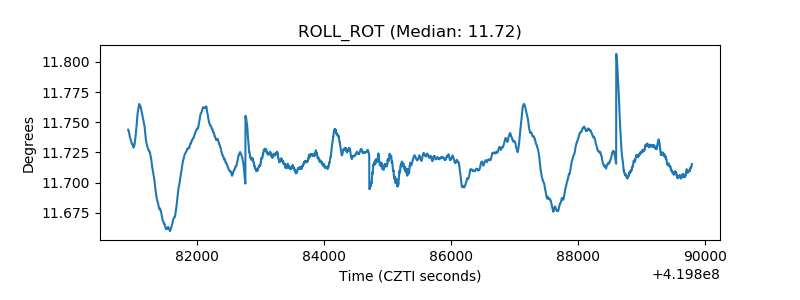 |
| _Roll_DEC | 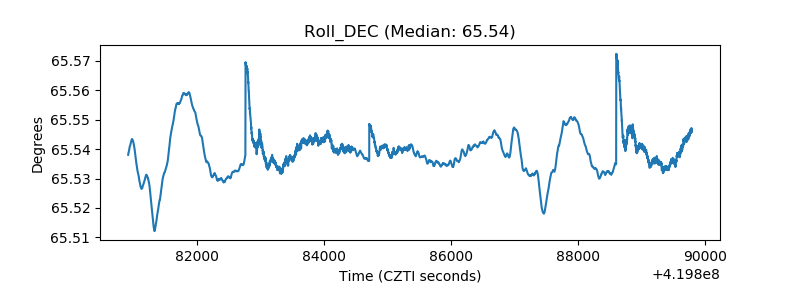 |
| _Roll_RA | 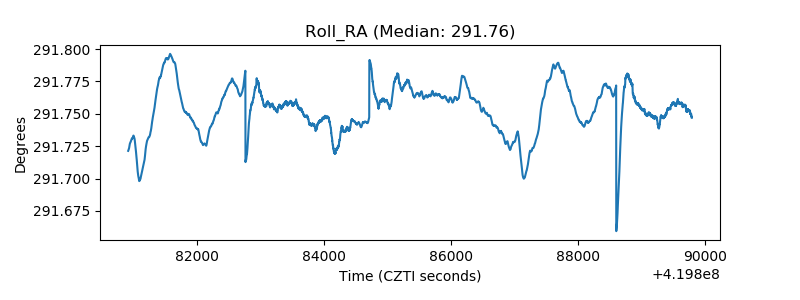 |
| Veto Counter | 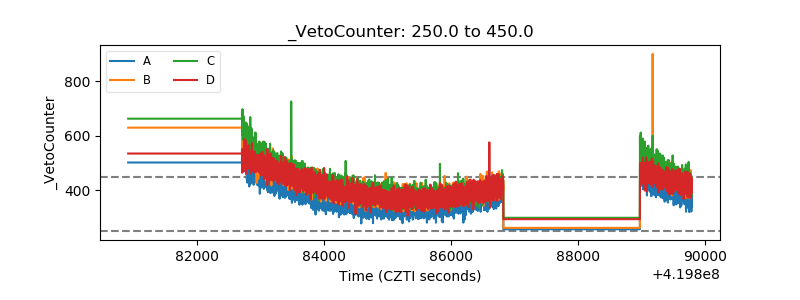 |