| Param | Original file | Final file |
|---|---|---|
| Filename | modeM0/AS1A12_102T01_9000005576_40911cztM0_level2.fits | modeM0/AS1A12_102T01_9000005576_40911cztM0_level2_quad_clean.evt |
| Size (bytes) | 293,126,400 | 79,796,160 |
| Size | 279.5 MB | 76.1 MB |
| Events in quadrant A | 2,469,791 | 538,092 |
| Events in quadrant B | 2,765,539 | 529,875 |
| Events in quadrant C | 2,330,809 | 537,997 |
| Events in quadrant D | 2,924,374 | 486,321 |
| Mode SS | |||
|---|---|---|---|
| Quadrant | BADHDUFLAG | Total packets | Discarded packets |
| A | 0 | 94 | 0 |
| B | 0 | 94 | 0 |
| C | 0 | 94 | 0 |
| D | 0 | 94 | 0 |
| Mode M0 | |||
|---|---|---|---|
| Quadrant | BADHDUFLAG | Total packets | Discarded packets |
| A | 0 | 10280 | 2 |
| B | 0 | 11520 | 2 |
| C | 0 | 9878 | 2 |
| D | 0 | 11910 | 2 |
| Mode M9 | |||
|---|---|---|---|
| Quadrant | BADHDUFLAG | Total packets | Discarded packets |
| A | 0 | 29 | 0 |
| B | 0 | 29 | 0 |
| C | 0 | 29 | 0 |
| D | 0 | 30 | 0 |
| Quadrant | Total seconds | Saturated seconds | Saturation percentage |
|---|---|---|---|
| A | 4613 | 12 | 0.260134% |
| B | 4613 | 247 | 5.354433% |
| C | 4613 | 63 | 1.365706% |
| D | 4613 | 158 | 3.425103% |
Noise dominated data is calculated using 1-second bins in cleaned event files. If a bin has >2000 counts, and if more than 50% of those come from <1% of pixels, then it is considered to be noise-dominated and hence unusable.
| Quadrant | # 1 sec bins | Bins with >0 counts | Bins with >2000 counts | High rate bins dominated by noise | Noise dominated (total time) | Noise dominated (detector-on time) | Marked lightcurve |
|---|---|---|---|---|---|---|---|
| A | 6764 | 4614 | 5 | 5 | 0.07% | 0.11% | 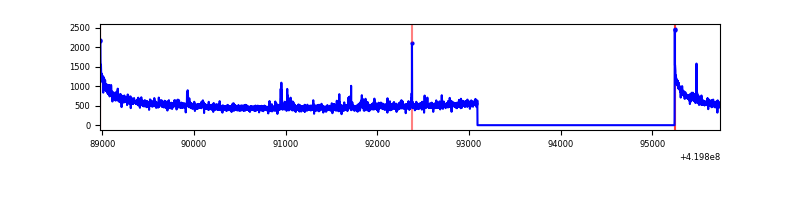 |
| B | 6764 | 4614 | 196 | 196 | 2.90% | 4.25% | 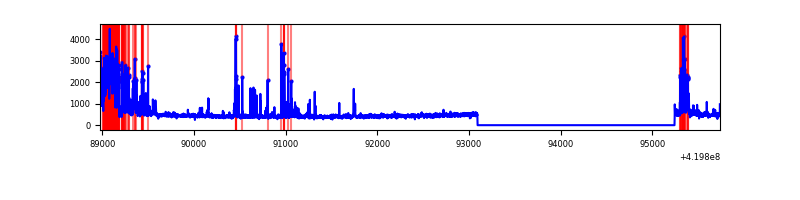 |
| C | 6764 | 4614 | 50 | 50 | 0.74% | 1.08% | 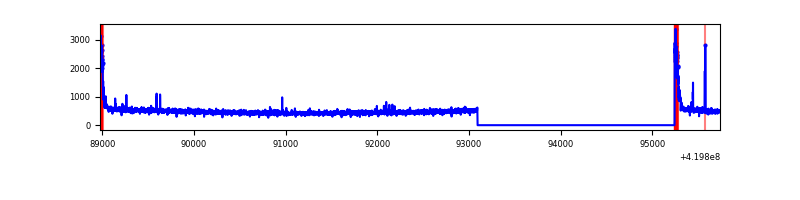 |
| D | 6764 | 4614 | 126 | 126 | 1.86% | 2.73% | 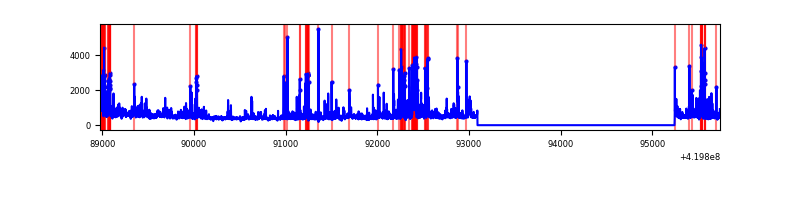 |
Top three noisy pixels from each quadrant. If the there are fewer than three noisy pixels in the level2.evt file, extra rows are filled as -1
| Pixel properties | Quadrant properties | ||||||
|---|---|---|---|---|---|---|---|
| Quadrant | DetID | PixID | Counts | Sigma | Mean | Median | Sigma |
| A | 10 | 83 | 466076 | 4611.35 | 498 | 490 | 101.0 |
| A | 12 | 189 | 25294 | 245.67 | 498 | 490 | 101.0 |
| A | 7 | 3 | 15738 | 151.02 | 498 | 490 | 101.0 |
| B | 5 | 32 | 662905 | 6984.02 | 492 | 478 | 94.8 |
| B | 5 | 255 | 111483 | 1170.33 | 492 | 478 | 94.8 |
| B | 0 | 190 | 28455 | 294.96 | 492 | 478 | 94.8 |
| C | 15 | 214 | 196158 | 1700.07 | 498 | 502 | 115.1 |
| C | 0 | 10 | 162182 | 1404.85 | 498 | 502 | 115.1 |
| C | 14 | 254 | 24472 | 208.28 | 498 | 502 | 115.1 |
| D | 12 | 233 | 311173 | 2656.89 | 486 | 474 | 116.9 |
| D | 13 | 249 | 234603 | 2002.11 | 486 | 474 | 116.9 |
| D | 12 | 79 | 150937 | 1286.66 | 486 | 474 | 116.9 |
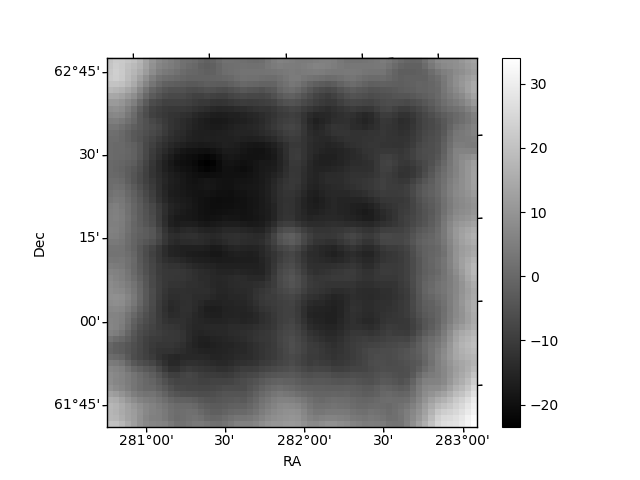
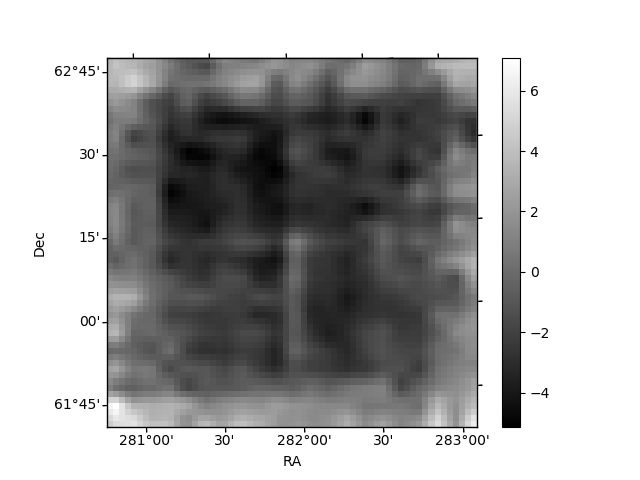
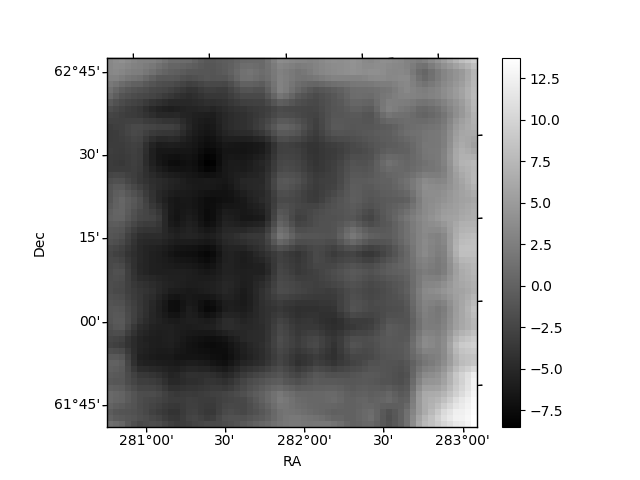
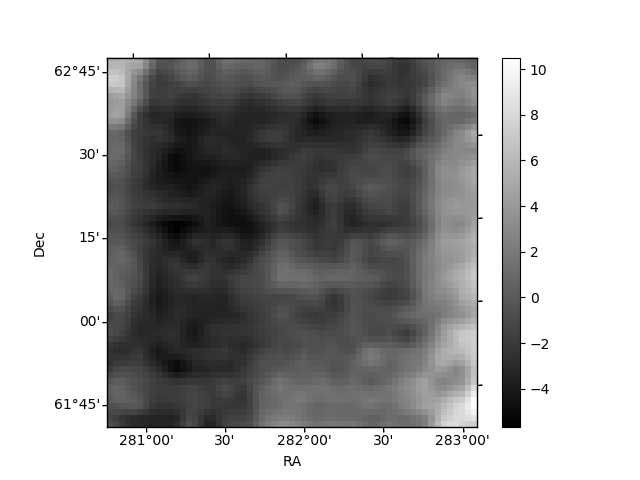
Histogram calculated using DETX and DETY for each event in the final _common_clean file
| Quadrant A | 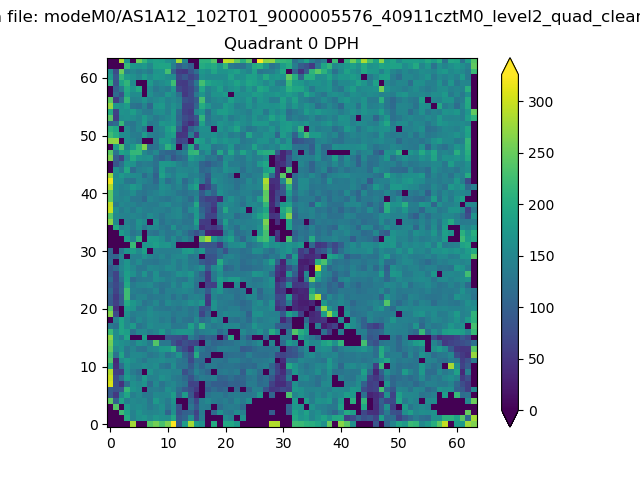 |
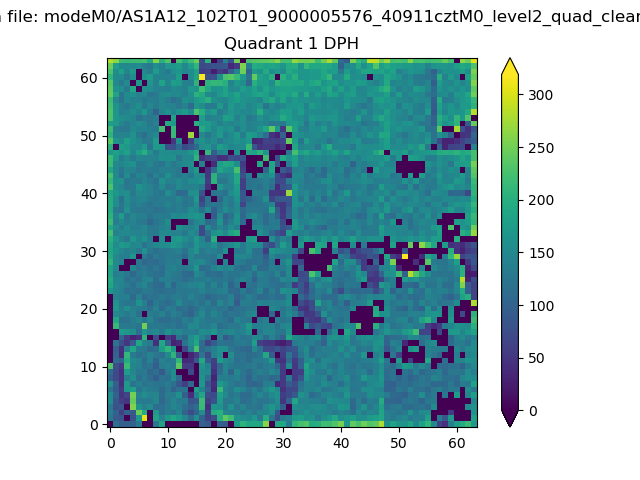 |
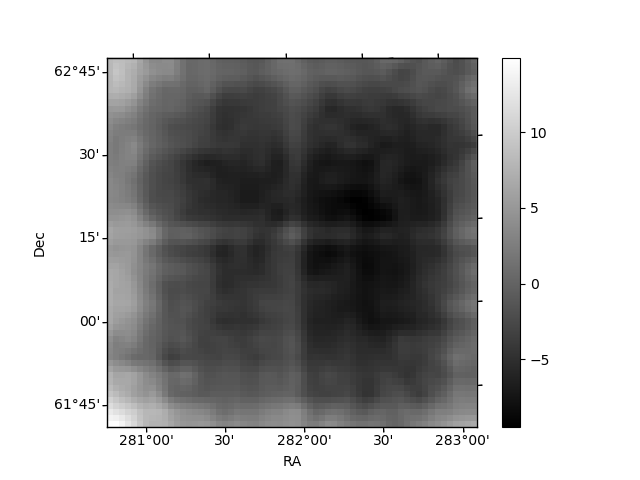
Quadrant B |
|---|---|---|---|
| Quadrant D | 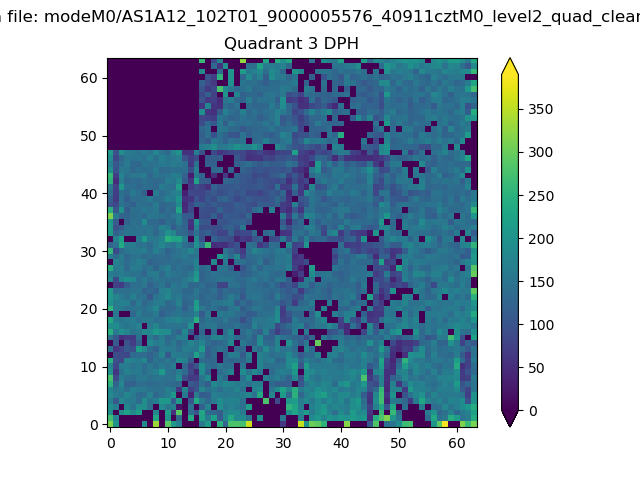 |
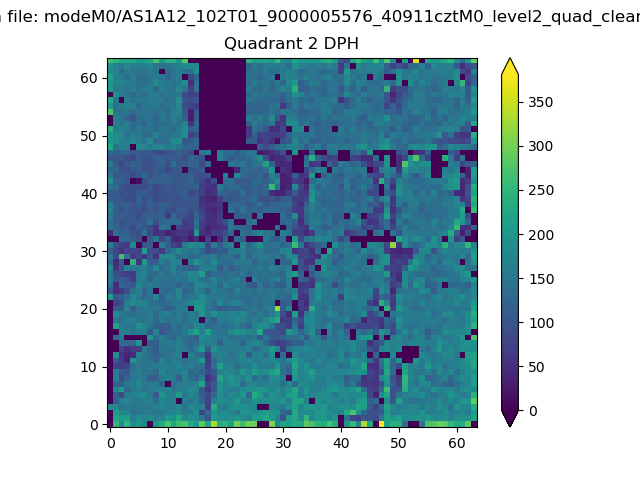 |
Quadrant C |
| Plot type | Count rate plots | Images |
|---|---|---|
| Comparison with Poisson distribution Blue bars denote a histogram of data divided into 1 sec bins. Red curve is a Poisson curve with rate = median count rate of data. |
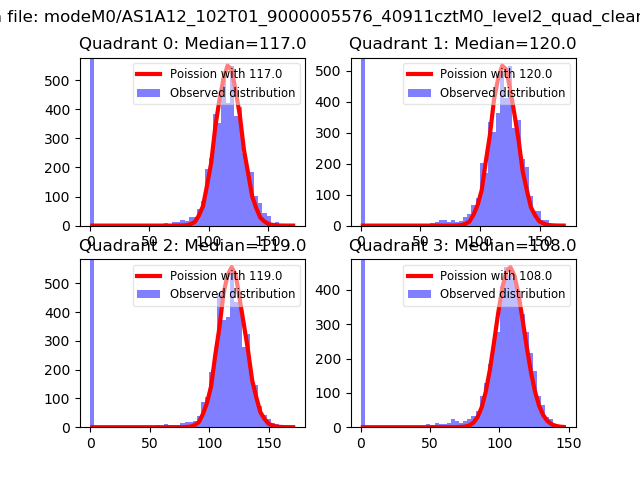 |
 |
| Quadrant-wise count rates Data is divided into 100 sec bins |
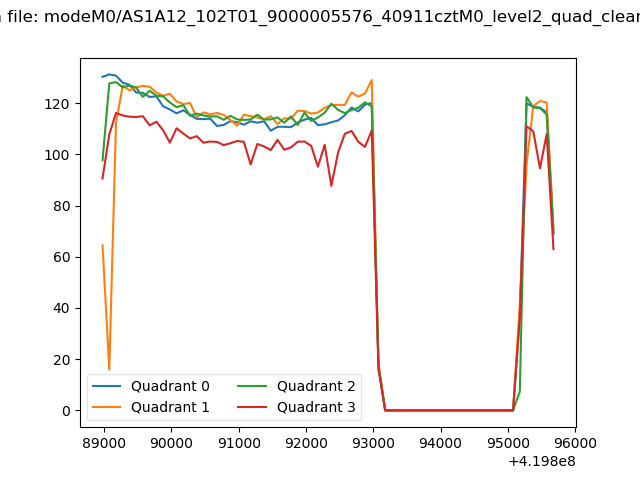 |
|
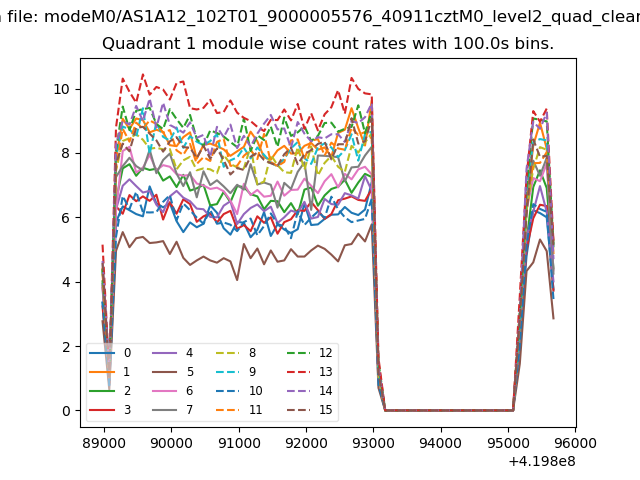
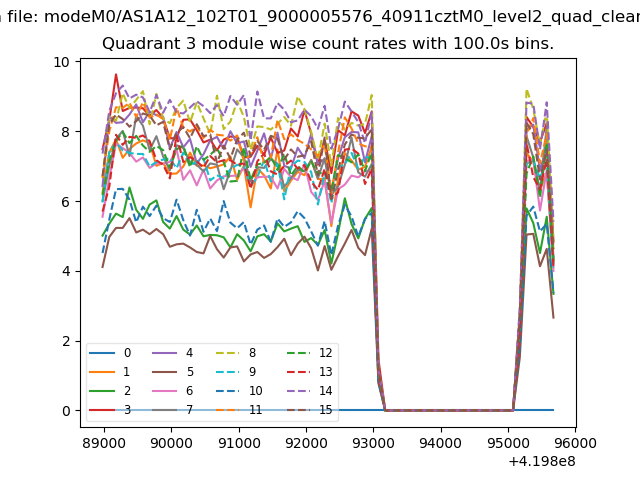
| Module-wise count rates for Quadrant A Data is divided into 100 sec bins |
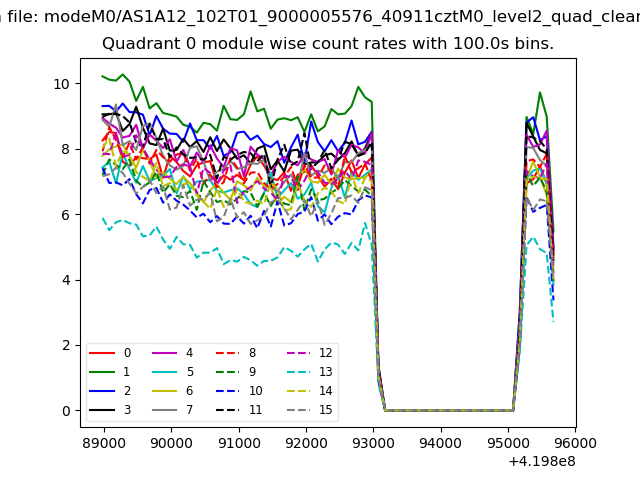 |
 |
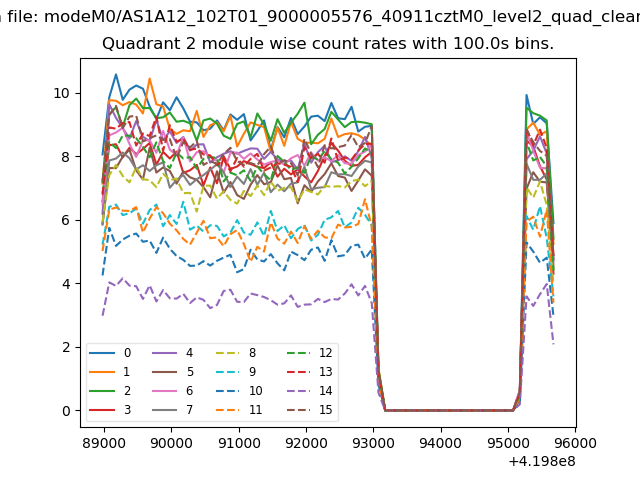
| Module-wise count rates for Quadrant B Data is divided into 100 sec bins |
 |
 |
| Module-wise count rates for Quadrant C Data is divided into 100 sec bins |
 |
 |
| Module-wise count rates for Quadrant D Data is divided into 100 sec bins |
 |
 |
| Parameter | Plot |
|---|---|
| CZT HV Monitor | 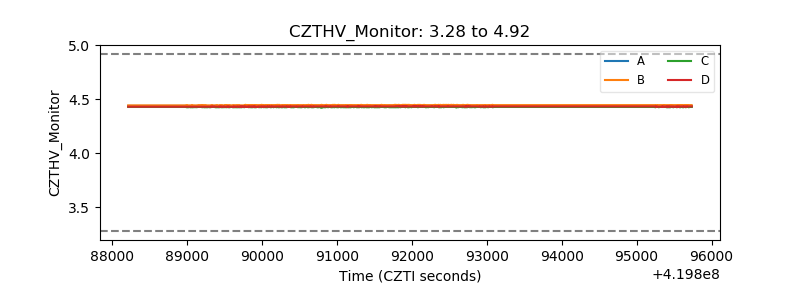 |
| D_VDD | 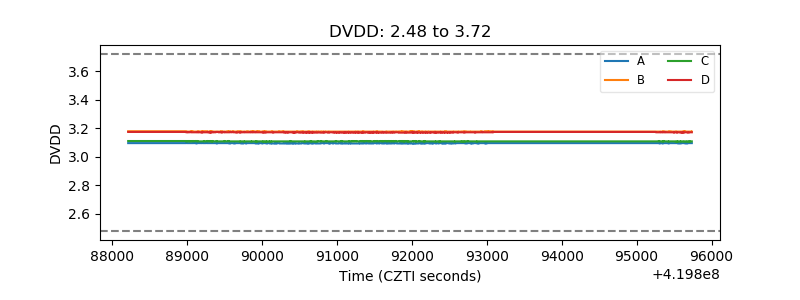 |
| Temperature 1 | 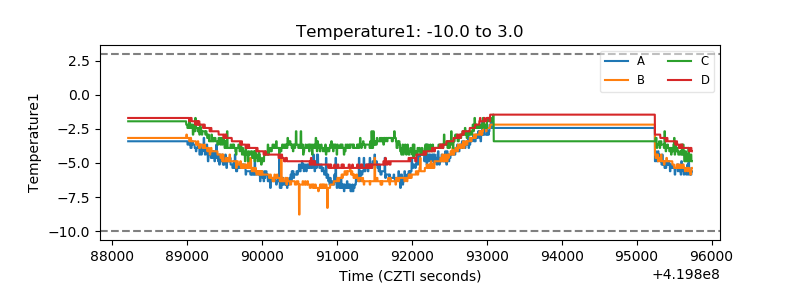 |
| Veto HV Monitor | 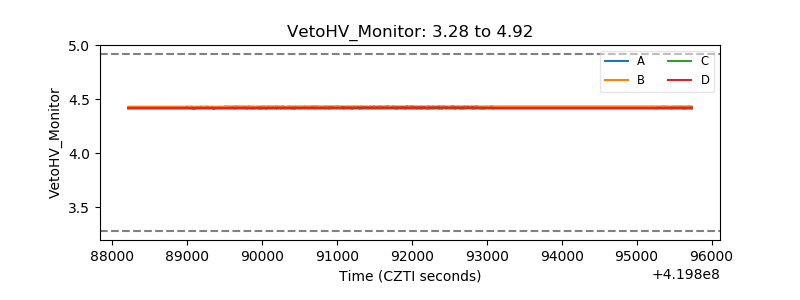 |
| Veto LLD | 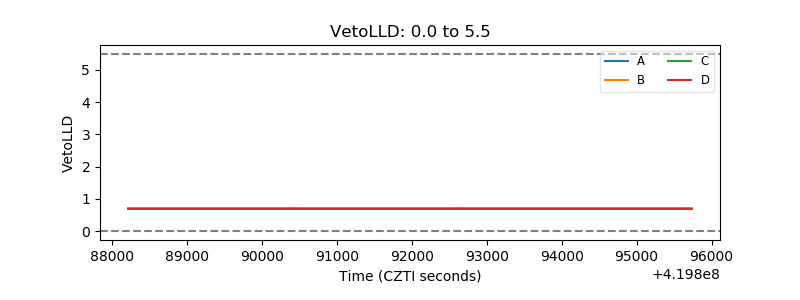 |
| Alpha Counter |  |
| _CPM_Rate | 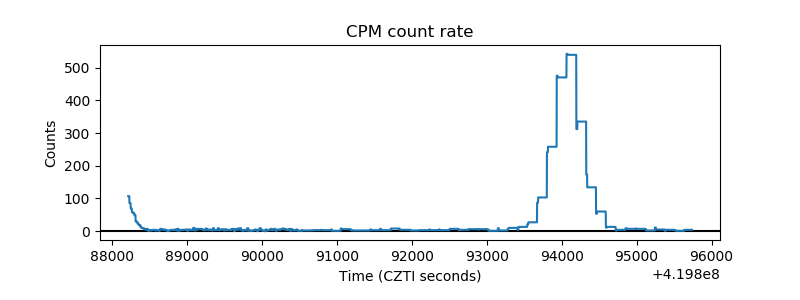 |
| CZT Counter | 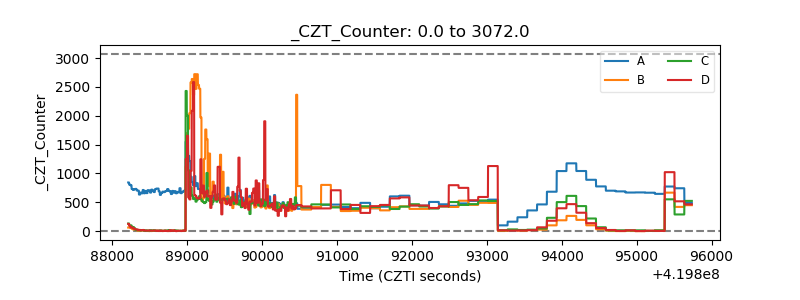 |
| +2.5 Volts monitor |  |
| +5 Volts monitor | 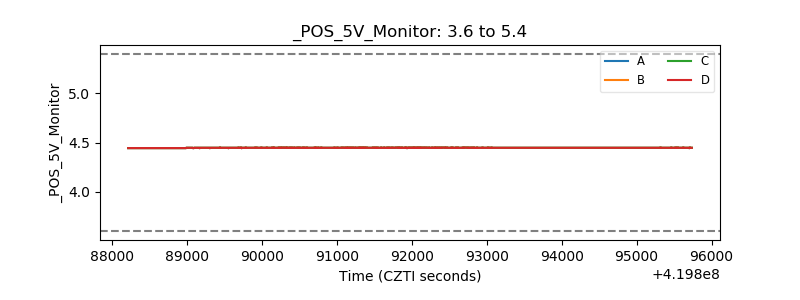 |
| _ROLL_ROT | 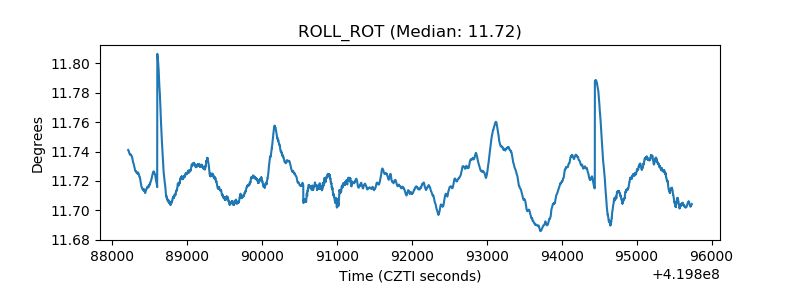 |
| _Roll_DEC | 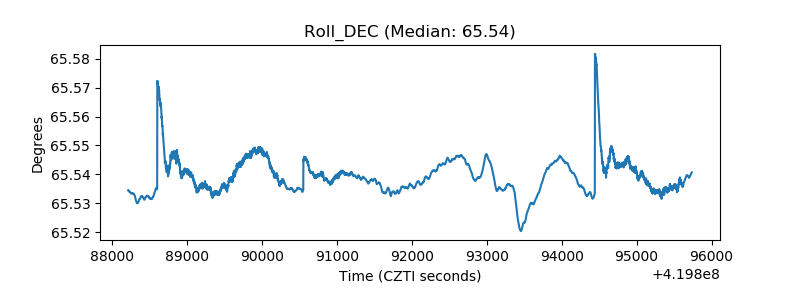 |
| _Roll_RA | 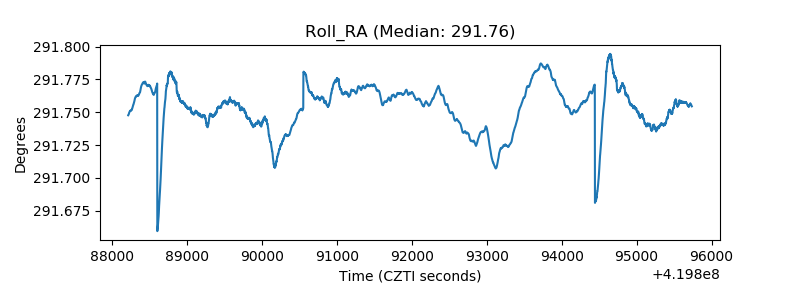 |
| Veto Counter | 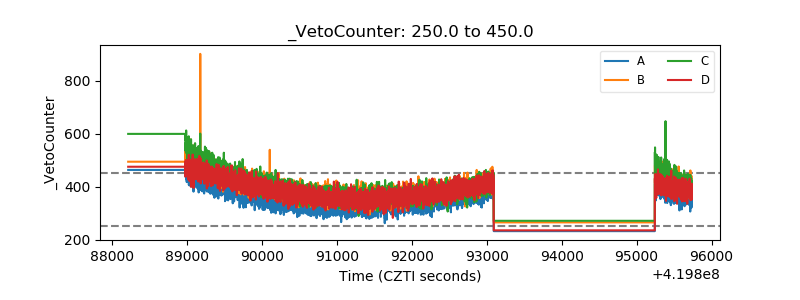 |