| Param | Original file | Final file |
|---|---|---|
| Filename | modeM0/AS1A12_102T01_9000005576_40912cztM0_level2.fits | modeM0/AS1A12_102T01_9000005576_40912cztM0_level2_quad_clean.evt |
| Size (bytes) | 38,695,680 | 8,740,800 |
| Size | 36.9 MB | 8.3 MB |
| Events in quadrant A | 353,173 | 58,041 |
| Events in quadrant B | 354,027 | 56,936 |
| Events in quadrant C | 345,318 | 55,112 |
| Events in quadrant D | 337,837 | 52,417 |
| Mode SS | |||
|---|---|---|---|
| Quadrant | BADHDUFLAG | Total packets | Discarded packets |
| A | 0 | 10 | 0 |
| B | 0 | 10 | 0 |
| C | 0 | 10 | 0 |
| D | 0 | 10 | 0 |
| Mode M0 | |||
|---|---|---|---|
| Quadrant | BADHDUFLAG | Total packets | Discarded packets |
| A | 0 | 1389 | 1 |
| B | 0 | 1374 | 1 |
| C | 0 | 1313 | 1 |
| D | 0 | 1327 | 1 |
| Mode M9 | |||
|---|---|---|---|
| Quadrant | BADHDUFLAG | Total packets | Discarded packets |
| A | 0 | 17 | 0 |
| B | 0 | 17 | 0 |
| C | 0 | 17 | 0 |
| D | 0 | 18 | 0 |
| Quadrant | Total seconds | Saturated seconds | Saturation percentage |
|---|---|---|---|
| A | 495 | 5 | 1.010101% |
| B | 495 | 35 | 7.070707% |
| C | 495 | 32 | 6.464646% |
| D | 495 | 25 | 5.050505% |
Noise dominated data is calculated using 1-second bins in cleaned event files. If a bin has >2000 counts, and if more than 50% of those come from <1% of pixels, then it is considered to be noise-dominated and hence unusable.
| Quadrant | # 1 sec bins | Bins with >0 counts | Bins with >2000 counts | High rate bins dominated by noise | Noise dominated (total time) | Noise dominated (detector-on time) | Marked lightcurve |
|---|---|---|---|---|---|---|---|
| A | 495 | 495 | 2 | 2 | 0.40% | 0.40% | 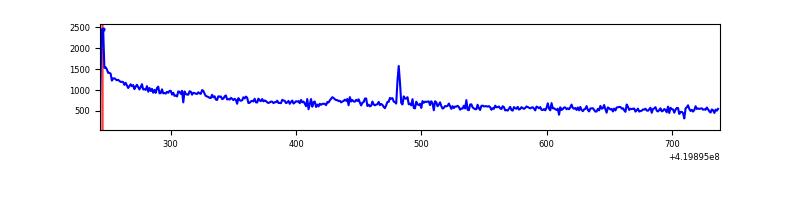 |
| B | 495 | 495 | 27 | 27 | 5.45% | 5.45% | 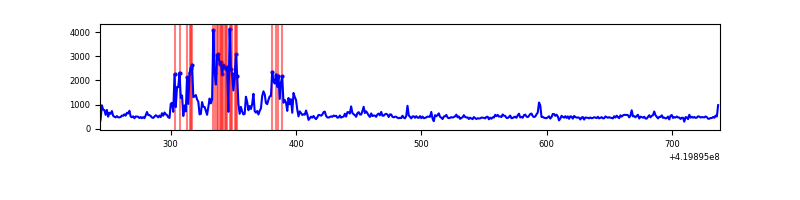 |
| C | 495 | 495 | 26 | 26 | 5.25% | 5.25% | 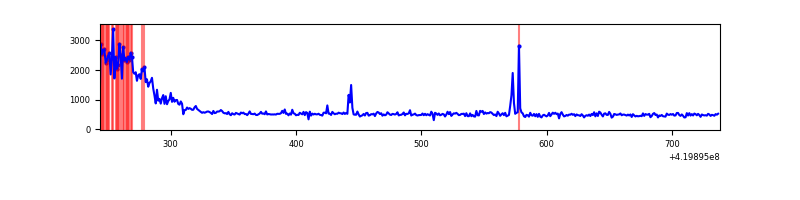 |
| D | 495 | 495 | 17 | 17 | 3.43% | 3.43% | 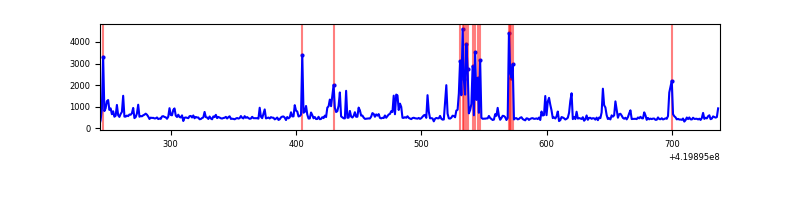 |
Top three noisy pixels from each quadrant. If the there are fewer than three noisy pixels in the level2.evt file, extra rows are filled as -1
| Pixel properties | Quadrant properties | ||||||
|---|---|---|---|---|---|---|---|
| Quadrant | DetID | PixID | Counts | Sigma | Mean | Median | Sigma |
| A | 10 | 83 | 121429 | 9036.34 | 55 | 54 | 13.4 |
| A | 12 | 189 | 6818 | 503.58 | 55 | 54 | 13.4 |
| A | 5 | 168 | 3845 | 282.24 | 55 | 54 | 13.4 |
| B | 5 | 32 | 113172 | 8731.07 | 55 | 53 | 13.0 |
| B | 0 | 190 | 12619 | 969.9 | 55 | 53 | 13.0 |
| B | 0 | 229 | 5710 | 436.63 | 55 | 53 | 13.0 |
| C | 0 | 10 | 87052 | 5845.52 | 56 | 56 | 14.9 |
| C | 15 | 214 | 25280 | 1694.87 | 56 | 56 | 14.9 |
| C | 14 | 254 | 13473 | 901.53 | 56 | 56 | 14.9 |
| D | 13 | 249 | 61732 | 3997.11 | 55 | 53 | 15.4 |
| D | 1 | 52 | 17597 | 1136.94 | 55 | 53 | 15.4 |
| D | 12 | 233 | 16033 | 1035.58 | 55 | 53 | 15.4 |
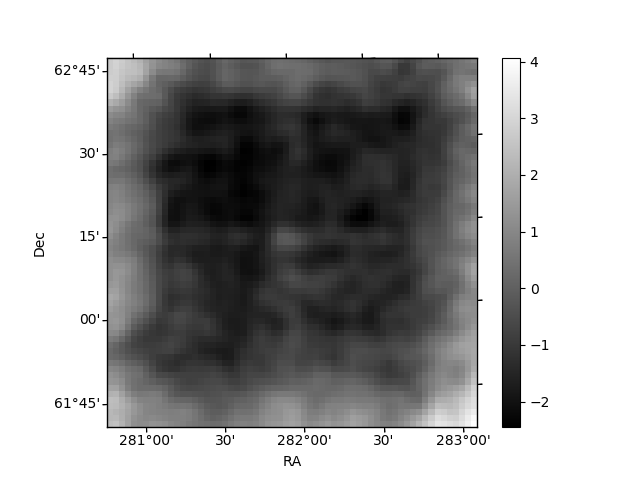
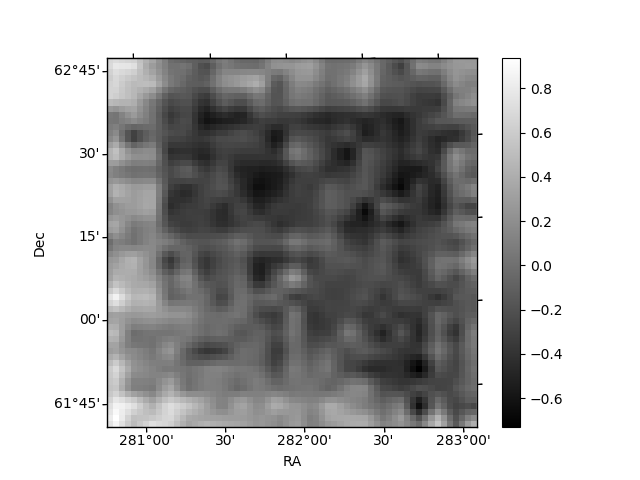
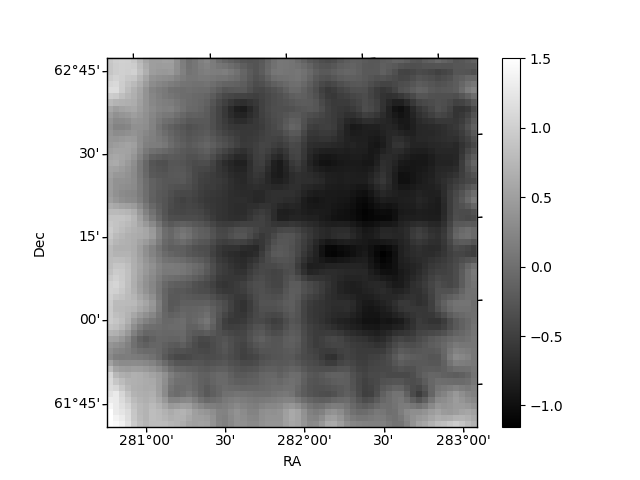
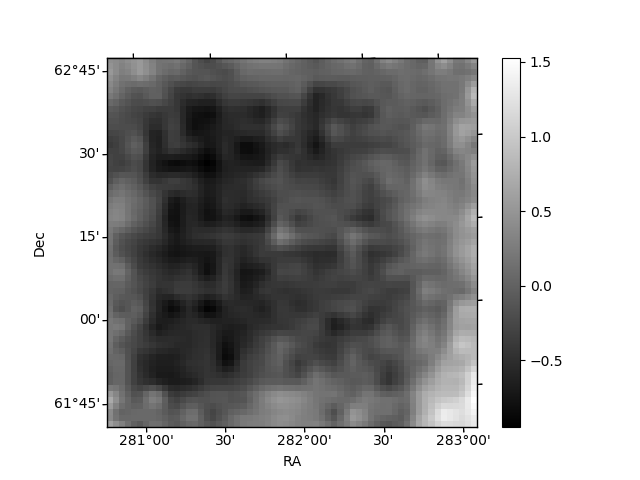
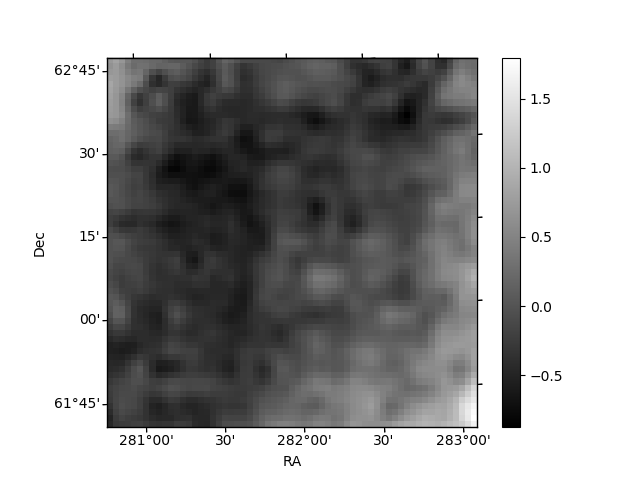
Histogram calculated using DETX and DETY for each event in the final _common_clean file
| Quadrant A | 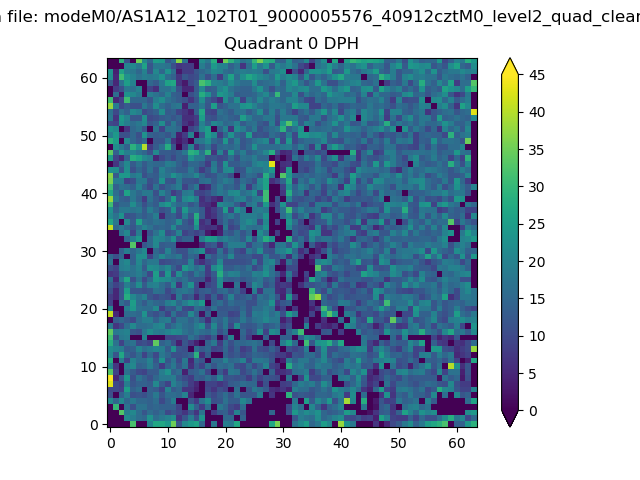 |
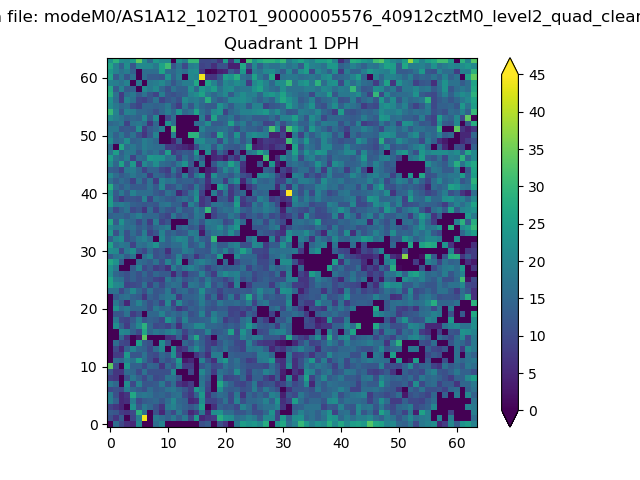 |
Quadrant B |
|---|---|---|---|
| Quadrant D | 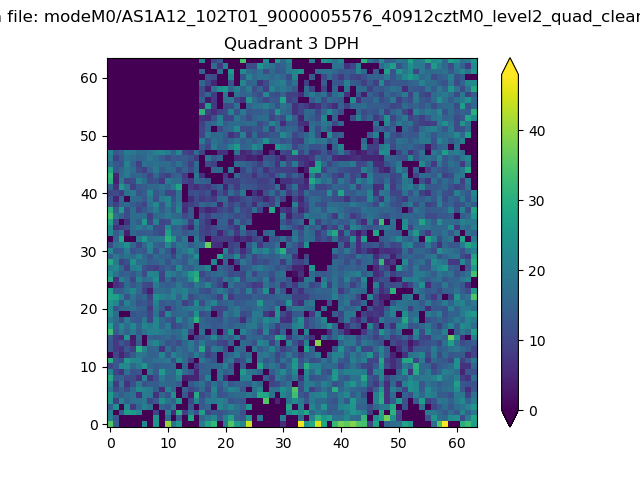 |
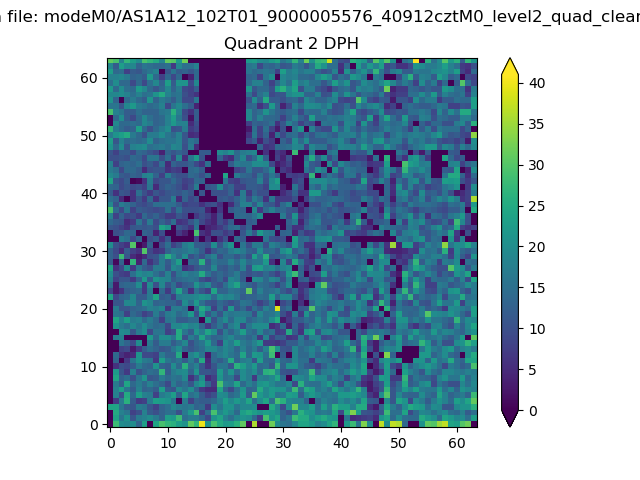 |
Quadrant C |
| Plot type | Count rate plots | Images |
|---|---|---|
| Comparison with Poisson distribution Blue bars denote a histogram of data divided into 1 sec bins. Red curve is a Poisson curve with rate = median count rate of data. |
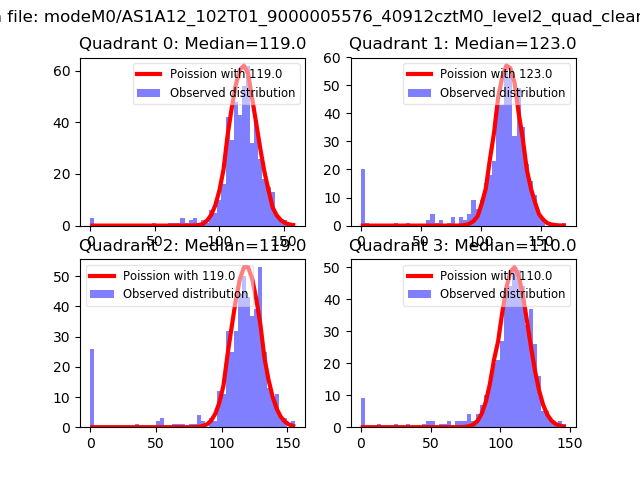 |
 |
| Quadrant-wise count rates Data is divided into 100 sec bins |
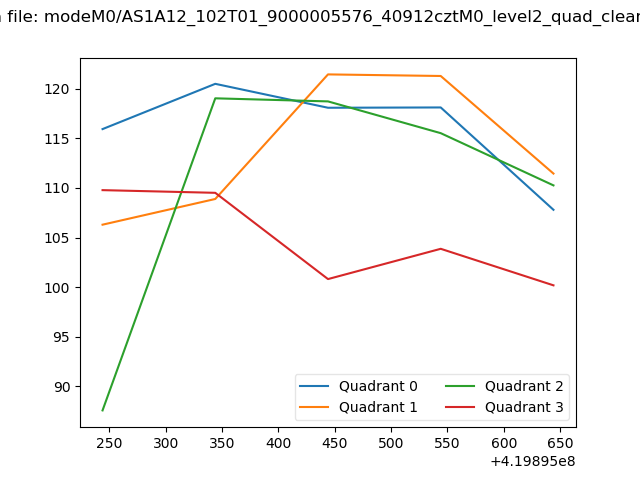 |
|
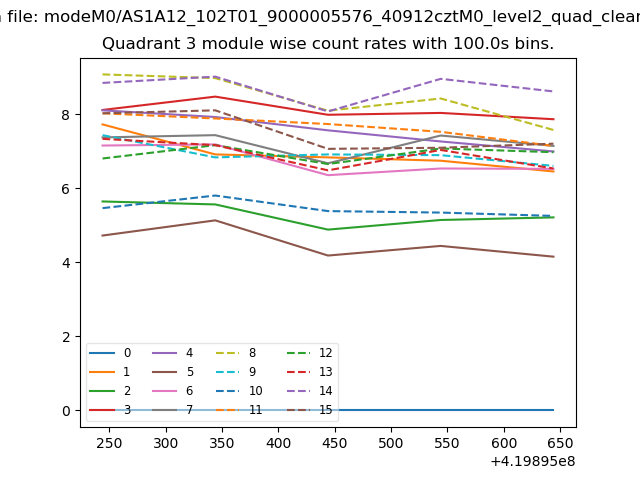
| Module-wise count rates for Quadrant A Data is divided into 100 sec bins |
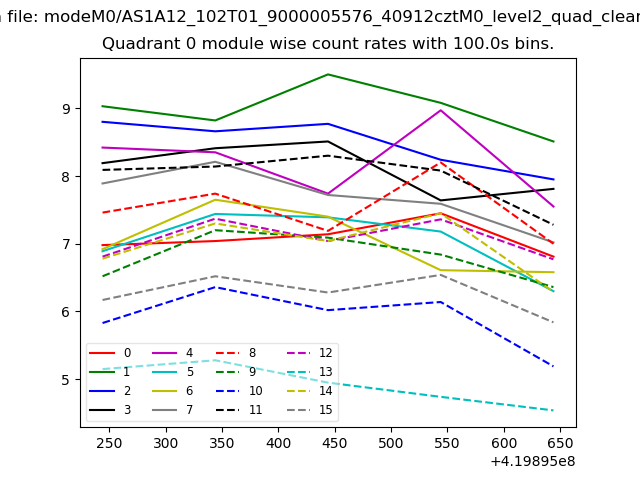 |
 |
| Module-wise count rates for Quadrant B Data is divided into 100 sec bins |
 |
 |
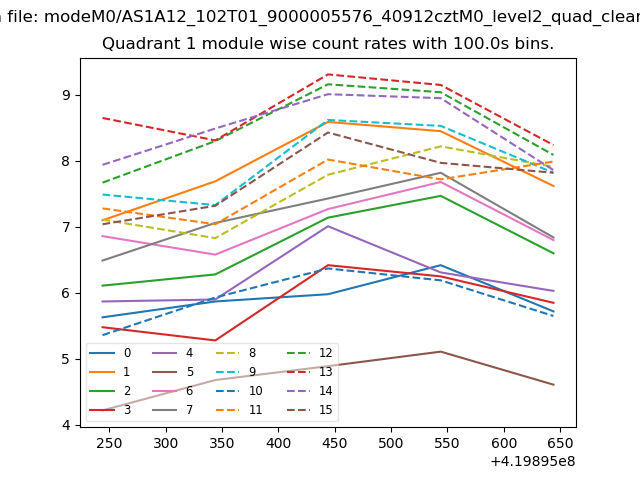
| Module-wise count rates for Quadrant C Data is divided into 100 sec bins |
 |
 |
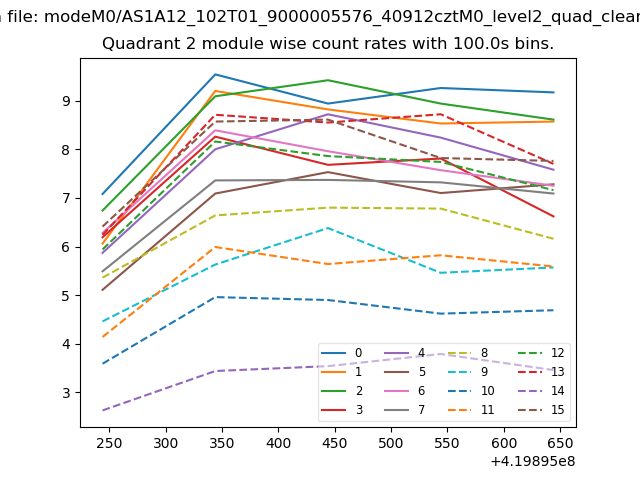
| Module-wise count rates for Quadrant D Data is divided into 100 sec bins |
 |
 |
| Parameter | Plot |
|---|---|
| CZT HV Monitor | 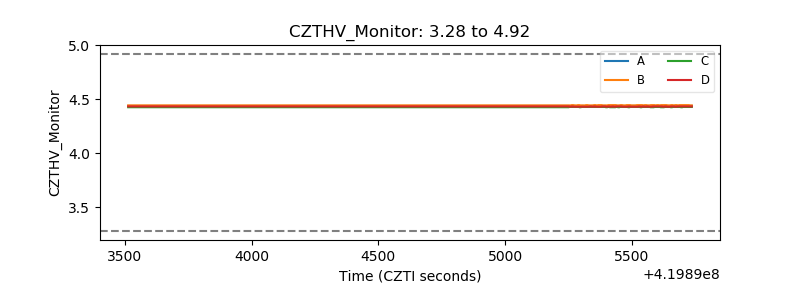 |
| D_VDD | 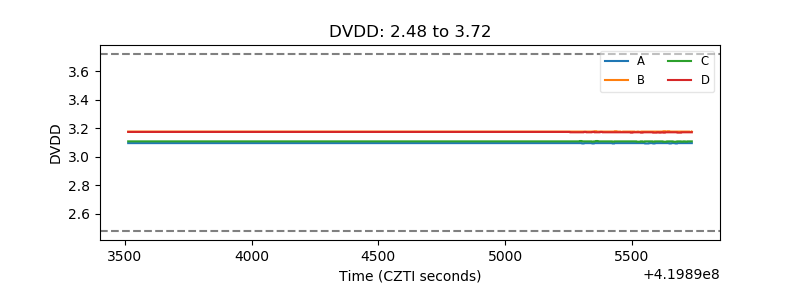 |
| Temperature 1 | 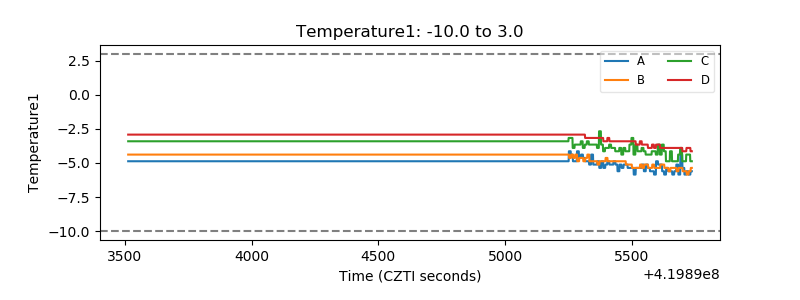 |
| Veto HV Monitor | 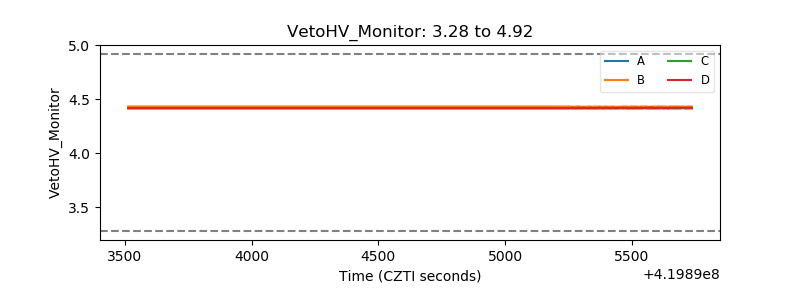 |
| Veto LLD | 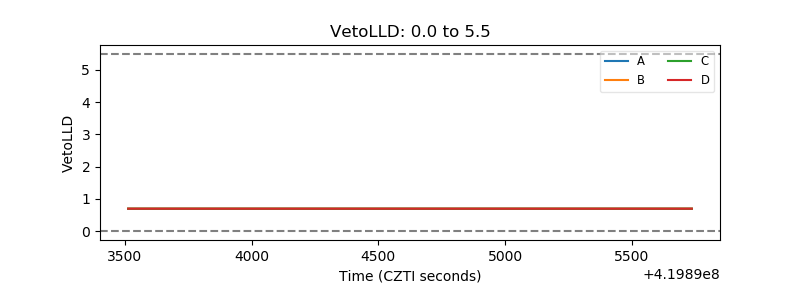 |
| Alpha Counter | 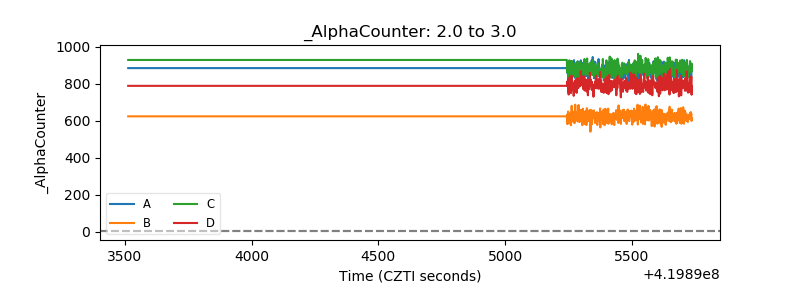 |
| _CPM_Rate | 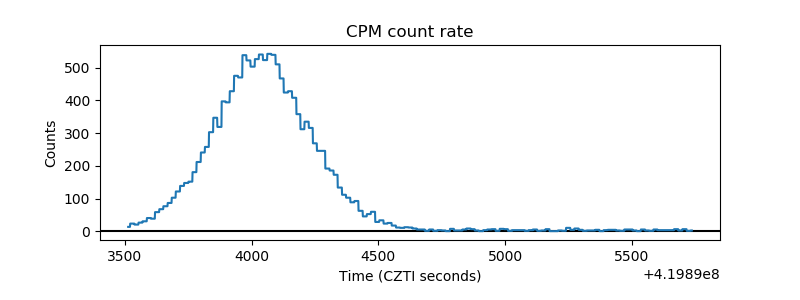 |
| CZT Counter | 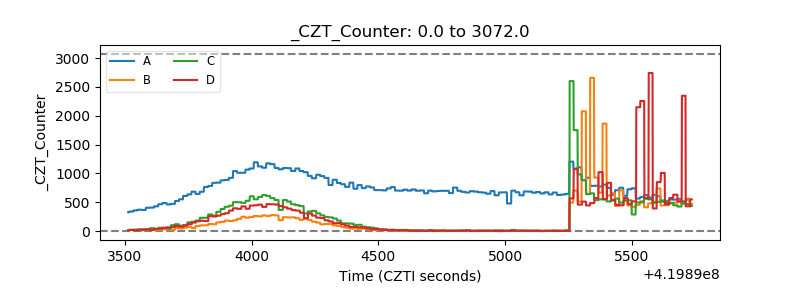 |
| +2.5 Volts monitor | 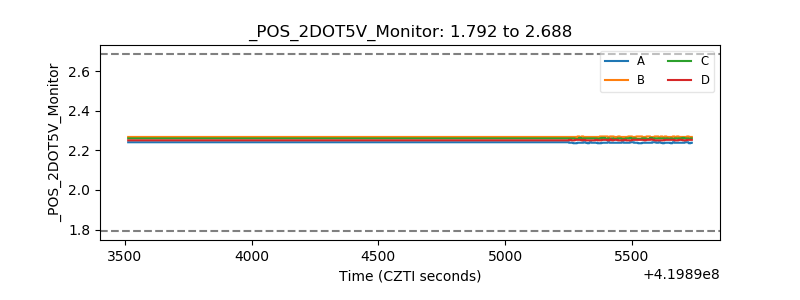 |
| +5 Volts monitor | 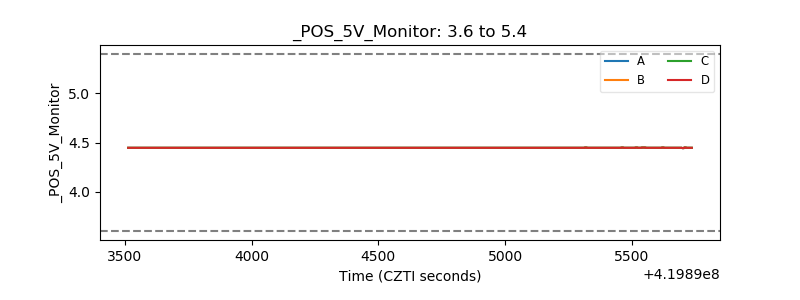 |
| _ROLL_ROT | 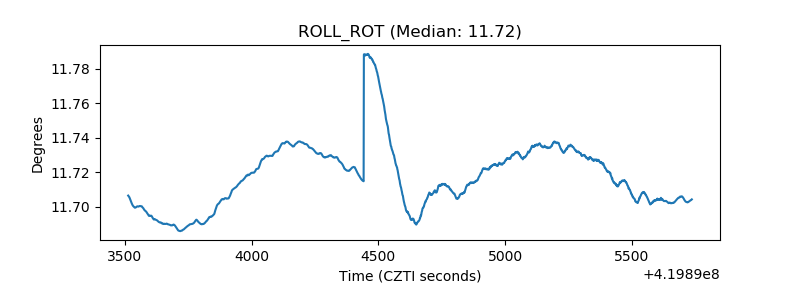 |
| _Roll_DEC | 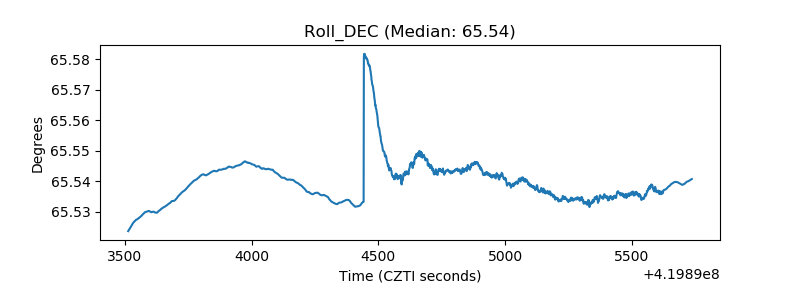 |
| _Roll_RA | 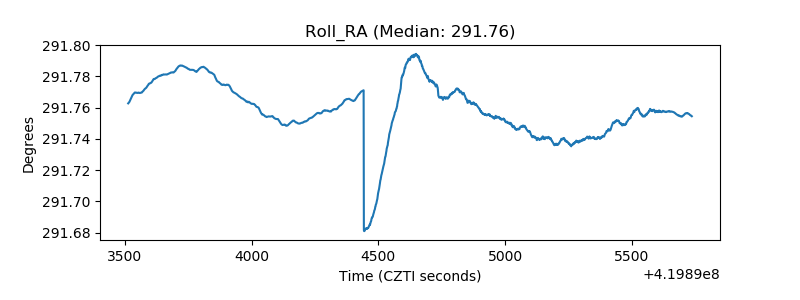 |
| Veto Counter | 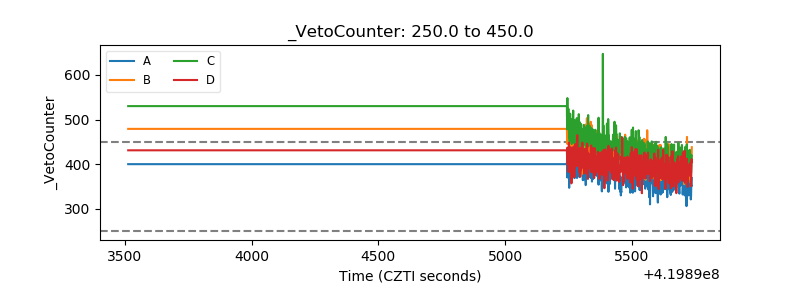 |