| Param | Original file | Final file |
|---|---|---|
| Filename | modeM0/AS1T05_101T01_9000005578_40912cztM0_level2.fits | modeM0/AS1T05_101T01_9000005578_40912cztM0_level2_quad_clean.evt |
| Size (bytes) | 240,240,960 | 67,106,880 |
| Size | 229.1 MB | 64.0 MB |
| Events in quadrant A | 1,996,733 | 445,063 |
| Events in quadrant B | 1,728,739 | 460,410 |
| Events in quadrant C | 2,183,084 | 441,331 |
| Events in quadrant D | 2,667,207 | 399,615 |
| Mode M9 | |||
|---|---|---|---|
| Quadrant | BADHDUFLAG | Total packets | Discarded packets |
| A | 0 | 20 | 0 |
| B | 0 | 20 | 0 |
| C | 0 | 20 | 0 |
| D | 0 | 20 | 0 |
| Mode SS | |||
|---|---|---|---|
| Quadrant | BADHDUFLAG | Total packets | Discarded packets |
| A | 0 | 82 | 0 |
| B | 0 | 82 | 0 |
| C | 0 | 82 | 0 |
| D | 0 | 82 | 0 |
| Mode M0 | |||
|---|---|---|---|
| Quadrant | BADHDUFLAG | Total packets | Discarded packets |
| A | 0 | 8513 | 2 |
| B | 0 | 8265 | 1 |
| C | 0 | 9250 | 1 |
| D | 0 | 10811 | 1 |
| Quadrant | Total seconds | Saturated seconds | Saturation percentage |
|---|---|---|---|
| A | 4055 | 6 | 0.147965% |
| B | 4055 | 7 | 0.172626% |
| C | 4055 | 92 | 2.268804% |
| D | 4055 | 160 | 3.945746% |
Noise dominated data is calculated using 1-second bins in cleaned event files. If a bin has >2000 counts, and if more than 50% of those come from <1% of pixels, then it is considered to be noise-dominated and hence unusable.
| Quadrant | # 1 sec bins | Bins with >0 counts | Bins with >2000 counts | High rate bins dominated by noise | Noise dominated (total time) | Noise dominated (detector-on time) | Marked lightcurve |
|---|---|---|---|---|---|---|---|
| A | 6059 | 4056 | 4 | 4 | 0.07% | 0.10% | 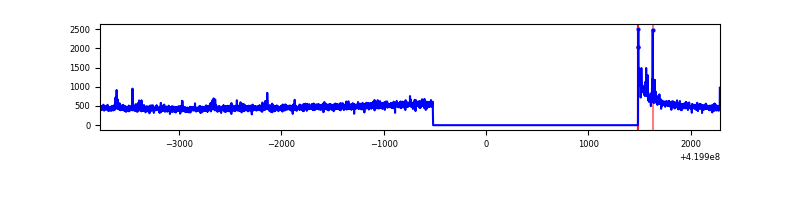 |
| B | 6059 | 4056 | 4 | 4 | 0.07% | 0.10% | 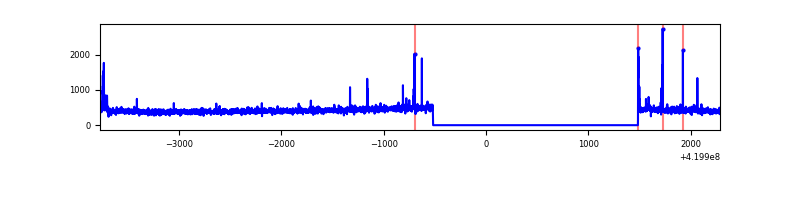 |
| C | 6059 | 4056 | 82 | 82 | 1.35% | 2.02% | 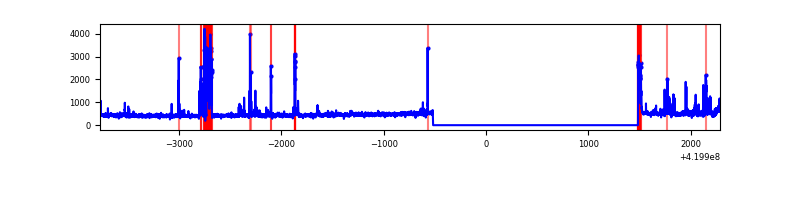 |
| D | 6059 | 4056 | 152 | 152 | 2.51% | 3.75% | 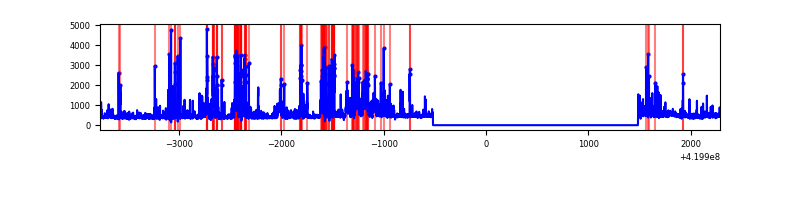 |
Top three noisy pixels from each quadrant. If the there are fewer than three noisy pixels in the level2.evt file, extra rows are filled as -1
| Pixel properties | Quadrant properties | ||||||
|---|---|---|---|---|---|---|---|
| Quadrant | DetID | PixID | Counts | Sigma | Mean | Median | Sigma |
| A | 10 | 83 | 323471 | 3722.53 | 421 | 412 | 86.8 |
| A | 13 | 248 | 16689 | 187.56 | 421 | 412 | 86.8 |
| A | 7 | 3 | 15766 | 176.92 | 421 | 412 | 86.8 |
| B | 0 | 190 | 33020 | 398.77 | 422 | 411 | 81.8 |
| B | 5 | 255 | 15857 | 188.89 | 422 | 411 | 81.8 |
| B | 12 | 111 | 10160 | 119.22 | 422 | 411 | 81.8 |
| C | 14 | 254 | 344572 | 3614.78 | 410 | 413 | 95.2 |
| C | 15 | 214 | 167564 | 1755.62 | 410 | 413 | 95.2 |
| C | 0 | 10 | 50226 | 523.2 | 410 | 413 | 95.2 |
| D | 12 | 79 | 354469 | 3616.67 | 402 | 391 | 97.9 |
| D | 12 | 233 | 320304 | 3267.69 | 402 | 391 | 97.9 |
| D | 13 | 249 | 201199 | 2051.12 | 402 | 391 | 97.9 |
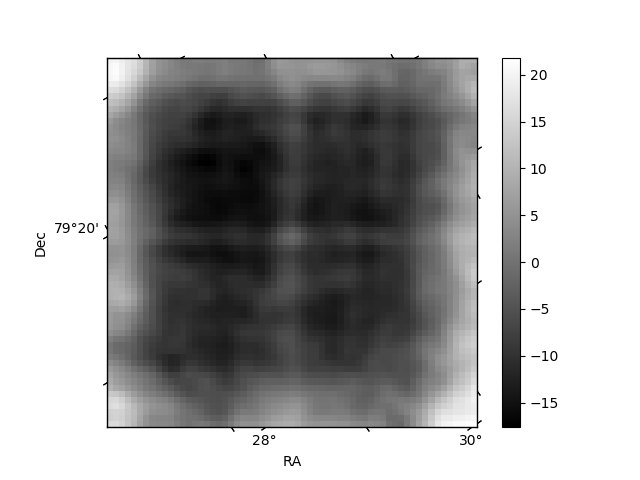
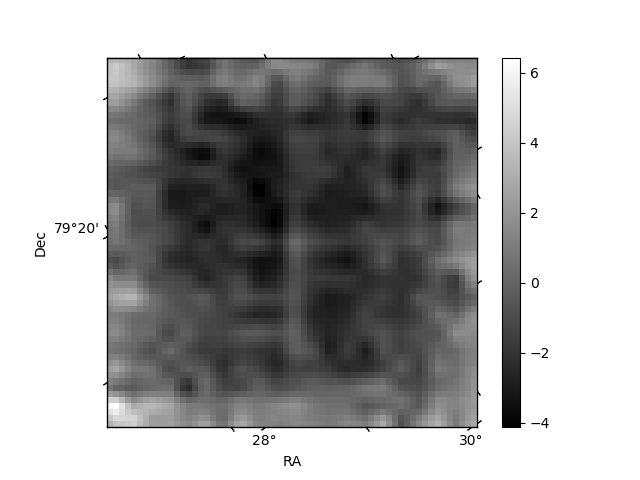
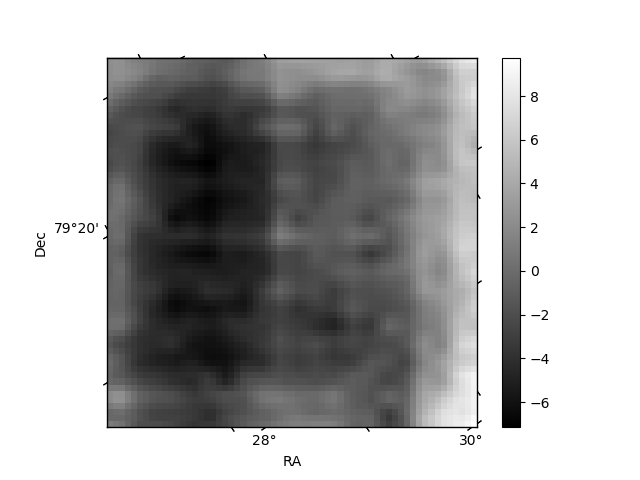
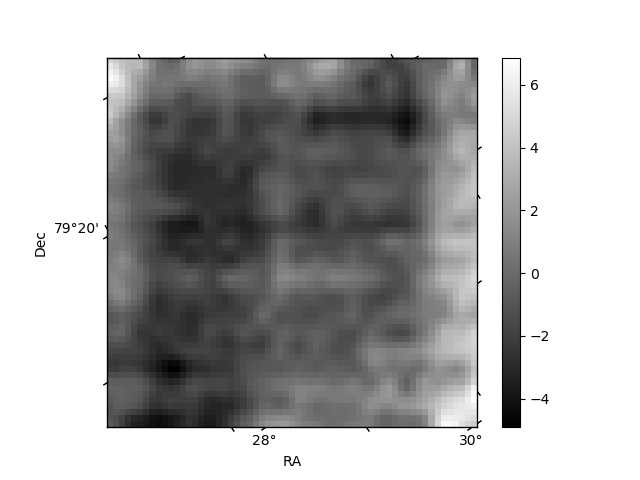
Histogram calculated using DETX and DETY for each event in the final _common_clean file
| Quadrant A | 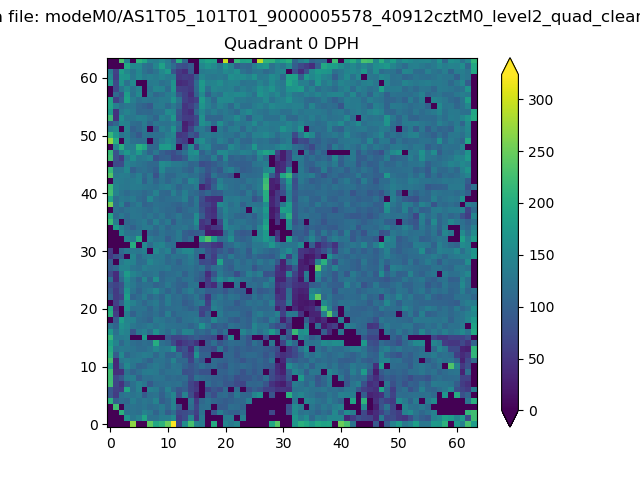 |
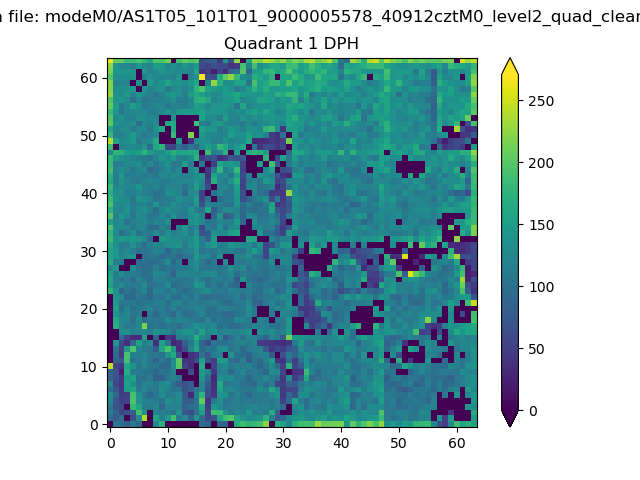 |
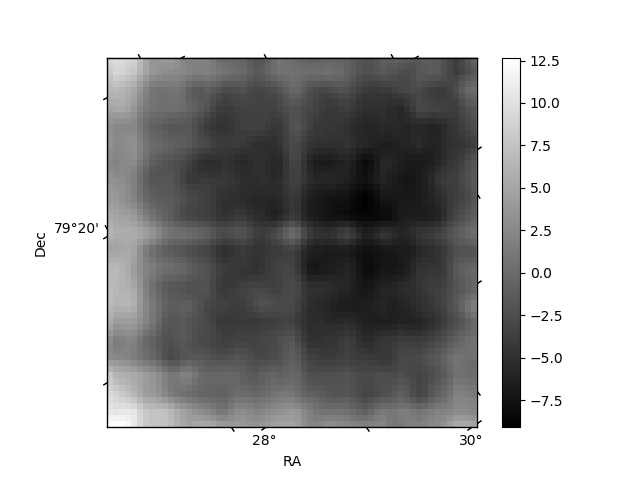
Quadrant B |
|---|---|---|---|
| Quadrant D | 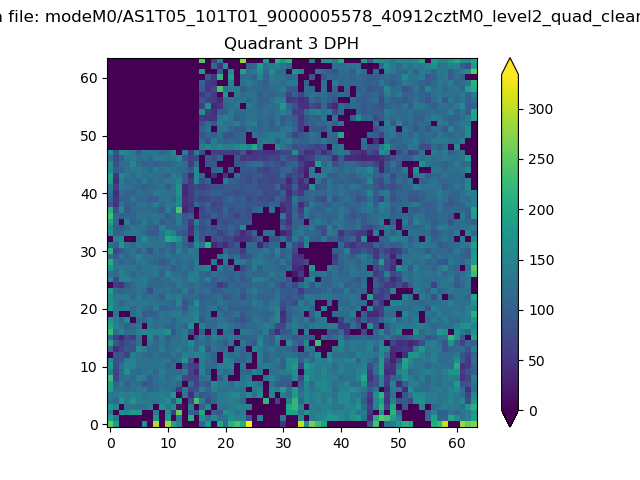 |
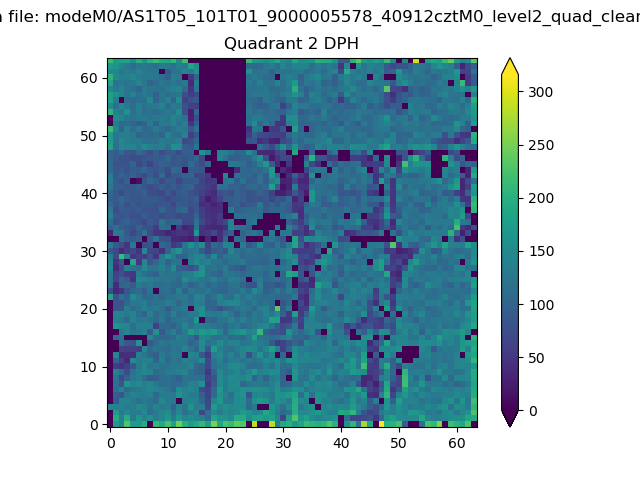 |
Quadrant C |
| Plot type | Count rate plots | Images |
|---|---|---|
| Comparison with Poisson distribution Blue bars denote a histogram of data divided into 1 sec bins. Red curve is a Poisson curve with rate = median count rate of data. |
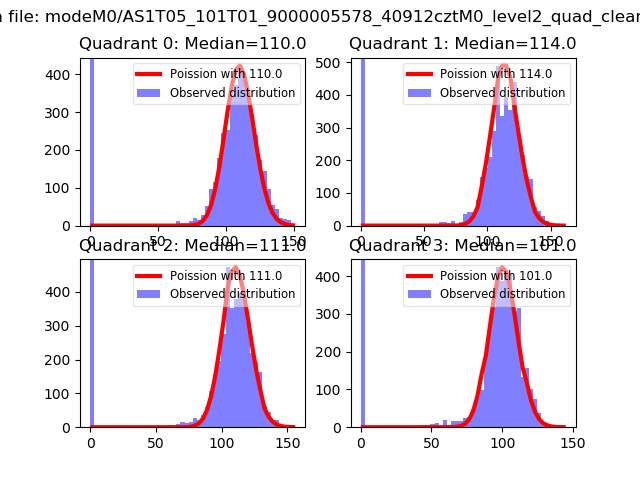 |
 |
| Quadrant-wise count rates Data is divided into 100 sec bins |
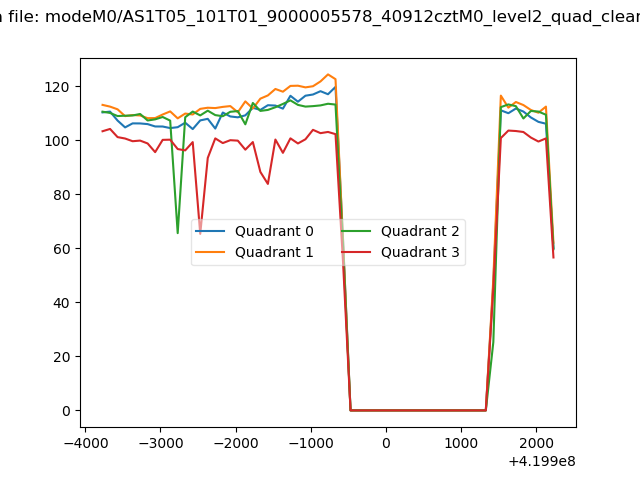 |
|
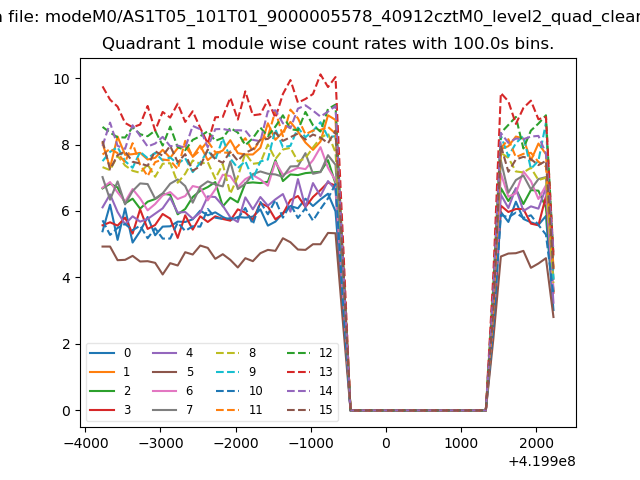
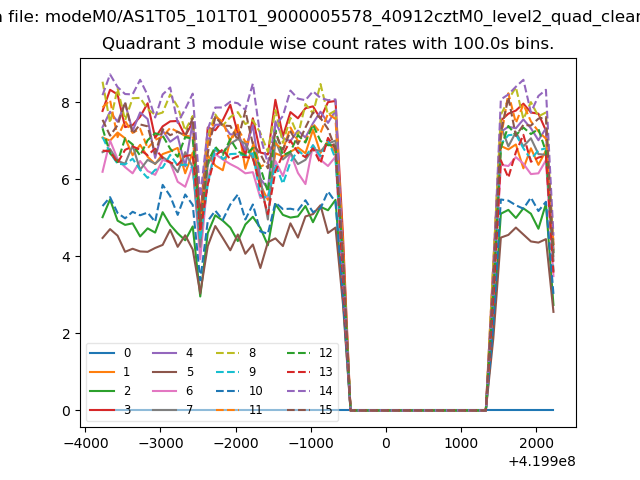
| Module-wise count rates for Quadrant A Data is divided into 100 sec bins |
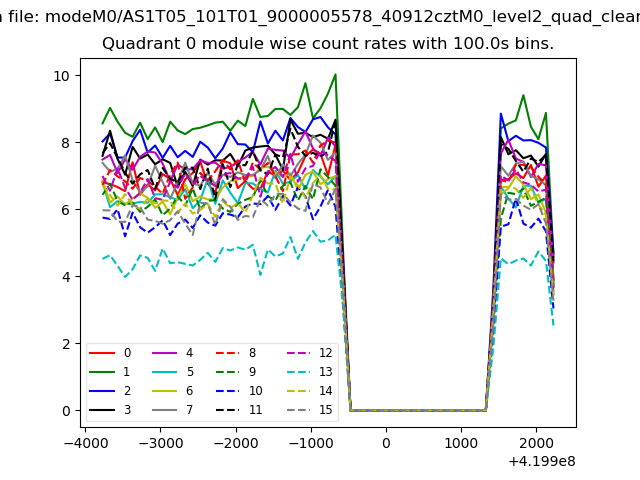 |
 |
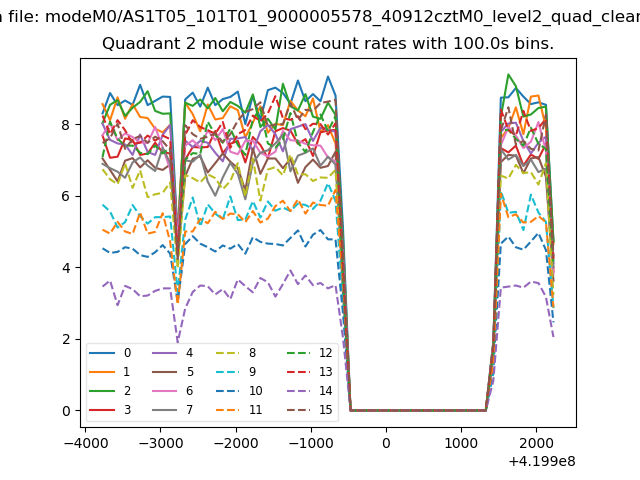
| Module-wise count rates for Quadrant B Data is divided into 100 sec bins |
 |
 |
| Module-wise count rates for Quadrant C Data is divided into 100 sec bins |
 |
 |
| Module-wise count rates for Quadrant D Data is divided into 100 sec bins |
 |
 |
| Parameter | Plot |
|---|---|
| CZT HV Monitor | 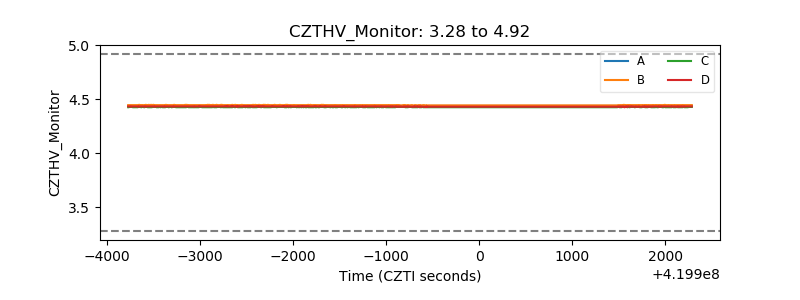 |
| D_VDD | 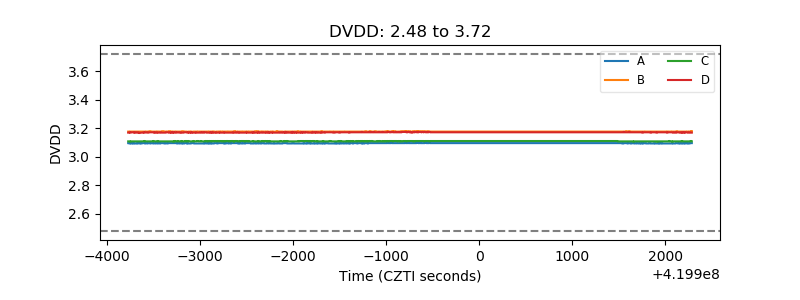 |
| Temperature 1 | 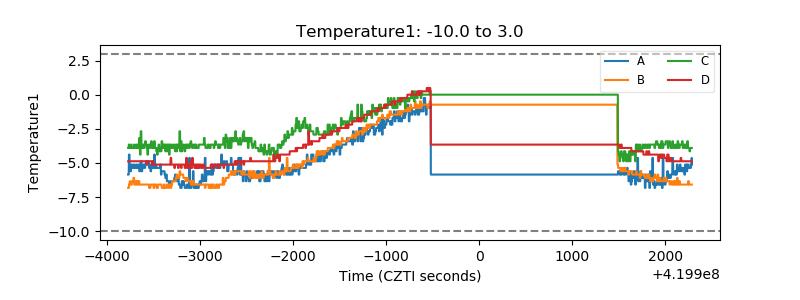 |
| Veto HV Monitor | 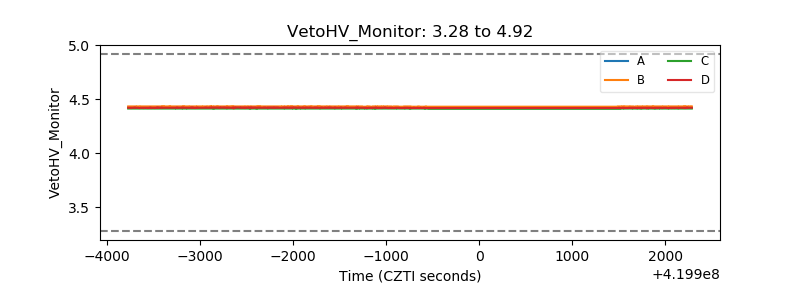 |
| Veto LLD | 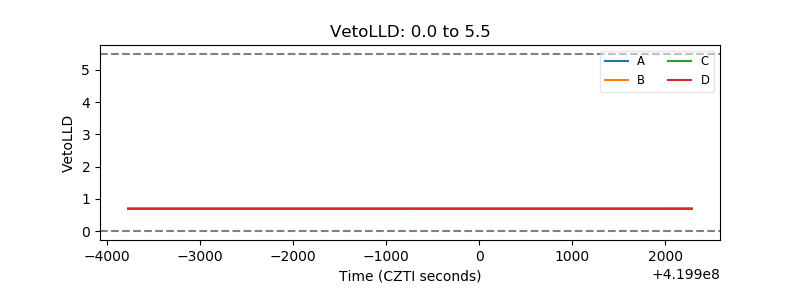 |
| Alpha Counter | 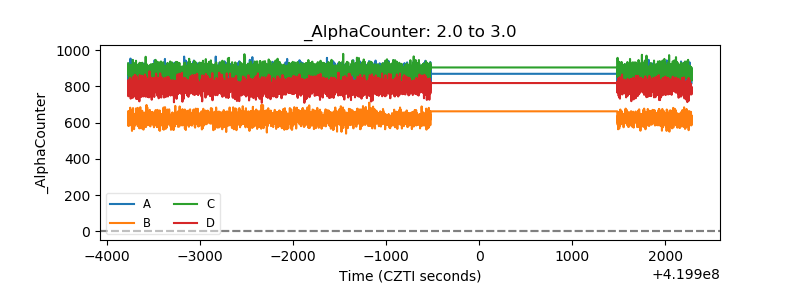 |
| _CPM_Rate | 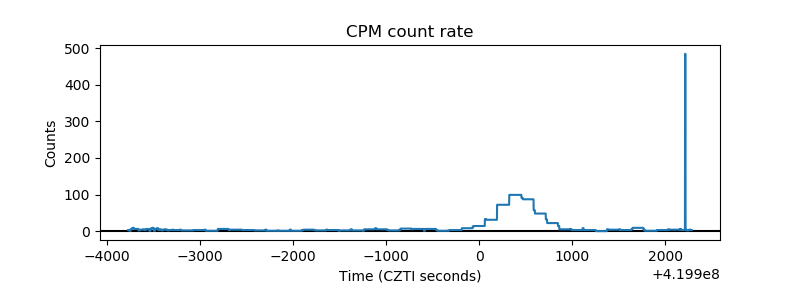 |
| CZT Counter | 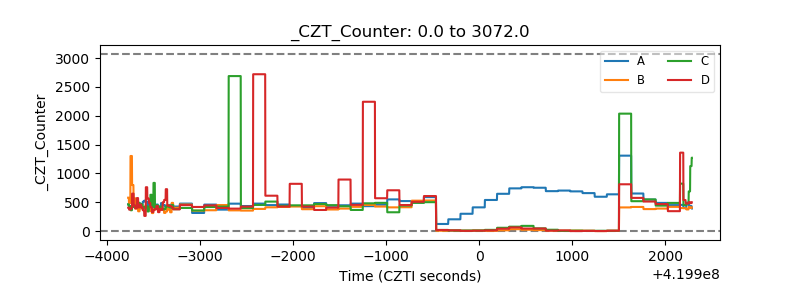 |
| +2.5 Volts monitor |  |
| +5 Volts monitor | 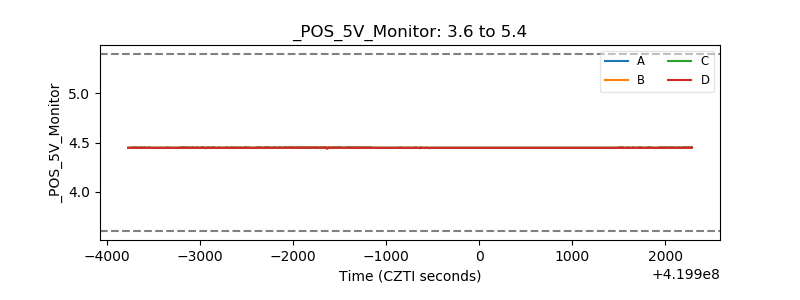 |
| _ROLL_ROT | 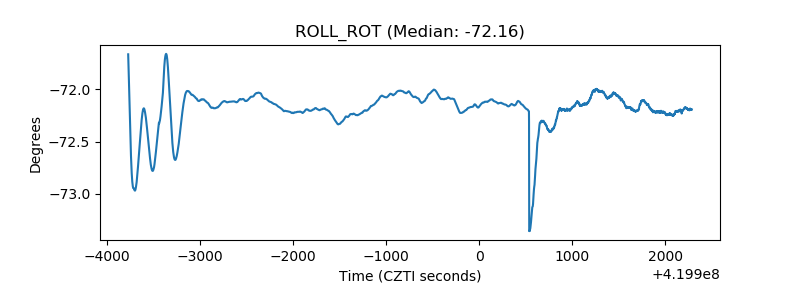 |
| _Roll_DEC | 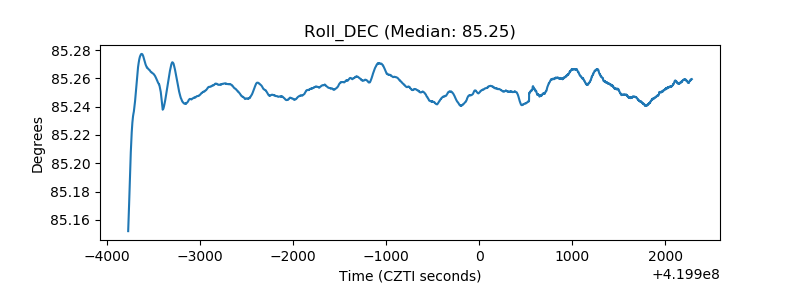 |
| _Roll_RA | 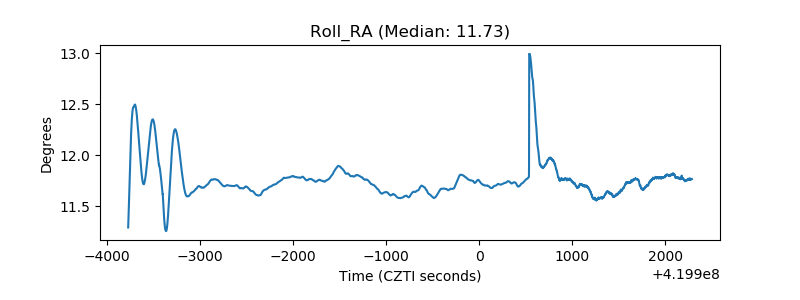 |
| Veto Counter | 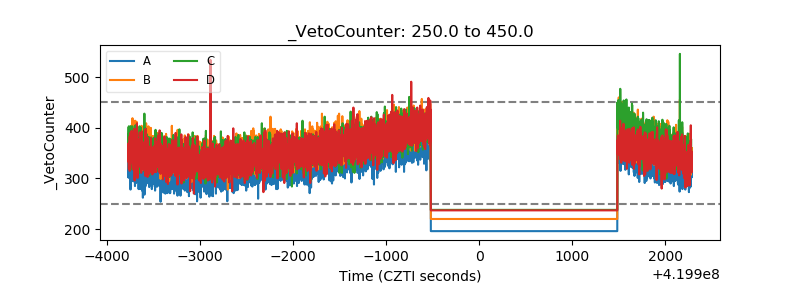 |