| Param | Original file | Final file |
|---|---|---|
| Filename | modeM0/AS1T05_101T01_9000005578_40913cztM0_level2.fits | modeM0/AS1T05_101T01_9000005578_40913cztM0_level2_quad_clean.evt |
| Size (bytes) | 333,164,160 | 91,388,160 |
| Size | 317.7 MB | 87.2 MB |
| Events in quadrant A | 2,853,921 | 605,730 |
| Events in quadrant B | 2,552,492 | 625,567 |
| Events in quadrant C | 3,369,516 | 594,025 |
| Events in quadrant D | 3,117,304 | 547,840 |
| Mode M9 | |||
|---|---|---|---|
| Quadrant | BADHDUFLAG | Total packets | Discarded packets |
| A | 0 | 30 | 0 |
| B | 0 | 30 | 0 |
| C | 0 | 30 | 0 |
| D | 0 | 31 | 0 |
| Mode SS | |||
|---|---|---|---|
| Quadrant | BADHDUFLAG | Total packets | Discarded packets |
| A | 0 | 114 | 0 |
| B | 0 | 114 | 0 |
| C | 0 | 114 | 0 |
| D | 0 | 114 | 0 |
| Mode M0 | |||
|---|---|---|---|
| Quadrant | BADHDUFLAG | Total packets | Discarded packets |
| A | 0 | 12079 | 3 |
| B | 0 | 11866 | 2 |
| C | 0 | 13781 | 2 |
| D | 0 | 13403 | 2 |
| Quadrant | Total seconds | Saturated seconds | Saturation percentage |
|---|---|---|---|
| A | 5637 | 8 | 0.141919% |
| B | 5637 | 24 | 0.425758% |
| C | 5637 | 171 | 3.033528% |
| D | 5637 | 126 | 2.235232% |
Noise dominated data is calculated using 1-second bins in cleaned event files. If a bin has >2000 counts, and if more than 50% of those come from <1% of pixels, then it is considered to be noise-dominated and hence unusable.
| Quadrant | # 1 sec bins | Bins with >0 counts | Bins with >2000 counts | High rate bins dominated by noise | Noise dominated (total time) | Noise dominated (detector-on time) | Marked lightcurve |
|---|---|---|---|---|---|---|---|
| A | 7309 | 5638 | 6 | 6 | 0.08% | 0.11% | 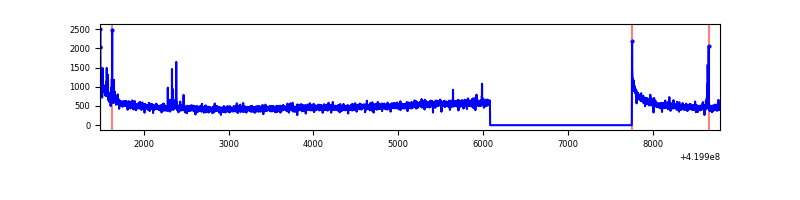 |
| B | 7309 | 5638 | 9 | 9 | 0.12% | 0.16% | 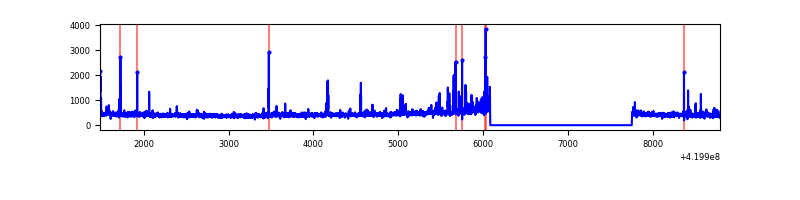 |
| C | 7309 | 5638 | 163 | 163 | 2.23% | 2.89% | 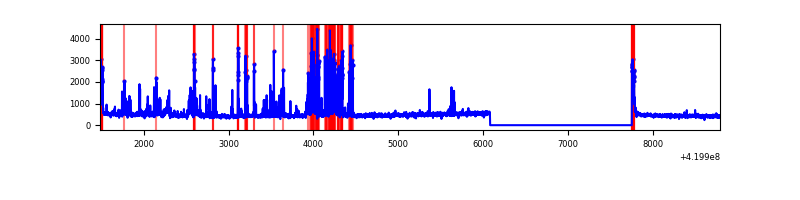 |
| D | 7309 | 5638 | 114 | 114 | 1.56% | 2.02% | 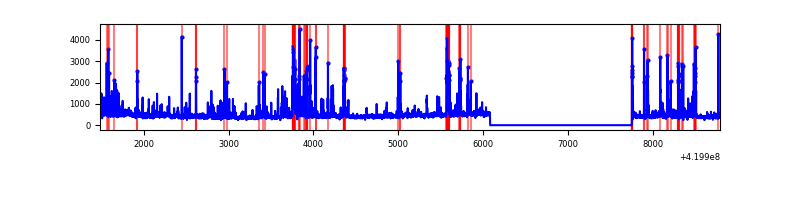 |
Top three noisy pixels from each quadrant. If the there are fewer than three noisy pixels in the level2.evt file, extra rows are filled as -1
| Pixel properties | Quadrant properties | ||||||
|---|---|---|---|---|---|---|---|
| Quadrant | DetID | PixID | Counts | Sigma | Mean | Median | Sigma |
| A | 10 | 83 | 530046 | 4448.0 | 585 | 573 | 119.0 |
| A | 13 | 248 | 17113 | 138.95 | 585 | 573 | 119.0 |
| A | 13 | 6 | 12189 | 97.58 | 585 | 573 | 119.0 |
| B | 0 | 190 | 62503 | 549.79 | 588 | 572 | 112.6 |
| B | 5 | 255 | 61009 | 536.53 | 588 | 572 | 112.6 |
| B | 0 | 245 | 57376 | 504.28 | 588 | 572 | 112.6 |
| C | 14 | 254 | 769729 | 5819.65 | 569 | 572 | 132.2 |
| C | 15 | 214 | 236674 | 1786.41 | 569 | 572 | 132.2 |
| C | 0 | 10 | 113323 | 853.1 | 569 | 572 | 132.2 |
| D | 12 | 233 | 328745 | 2357.03 | 568 | 549 | 139.2 |
| D | 2 | 249 | 249412 | 1787.27 | 568 | 549 | 139.2 |
| D | 1 | 52 | 73984 | 527.39 | 568 | 549 | 139.2 |
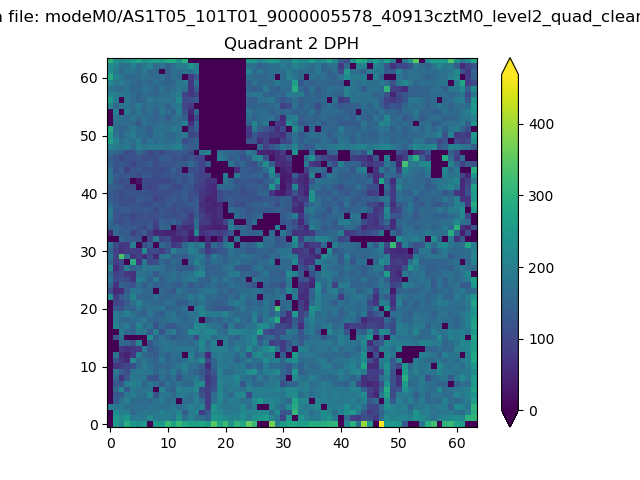
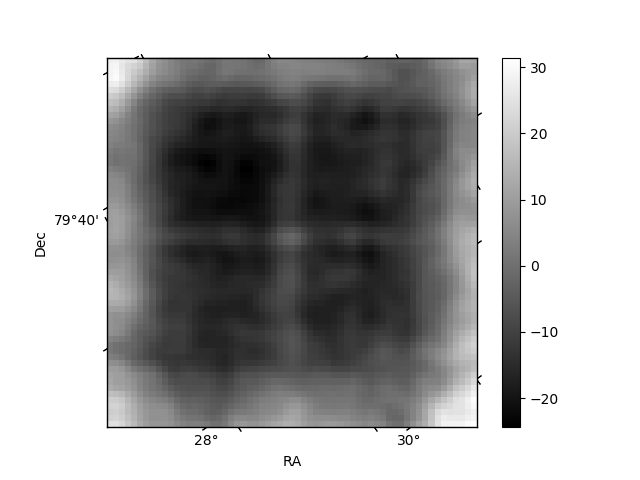
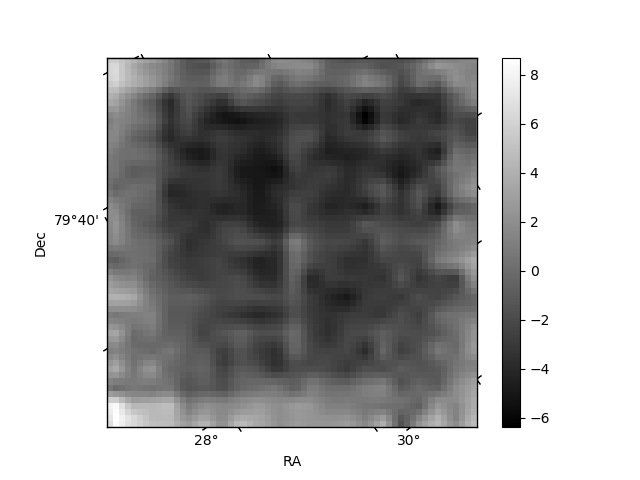
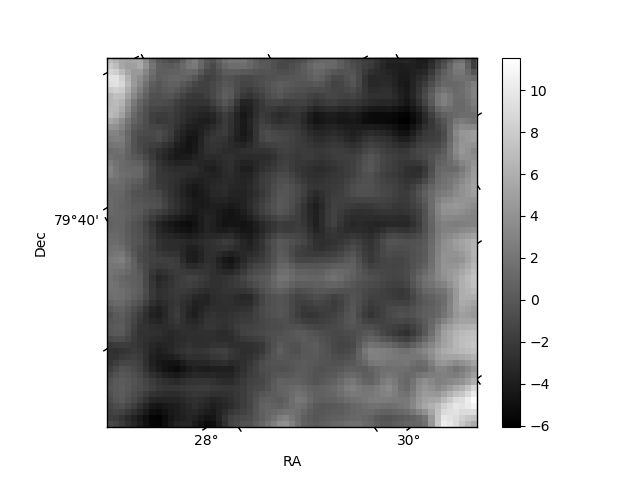
Histogram calculated using DETX and DETY for each event in the final _common_clean file
| Quadrant A | 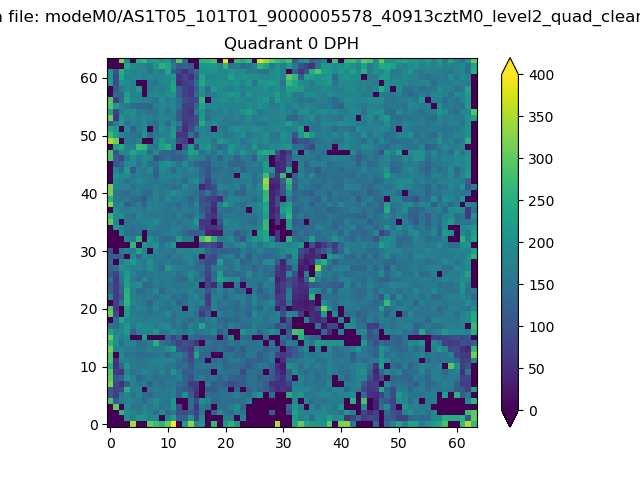 |
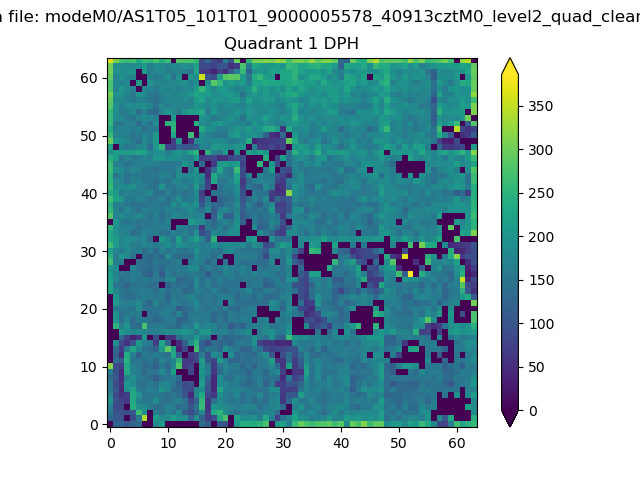 |
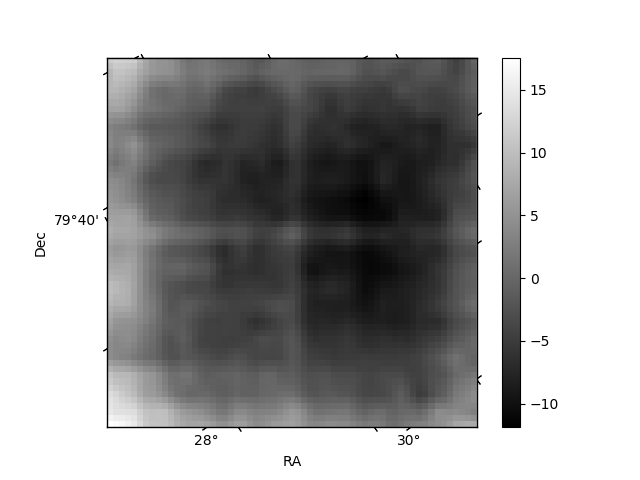
Quadrant B |
|---|---|---|---|
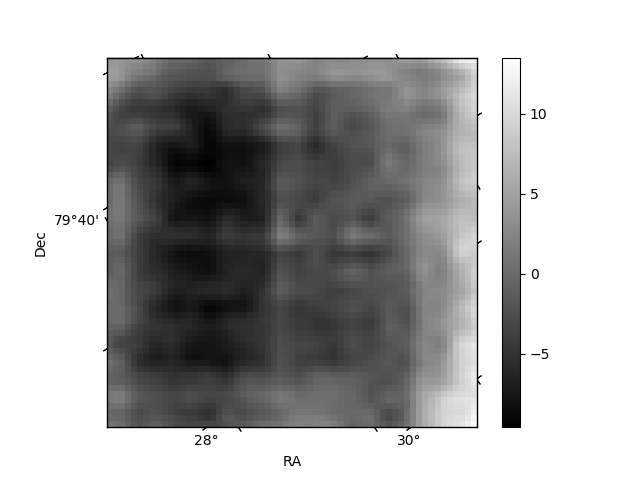
| Quadrant D | 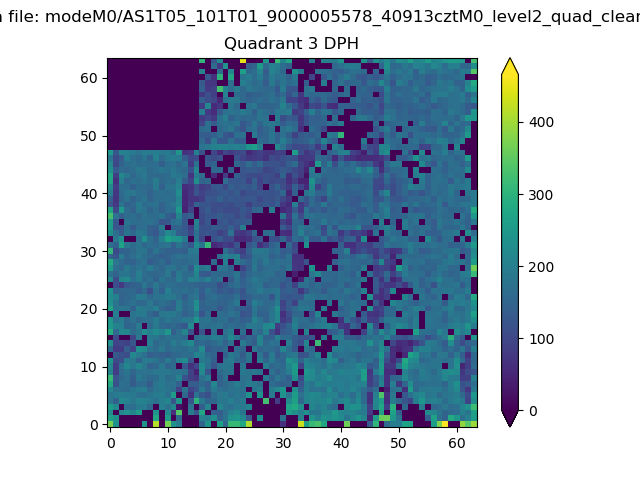 |
 |
Quadrant C |
| Plot type | Count rate plots | Images |
|---|---|---|
| Comparison with Poisson distribution Blue bars denote a histogram of data divided into 1 sec bins. Red curve is a Poisson curve with rate = median count rate of data. |
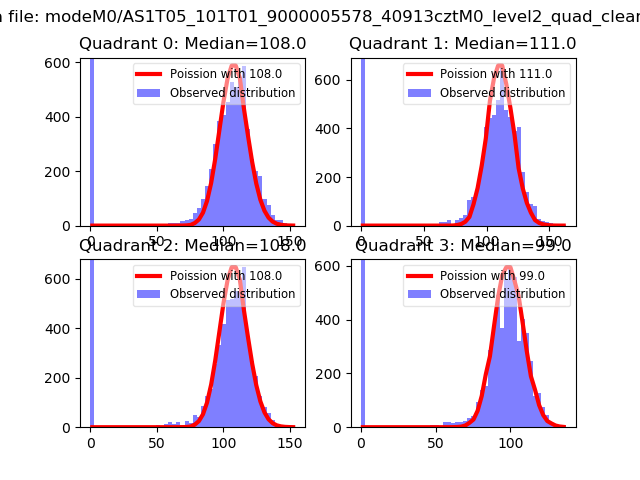 |
 |
| Quadrant-wise count rates Data is divided into 100 sec bins |
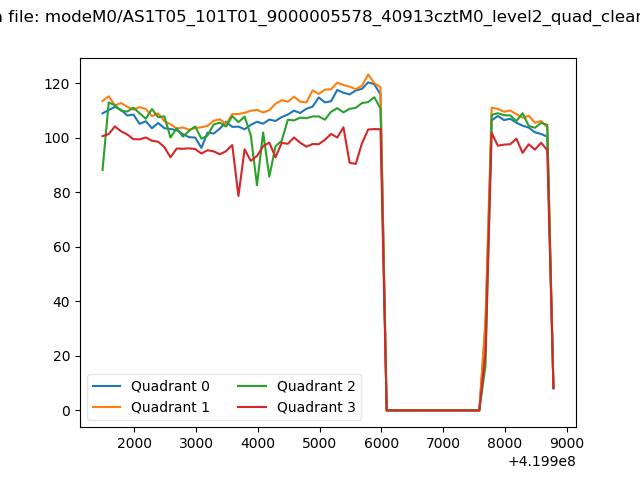 |
|
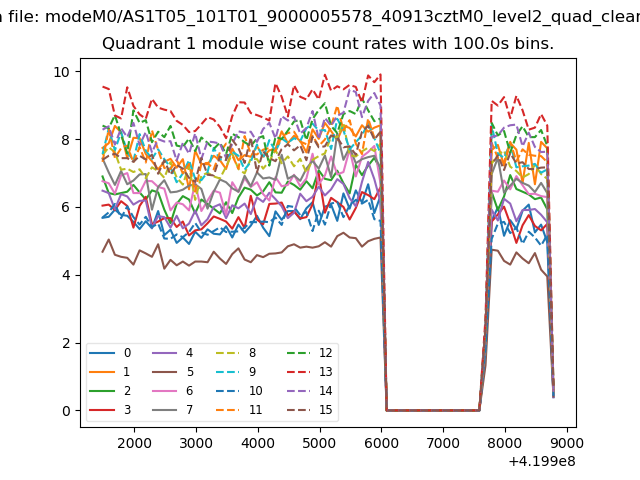
| Module-wise count rates for Quadrant A Data is divided into 100 sec bins |
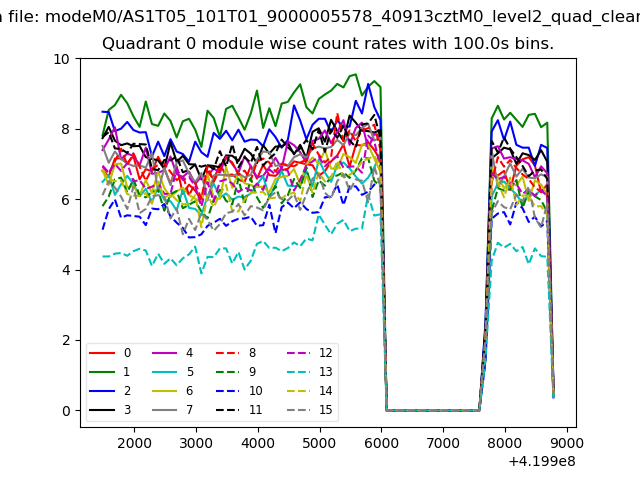 |
 |
| Module-wise count rates for Quadrant B Data is divided into 100 sec bins |
 |
 |
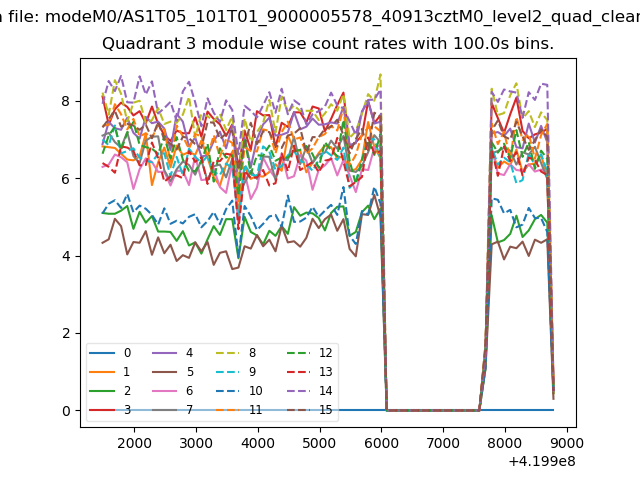
| Module-wise count rates for Quadrant C Data is divided into 100 sec bins |
 |
 |
| Module-wise count rates for Quadrant D Data is divided into 100 sec bins |
 |
 |
| Parameter | Plot |
|---|---|
| CZT HV Monitor | 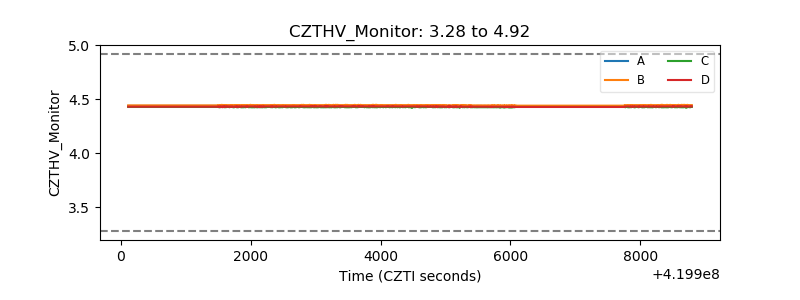 |
| D_VDD | 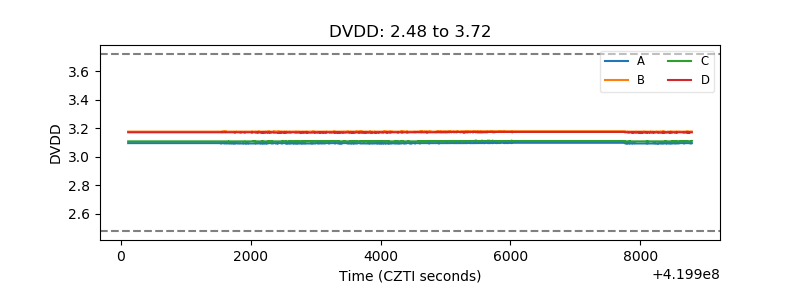 |
| Temperature 1 | 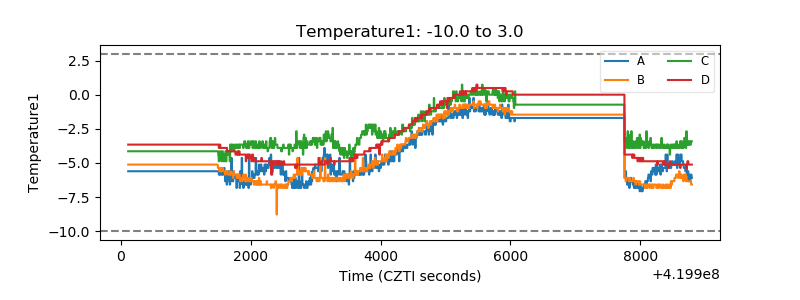 |
| Veto HV Monitor | 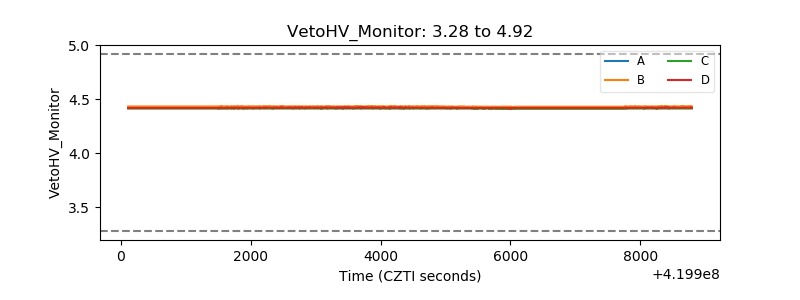 |
| Veto LLD | 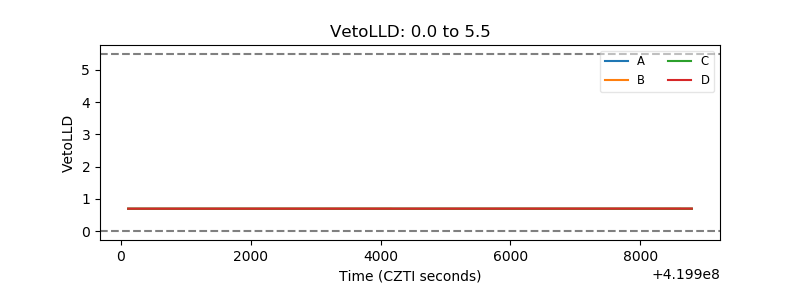 |
| Alpha Counter | 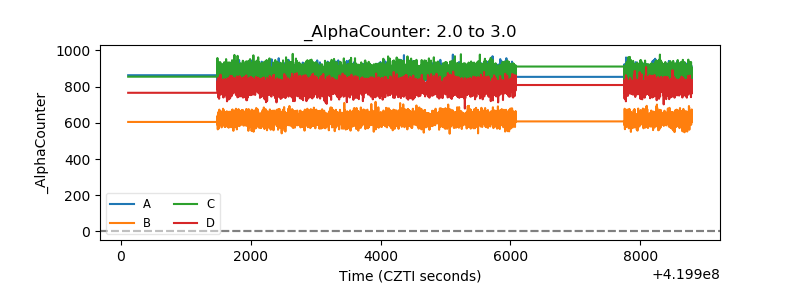 |
| _CPM_Rate | 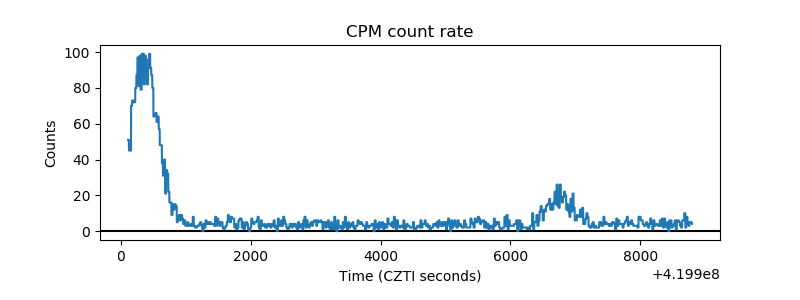 |
| CZT Counter | 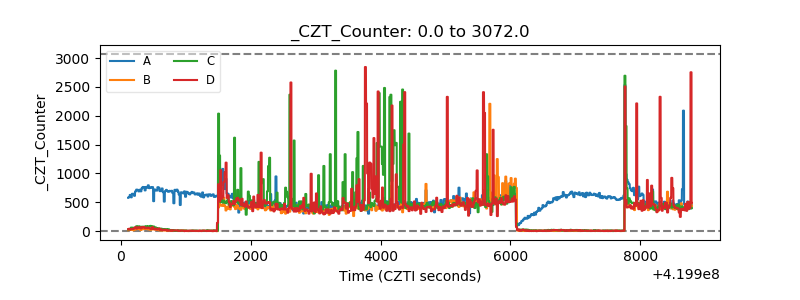 |
| +2.5 Volts monitor |  |
| +5 Volts monitor |  |
| _ROLL_ROT | 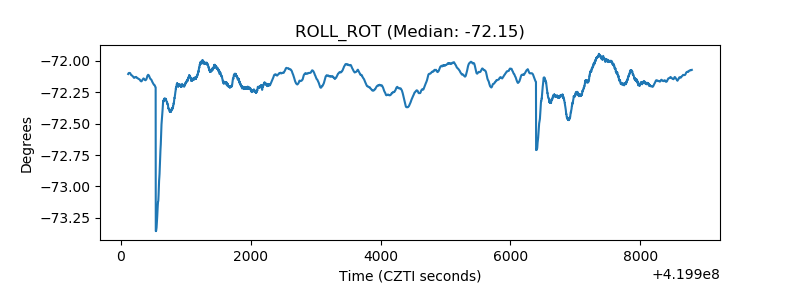 |
| _Roll_DEC | 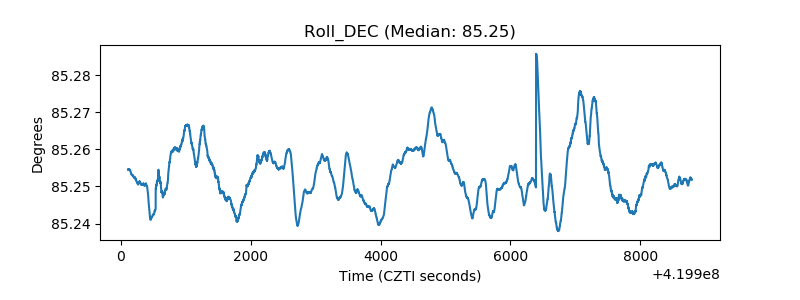 |
| _Roll_RA | 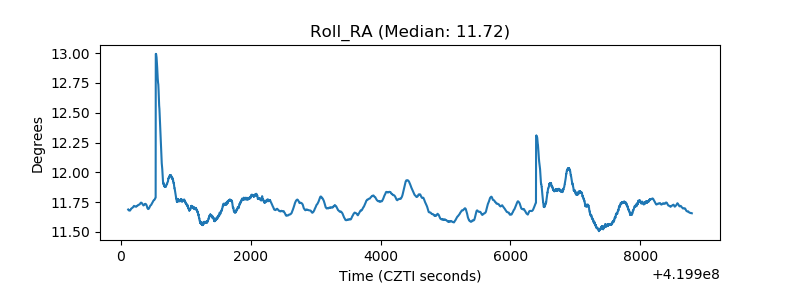 |
| Veto Counter | 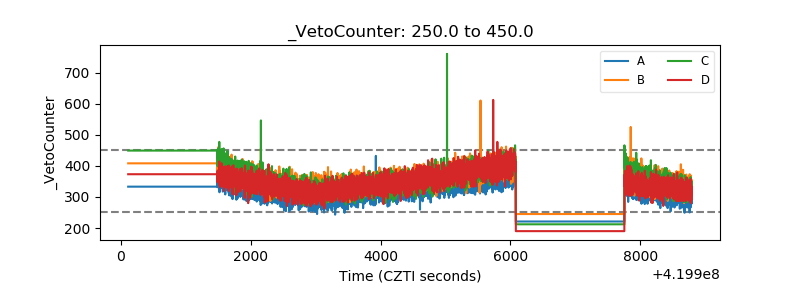 |