| Param | Original file | Final file |
|---|---|---|
| Filename | modeM0/AS1T05_101T01_9000005578_40914cztM0_level2.fits | modeM0/AS1T05_101T01_9000005578_40914cztM0_level2_quad_clean.evt |
| Size (bytes) | 350,850,240 | 95,621,760 |
| Size | 334.6 MB | 91.2 MB |
| Events in quadrant A | 3,057,749 | 636,600 |
| Events in quadrant B | 2,789,108 | 652,613 |
| Events in quadrant C | 2,744,119 | 629,789 |
| Events in quadrant D | 3,934,019 | 561,645 |
| Mode M9 | |||
|---|---|---|---|
| Quadrant | BADHDUFLAG | Total packets | Discarded packets |
| A | 0 | 31 | 0 |
| B | 0 | 31 | 0 |
| C | 0 | 31 | 0 |
| D | 0 | 31 | 0 |
| Mode SS | |||
|---|---|---|---|
| Quadrant | BADHDUFLAG | Total packets | Discarded packets |
| A | 0 | 122 | 0 |
| B | 0 | 122 | 0 |
| C | 0 | 122 | 0 |
| D | 0 | 122 | 0 |
| Mode M0 | |||
|---|---|---|---|
| Quadrant | BADHDUFLAG | Total packets | Discarded packets |
| A | 0 | 12765 | 3 |
| B | 0 | 12725 | 2 |
| C | 0 | 12213 | 2 |
| D | 0 | 16052 | 2 |
| Quadrant | Total seconds | Saturated seconds | Saturation percentage |
|---|---|---|---|
| A | 5935 | 10 | 0.168492% |
| B | 5935 | 39 | 0.657119% |
| C | 5935 | 27 | 0.454928% |
| D | 5935 | 265 | 4.465038% |
Noise dominated data is calculated using 1-second bins in cleaned event files. If a bin has >2000 counts, and if more than 50% of those come from <1% of pixels, then it is considered to be noise-dominated and hence unusable.
| Quadrant | # 1 sec bins | Bins with >0 counts | Bins with >2000 counts | High rate bins dominated by noise | Noise dominated (total time) | Noise dominated (detector-on time) | Marked lightcurve |
|---|---|---|---|---|---|---|---|
| A | 9010 | 5937 | 4 | 4 | 0.04% | 0.07% | 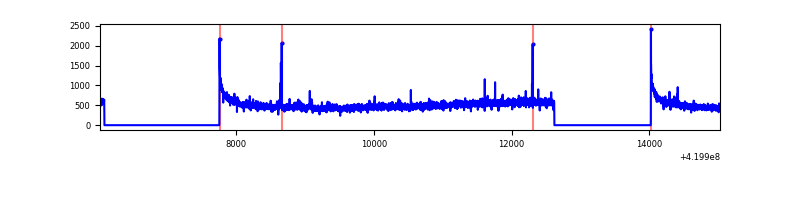 |
| B | 9010 | 5937 | 22 | 22 | 0.24% | 0.37% | 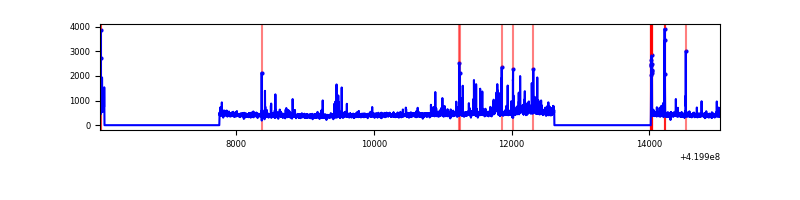 |
| C | 9010 | 5937 | 23 | 23 | 0.26% | 0.39% | 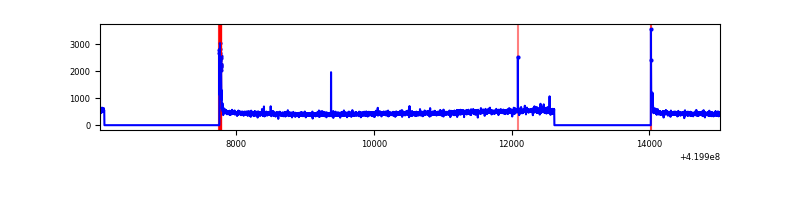 |
| D | 9010 | 5937 | 246 | 246 | 2.73% | 4.14% | 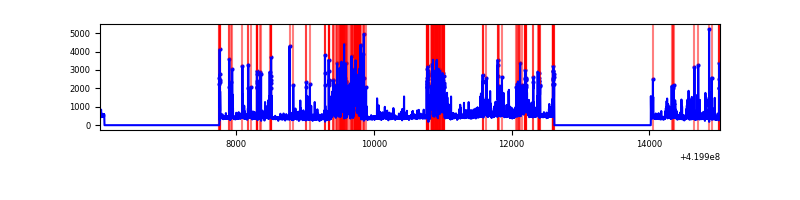 |
Top three noisy pixels from each quadrant. If the there are fewer than three noisy pixels in the level2.evt file, extra rows are filled as -1
| Pixel properties | Quadrant properties | ||||||
|---|---|---|---|---|---|---|---|
| Quadrant | DetID | PixID | Counts | Sigma | Mean | Median | Sigma |
| A | 10 | 83 | 574407 | 4464.39 | 625 | 613 | 128.5 |
| A | 12 | 189 | 29501 | 224.76 | 625 | 613 | 128.5 |
| A | 2 | 79 | 11395 | 83.89 | 625 | 613 | 128.5 |
| B | 5 | 255 | 96923 | 791.1 | 624 | 606 | 121.8 |
| B | 0 | 245 | 87463 | 713.4 | 624 | 606 | 121.8 |
| B | 15 | 35 | 47047 | 381.44 | 624 | 606 | 121.8 |
| C | 15 | 214 | 254793 | 1800.52 | 610 | 613 | 141.2 |
| C | 0 | 10 | 89871 | 632.27 | 610 | 613 | 141.2 |
| C | 3 | 233 | 8783 | 57.87 | 610 | 613 | 141.2 |
| D | 12 | 233 | 762024 | 5177.2 | 601 | 584 | 147.1 |
| D | 2 | 249 | 295409 | 2004.58 | 601 | 584 | 147.1 |
| D | 2 | 120 | 139894 | 947.2 | 601 | 584 | 147.1 |
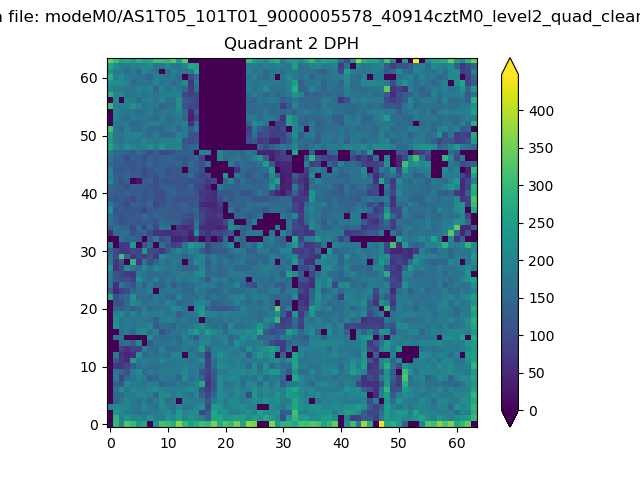
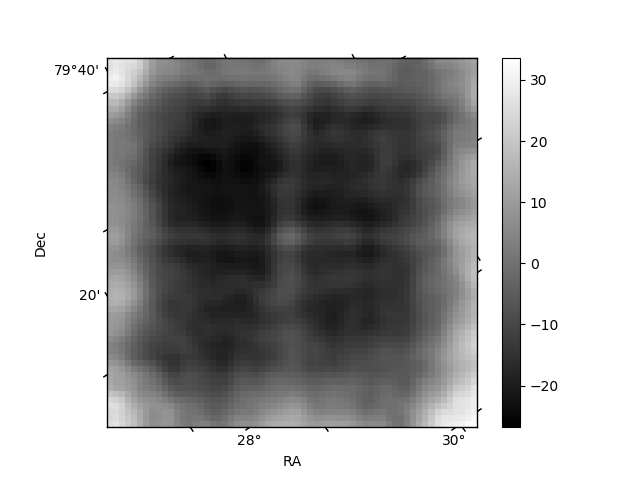
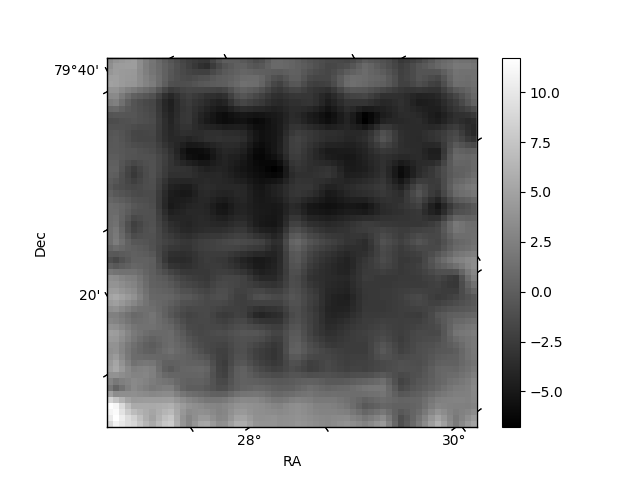
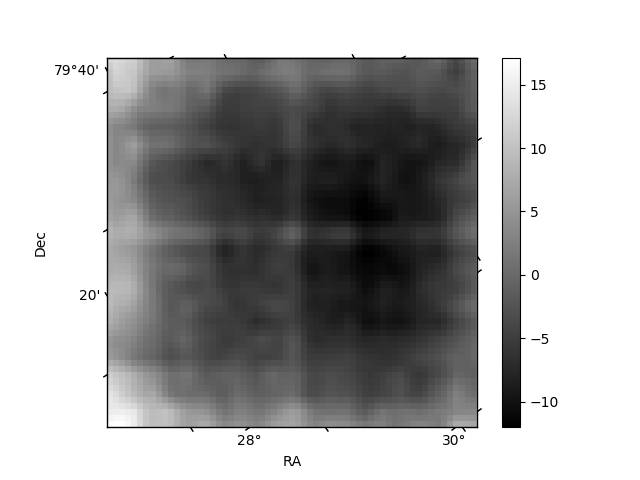
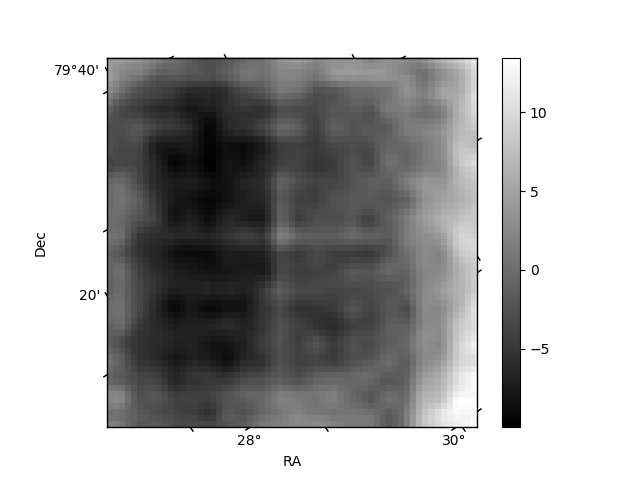
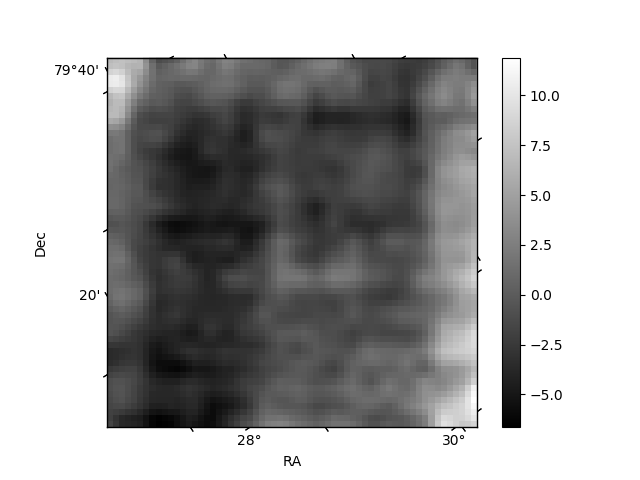
Histogram calculated using DETX and DETY for each event in the final _common_clean file
| Quadrant A | 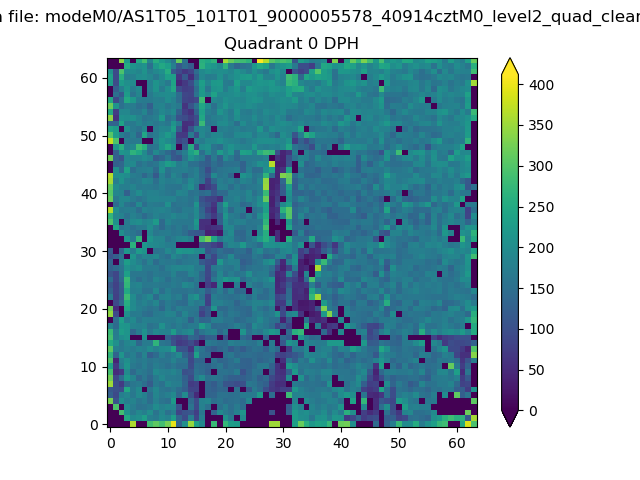 |
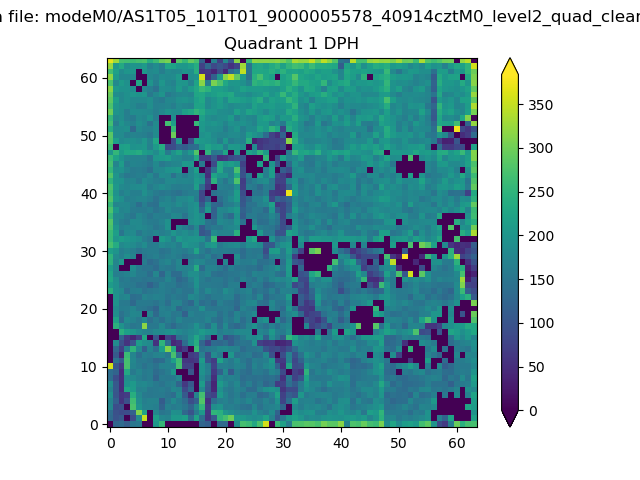 |
Quadrant B |
|---|---|---|---|
| Quadrant D | 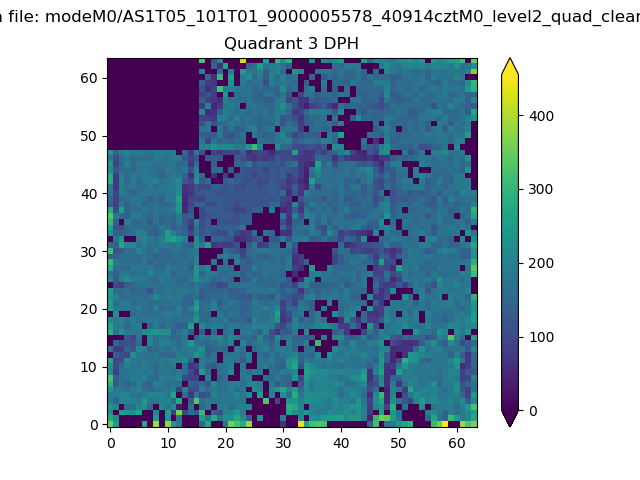 |
 |
Quadrant C |
| Plot type | Count rate plots | Images |
|---|---|---|
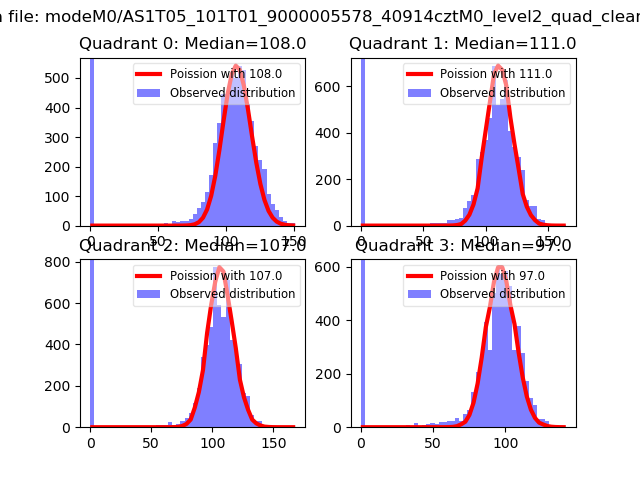
| Comparison with Poisson distribution Blue bars denote a histogram of data divided into 1 sec bins. Red curve is a Poisson curve with rate = median count rate of data. |
 |
 |
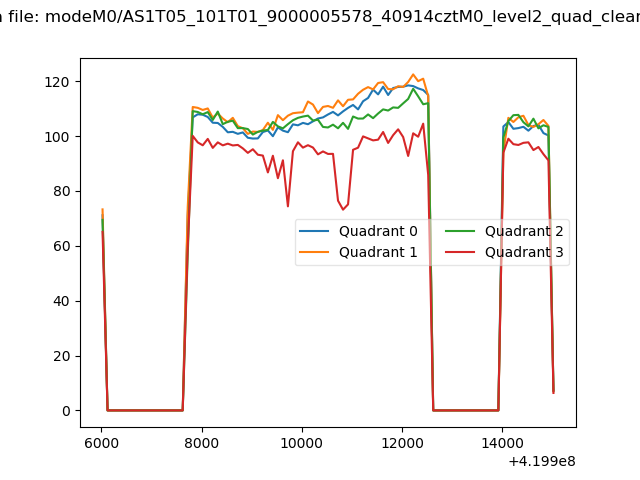
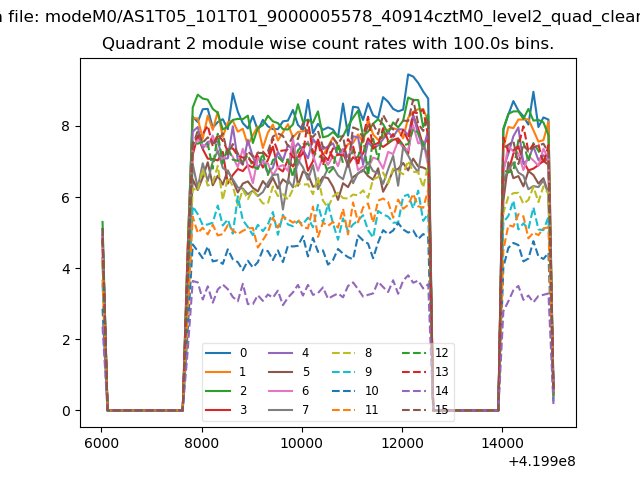
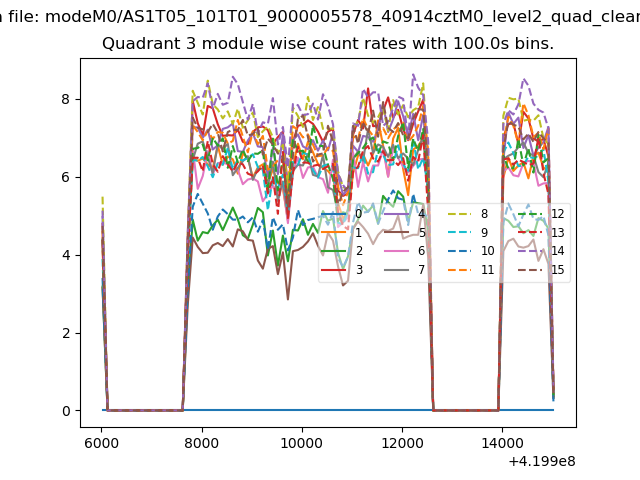
| Quadrant-wise count rates Data is divided into 100 sec bins |
 |
|
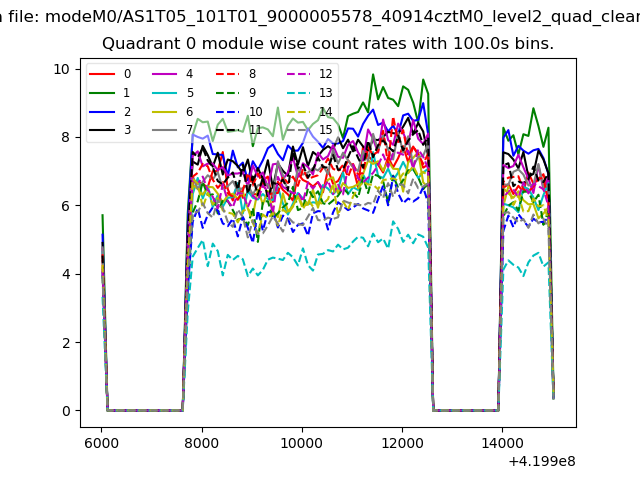
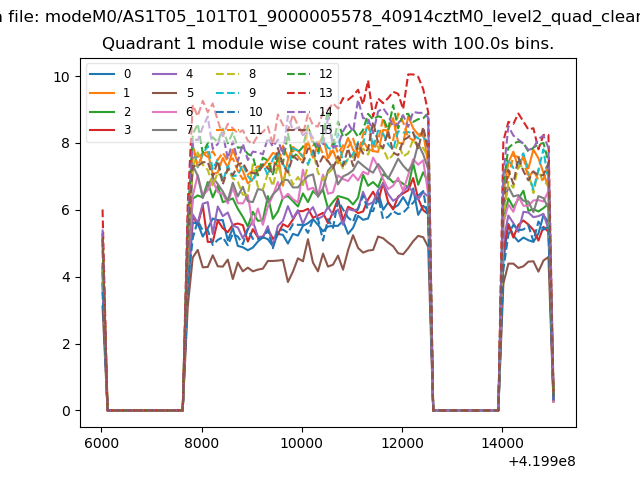
| Module-wise count rates for Quadrant A Data is divided into 100 sec bins |
 |
 |
| Module-wise count rates for Quadrant B Data is divided into 100 sec bins |
 |
 |
| Module-wise count rates for Quadrant C Data is divided into 100 sec bins |
 |
 |
| Module-wise count rates for Quadrant D Data is divided into 100 sec bins |
 |
 |
| Parameter | Plot |
|---|---|
| CZT HV Monitor | 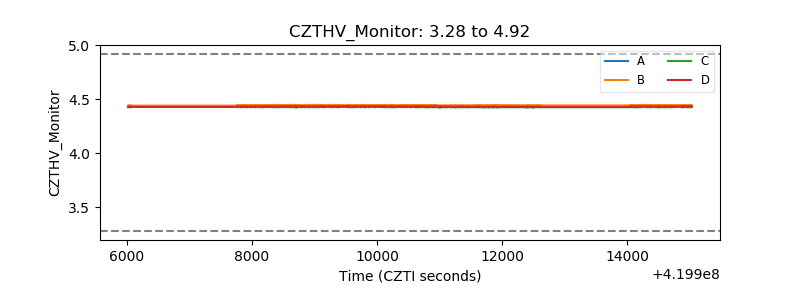 |
| D_VDD | 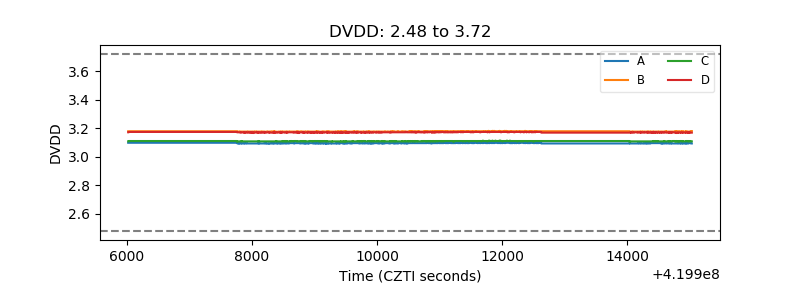 |
| Temperature 1 | 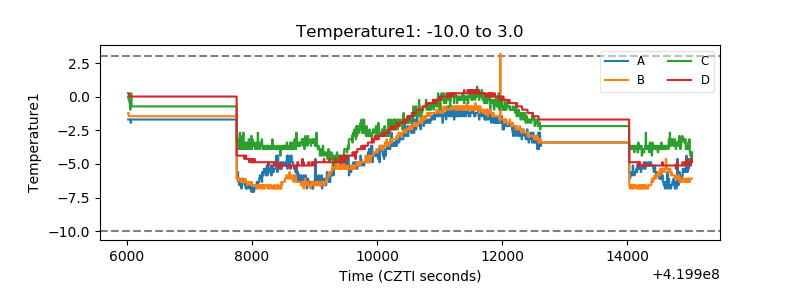 |
| Veto HV Monitor | 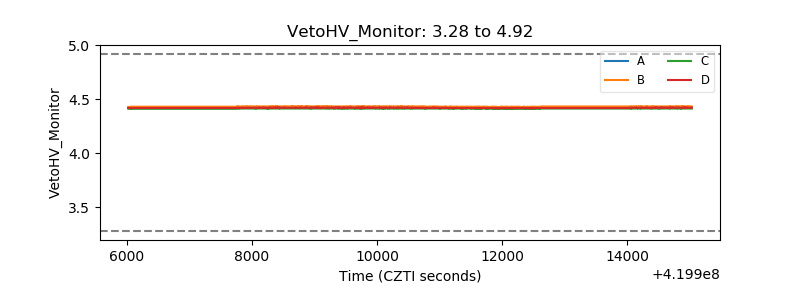 |
| Veto LLD | 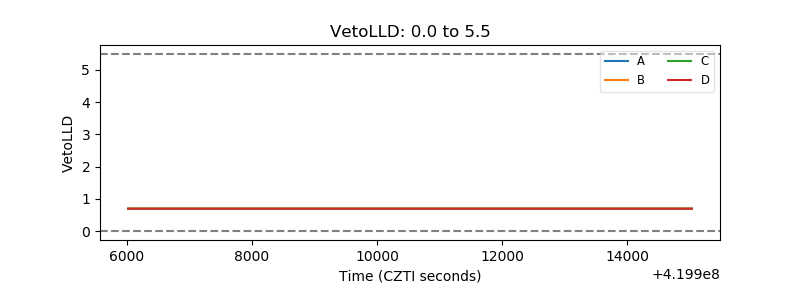 |
| Alpha Counter | 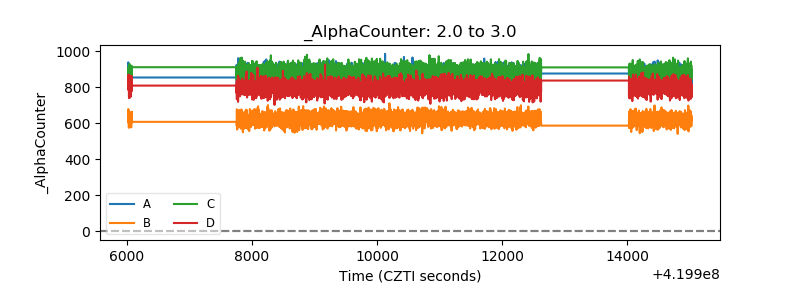 |
| _CPM_Rate | 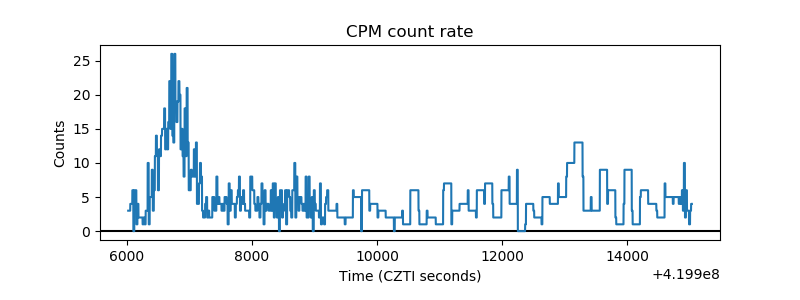 |
| CZT Counter | 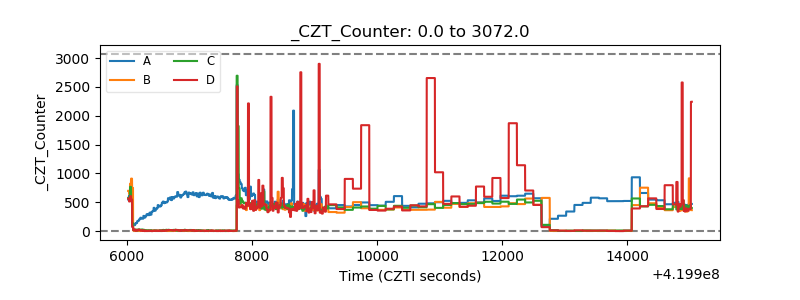 |
| +2.5 Volts monitor | 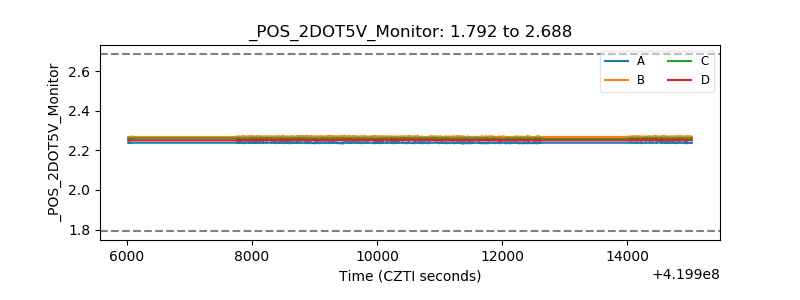 |
| +5 Volts monitor | 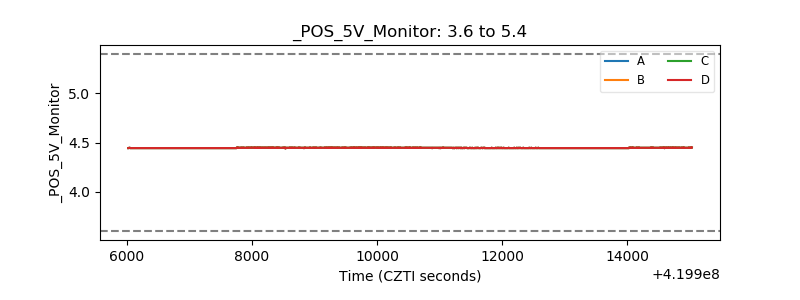 |
| _ROLL_ROT | 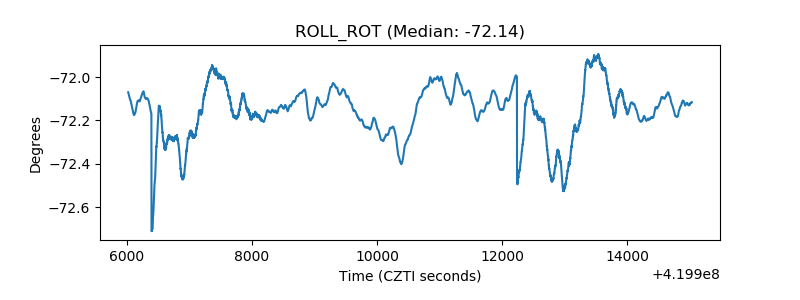 |
| _Roll_DEC | 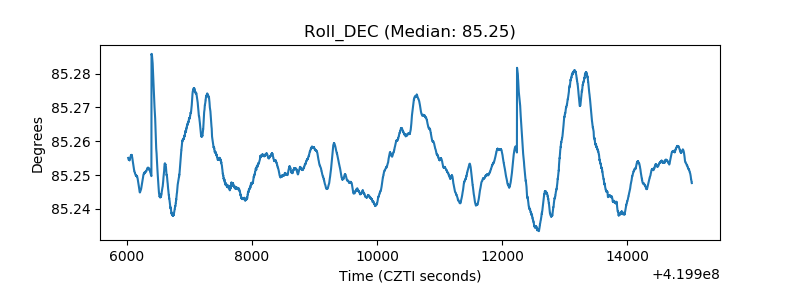 |
| _Roll_RA | 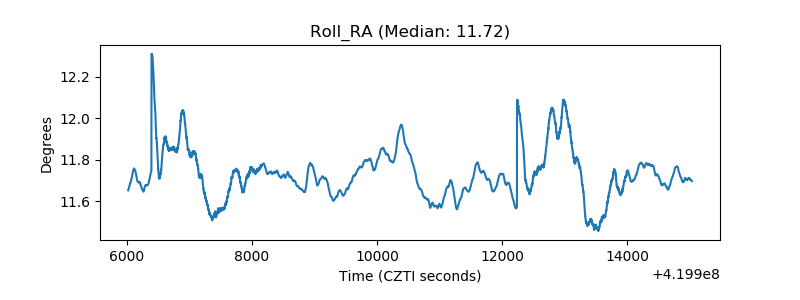 |
| Veto Counter | 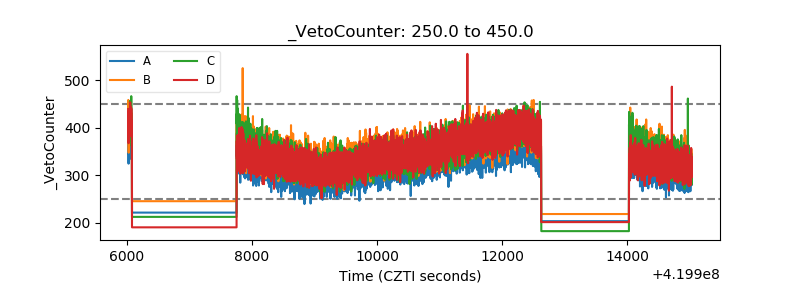 |