| Param | Original file | Final file |
|---|---|---|
| Filename | modeM0/AS1T05_101T01_9000005578_40915cztM0_level2.fits | modeM0/AS1T05_101T01_9000005578_40915cztM0_level2_quad_clean.evt |
| Size (bytes) | 237,487,680 | 66,922,560 |
| Size | 226.5 MB | 63.8 MB |
| Events in quadrant A | 2,056,062 | 447,887 |
| Events in quadrant B | 1,962,875 | 458,186 |
| Events in quadrant C | 1,857,010 | 437,115 |
| Events in quadrant D | 2,588,055 | 388,457 |
| Mode SS | |||
|---|---|---|---|
| Quadrant | BADHDUFLAG | Total packets | Discarded packets |
| A | 0 | 84 | 0 |
| B | 0 | 84 | 0 |
| C | 0 | 84 | 0 |
| D | 0 | 84 | 0 |
| Mode M0 | |||
|---|---|---|---|
| Quadrant | BADHDUFLAG | Total packets | Discarded packets |
| A | 0 | 8647 | 0 |
| B | 0 | 8866 | 0 |
| C | 0 | 8413 | 0 |
| D | 0 | 10806 | 0 |
| Quadrant | Total seconds | Saturated seconds | Saturation percentage |
|---|---|---|---|
| A | 4181 | 3 | 0.071753% |
| B | 4181 | 20 | 0.478354% |
| C | 4181 | 2 | 0.047835% |
| D | 4181 | 182 | 4.353026% |
Noise dominated data is calculated using 1-second bins in cleaned event files. If a bin has >2000 counts, and if more than 50% of those come from <1% of pixels, then it is considered to be noise-dominated and hence unusable.
| Quadrant | # 1 sec bins | Bins with >0 counts | Bins with >2000 counts | High rate bins dominated by noise | Noise dominated (total time) | Noise dominated (detector-on time) | Marked lightcurve |
|---|---|---|---|---|---|---|---|
| A | 4181 | 4181 | 1 | 1 | 0.02% | 0.02% | 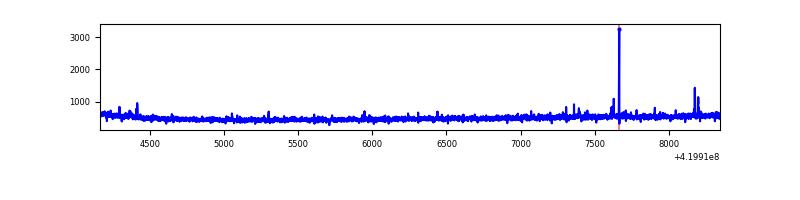 |
| B | 4181 | 4181 | 11 | 11 | 0.26% | 0.26% | 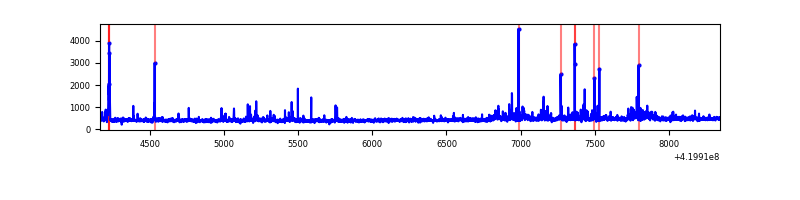 |
| C | 4181 | 4181 | 0 | 0 | 0.00% | 0.00% | 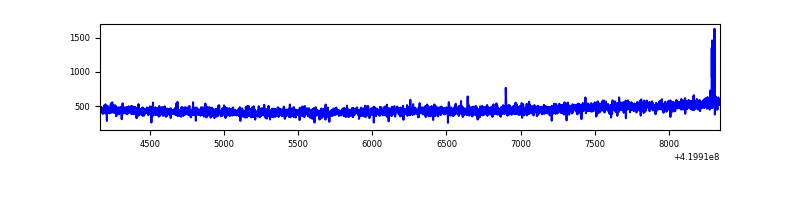 |
| D | 4181 | 4181 | 143 | 143 | 3.42% | 3.42% | 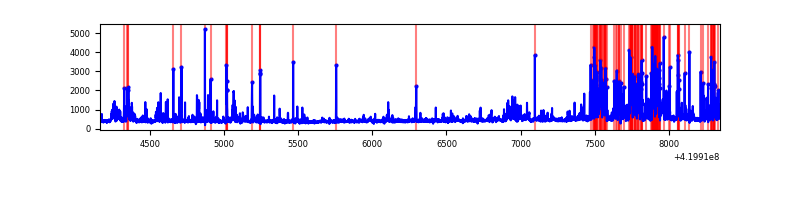 |
Top three noisy pixels from each quadrant. If the there are fewer than three noisy pixels in the level2.evt file, extra rows are filled as -1
| Pixel properties | Quadrant properties | ||||||
|---|---|---|---|---|---|---|---|
| Quadrant | DetID | PixID | Counts | Sigma | Mean | Median | Sigma |
| A | 10 | 83 | 325064 | 3545.03 | 439 | 430 | 91.6 |
| A | 15 | 252 | 11780 | 123.94 | 439 | 430 | 91.6 |
| A | 13 | 248 | 7421 | 76.34 | 439 | 430 | 91.6 |
| B | 5 | 255 | 73250 | 846.45 | 437 | 423 | 86.0 |
| B | 0 | 190 | 68131 | 786.95 | 437 | 423 | 86.0 |
| B | 0 | 245 | 37652 | 432.7 | 437 | 423 | 86.0 |
| C | 15 | 214 | 178070 | 1793.1 | 426 | 427 | 99.1 |
| C | 0 | 207 | 9401 | 90.58 | 426 | 427 | 99.1 |
| C | 3 | 233 | 5513 | 51.34 | 426 | 427 | 99.1 |
| D | 2 | 249 | 406809 | 3969.95 | 418 | 405 | 102.4 |
| D | 12 | 16 | 269763 | 2631.22 | 418 | 405 | 102.4 |
| D | 5 | 32 | 82092 | 797.96 | 418 | 405 | 102.4 |
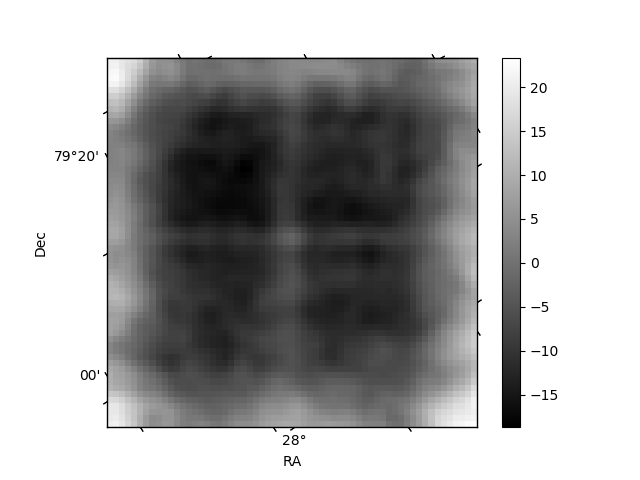
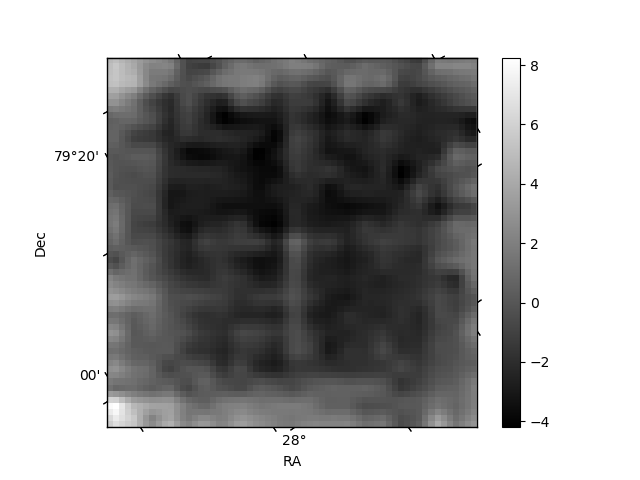
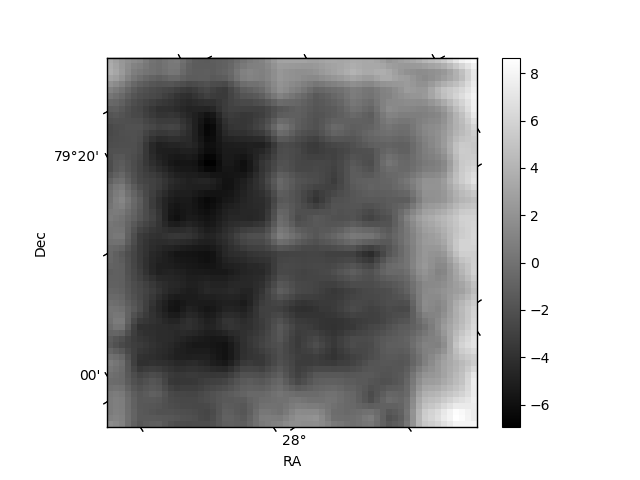
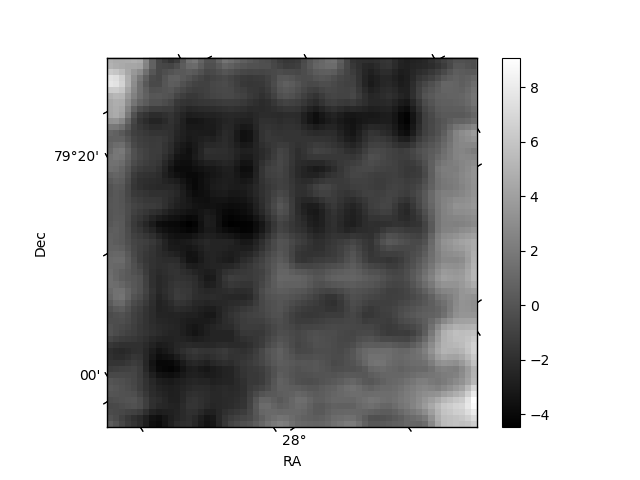
Histogram calculated using DETX and DETY for each event in the final _common_clean file
| Quadrant A | 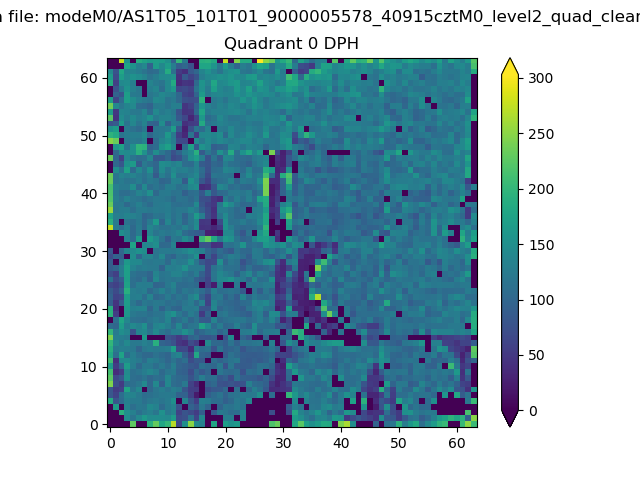 |
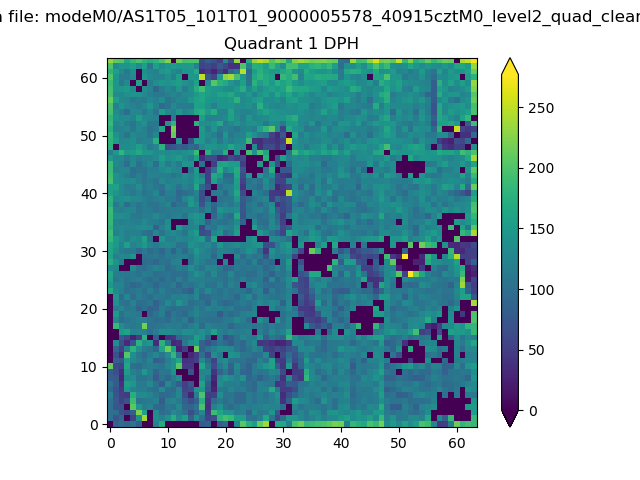 |
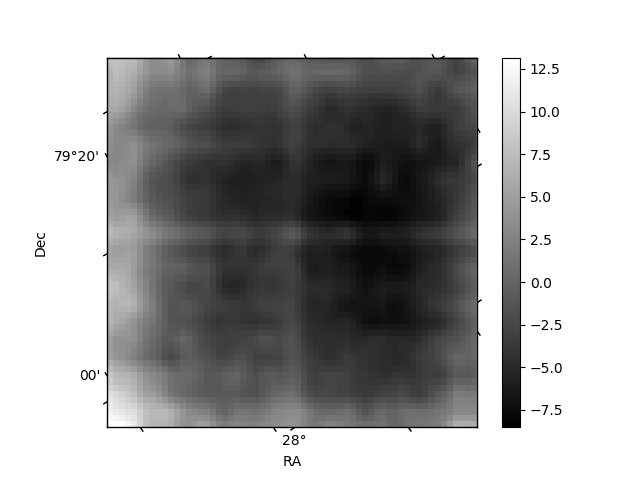
Quadrant B |
|---|---|---|---|
| Quadrant D | 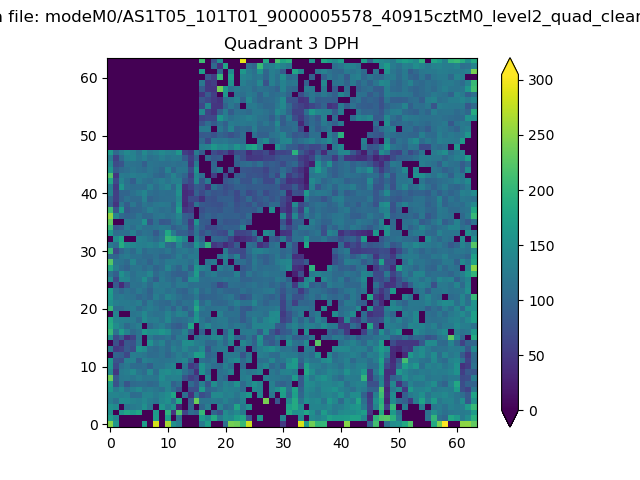 |
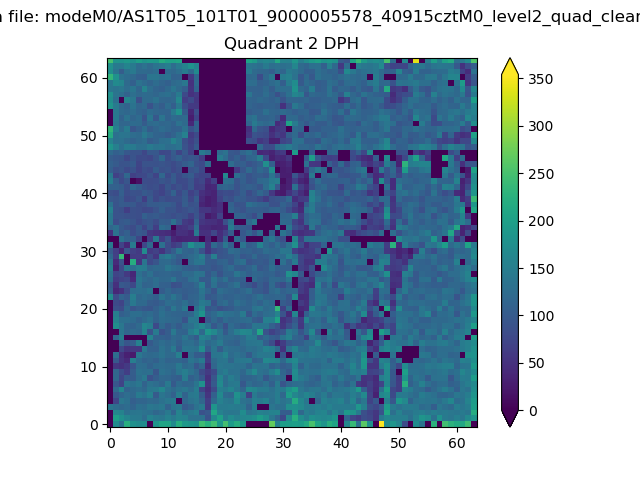 |
Quadrant C |
| Plot type | Count rate plots | Images |
|---|---|---|
| Comparison with Poisson distribution Blue bars denote a histogram of data divided into 1 sec bins. Red curve is a Poisson curve with rate = median count rate of data. |
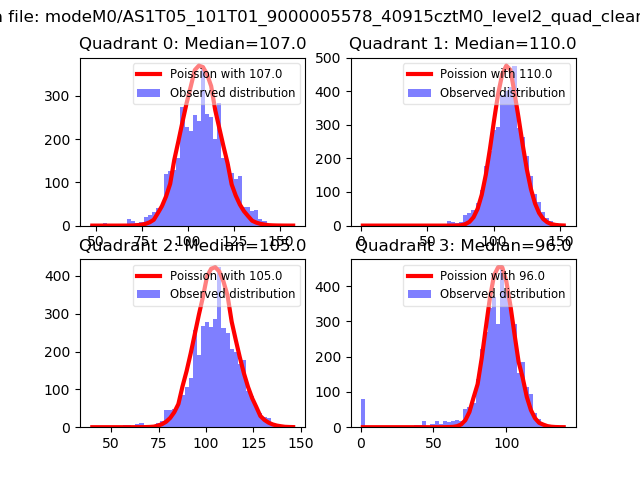 |
 |
| Quadrant-wise count rates Data is divided into 100 sec bins |
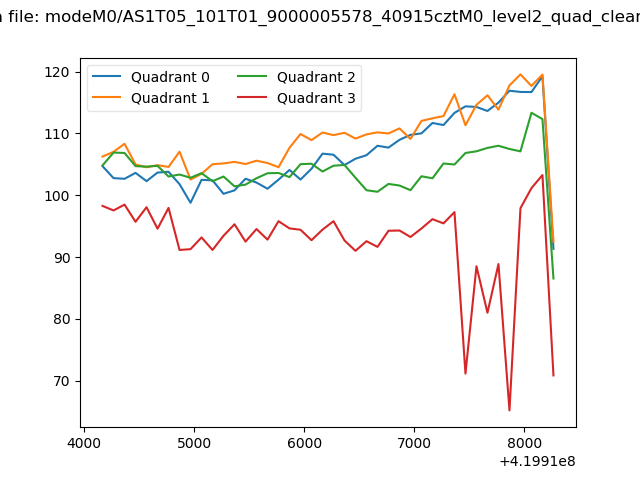 |
|
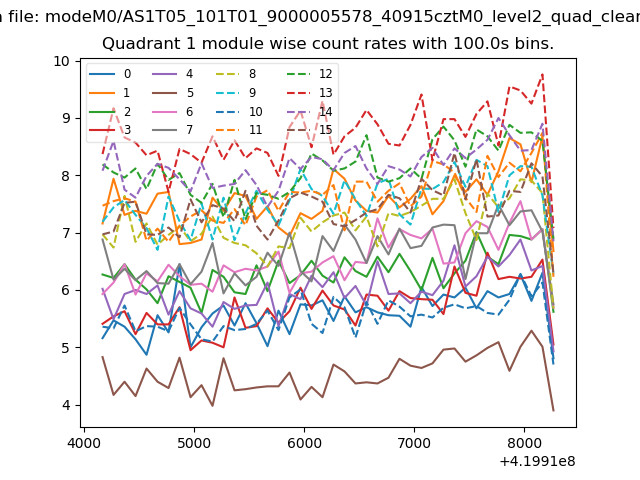
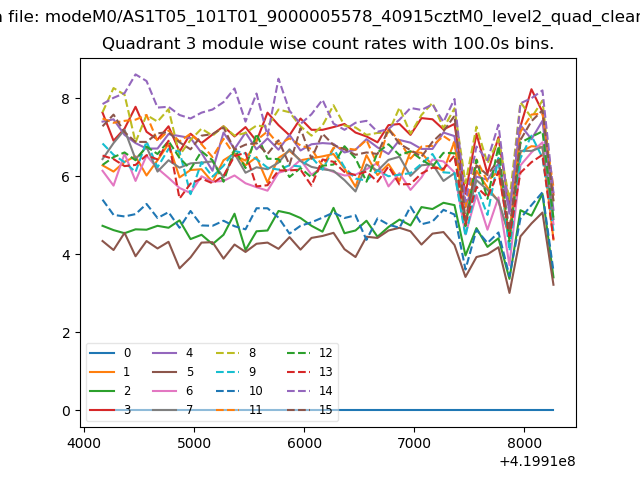
| Module-wise count rates for Quadrant A Data is divided into 100 sec bins |
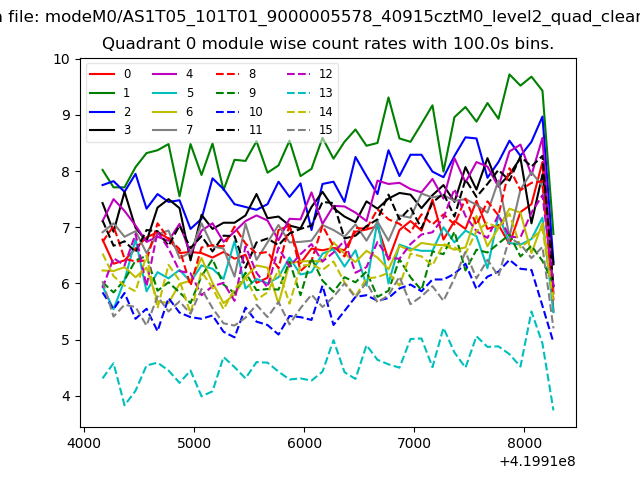 |
 |
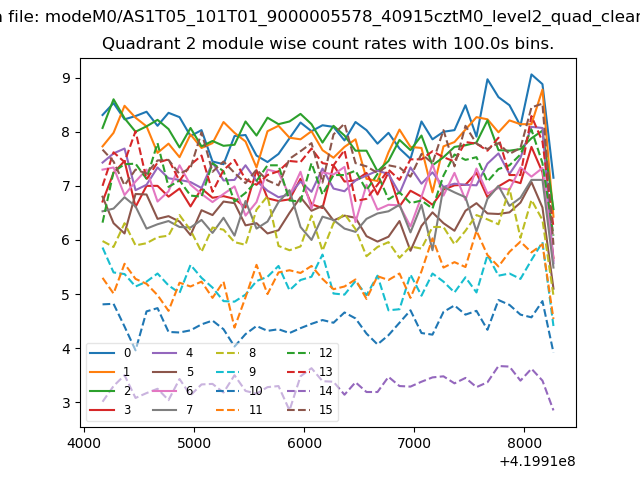
| Module-wise count rates for Quadrant B Data is divided into 100 sec bins |
 |
 |
| Module-wise count rates for Quadrant C Data is divided into 100 sec bins |
 |
 |
| Module-wise count rates for Quadrant D Data is divided into 100 sec bins |
 |
 |
| Parameter | Plot |
|---|---|
| CZT HV Monitor | 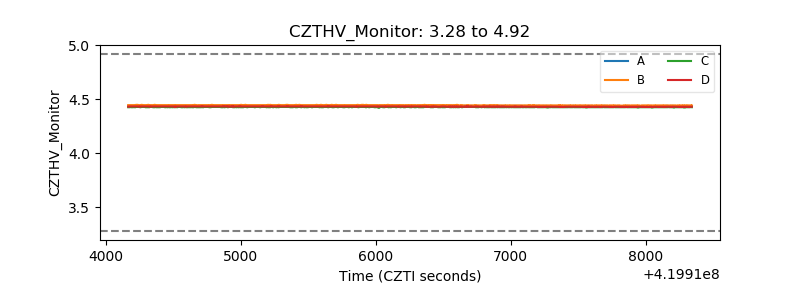 |
| D_VDD | 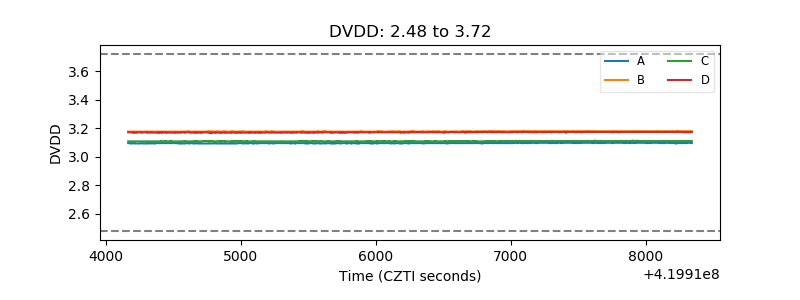 |
| Temperature 1 | 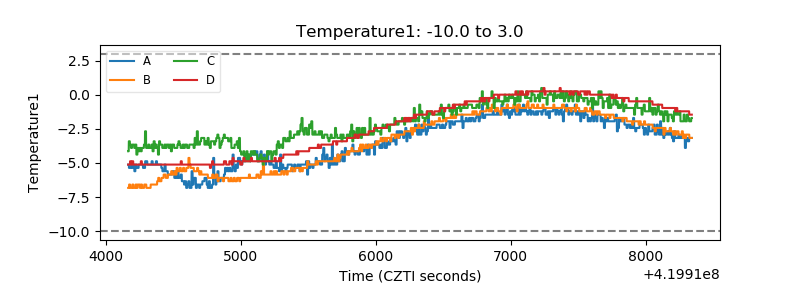 |
| Veto HV Monitor |  |
| Veto LLD | 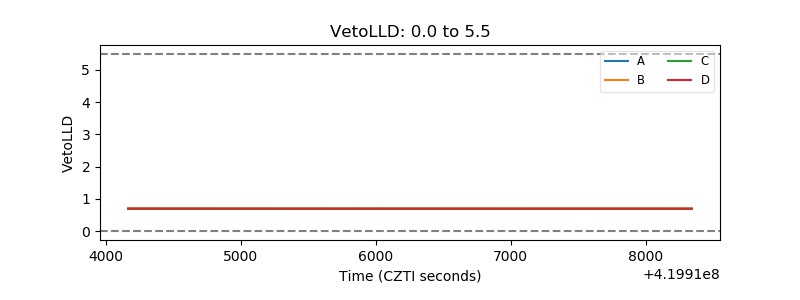 |
| Alpha Counter | 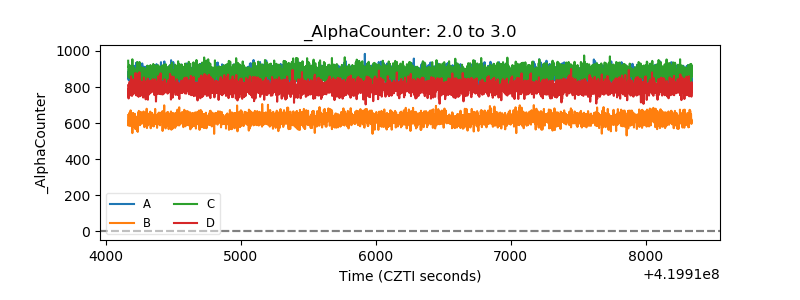 |
| _CPM_Rate | 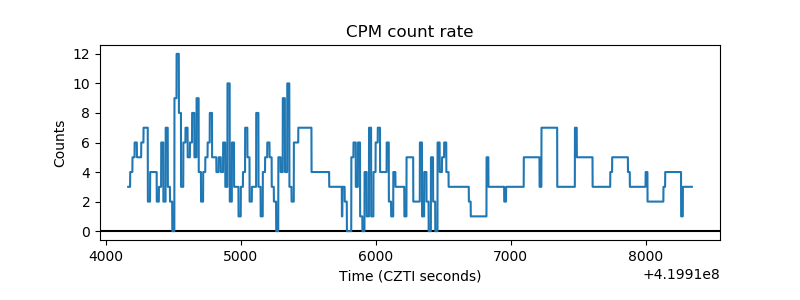 |
| CZT Counter | 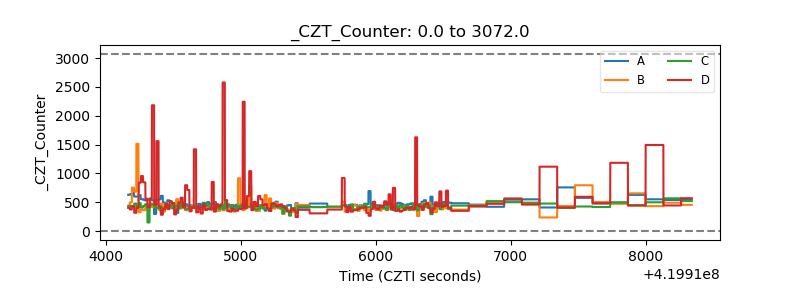 |
| +2.5 Volts monitor | 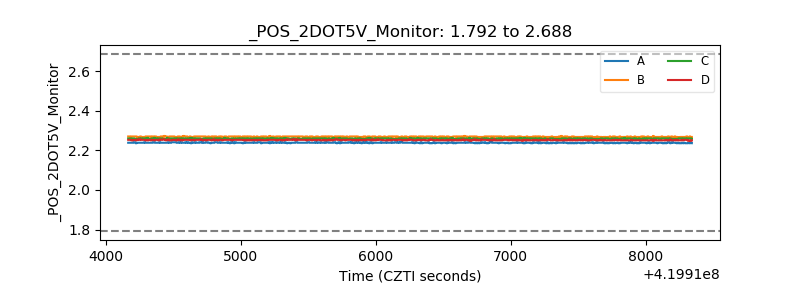 |
| +5 Volts monitor | 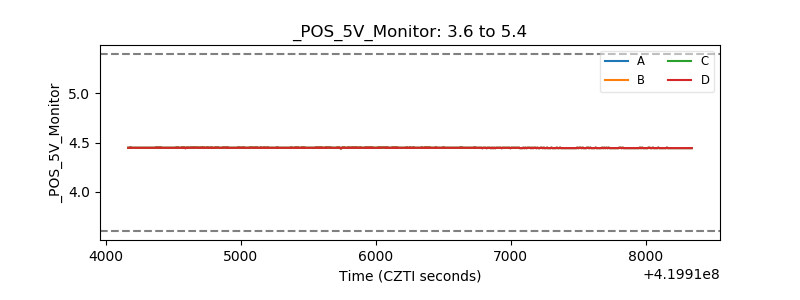 |
| _ROLL_ROT | 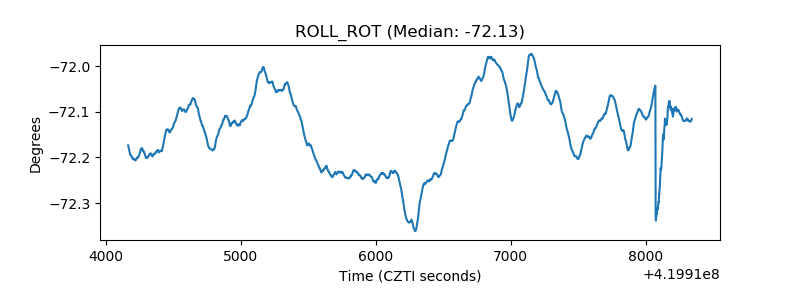 |
| _Roll_DEC | 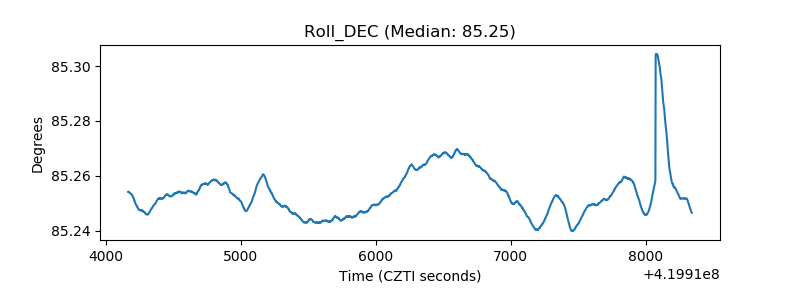 |
| _Roll_RA | 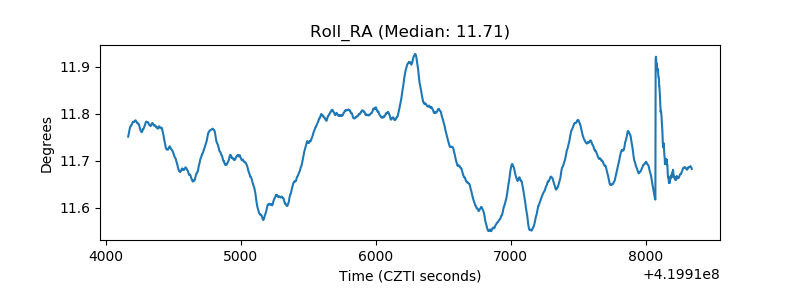 |
| Veto Counter | 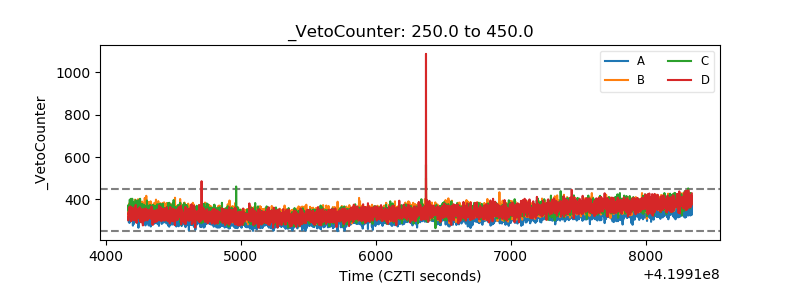 |