| Param | Original file | Final file |
|---|---|---|
| Filename | modeM0/AS1A12_044T19_9000005580_40915cztM0_level2.fits | modeM0/AS1A12_044T19_9000005580_40915cztM0_level2_quad_clean.evt |
| Size (bytes) | 47,347,200 | 13,610,880 |
| Size | 45.2 MB | 13.0 MB |
| Events in quadrant A | 492,020 | 89,386 |
| Events in quadrant B | 369,030 | 91,810 |
| Events in quadrant C | 413,073 | 84,874 |
| Events in quadrant D | 409,204 | 79,733 |
| Mode M9 | |||
|---|---|---|---|
| Quadrant | BADHDUFLAG | Total packets | Discarded packets |
| A | 0 | 8 | 0 |
| B | 0 | 8 | 0 |
| C | 0 | 8 | 0 |
| D | 0 | 8 | 0 |
| Mode SS | |||
|---|---|---|---|
| Quadrant | BADHDUFLAG | Total packets | Discarded packets |
| A | 0 | 18 | 0 |
| B | 0 | 18 | 0 |
| C | 0 | 18 | 0 |
| D | 0 | 18 | 0 |
| Mode M0 | |||
|---|---|---|---|
| Quadrant | BADHDUFLAG | Total packets | Discarded packets |
| A | 0 | 1972 | 2 |
| B | 0 | 1704 | 1 |
| C | 0 | 1768 | 1 |
| D | 0 | 1841 | 1 |
| Quadrant | Total seconds | Saturated seconds | Saturation percentage |
|---|---|---|---|
| A | 846 | 4 | 0.472813% |
| B | 846 | 1 | 0.118203% |
| C | 846 | 5 | 0.591017% |
| D | 846 | 11 | 1.300236% |
Noise dominated data is calculated using 1-second bins in cleaned event files. If a bin has >2000 counts, and if more than 50% of those come from <1% of pixels, then it is considered to be noise-dominated and hence unusable.
| Quadrant | # 1 sec bins | Bins with >0 counts | Bins with >2000 counts | High rate bins dominated by noise | Noise dominated (total time) | Noise dominated (detector-on time) | Marked lightcurve |
|---|---|---|---|---|---|---|---|
| A | 846 | 846 | 0 | 0 | 0.00% | 0.00% | 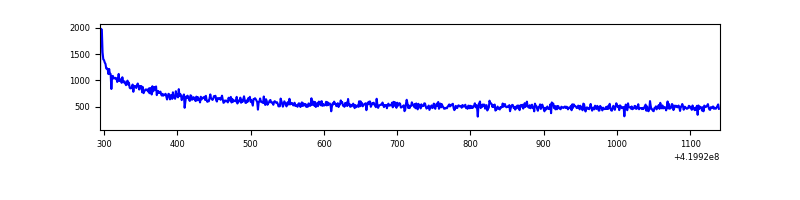 |
| B | 846 | 846 | 0 | 0 | 0.00% | 0.00% | 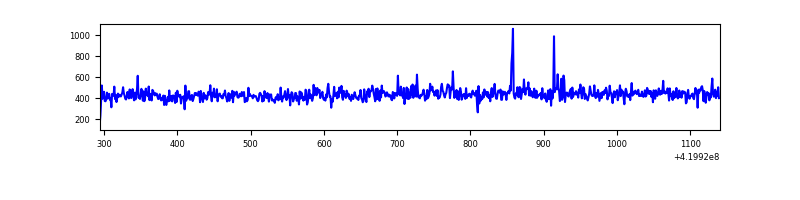 |
| C | 846 | 846 | 3 | 3 | 0.35% | 0.35% | 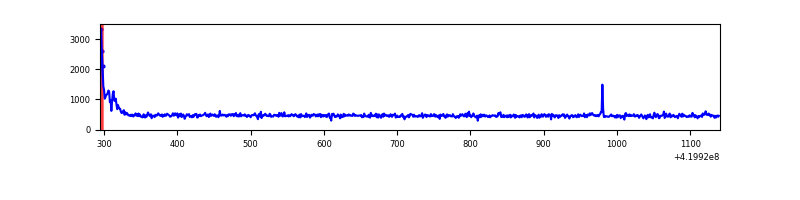 |
| D | 846 | 846 | 5 | 5 | 0.59% | 0.59% | 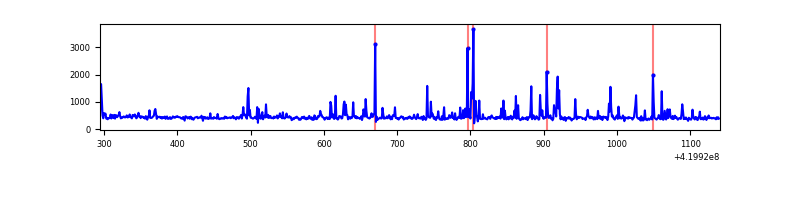 |
Top three noisy pixels from each quadrant. If the there are fewer than three noisy pixels in the level2.evt file, extra rows are filled as -1
| Pixel properties | Quadrant properties | ||||||
|---|---|---|---|---|---|---|---|
| Quadrant | DetID | PixID | Counts | Sigma | Mean | Median | Sigma |
| A | 10 | 83 | 142794 | 6982.87 | 89 | 87 | 20.4 |
| A | 10 | 67 | 1368 | 62.68 | 89 | 87 | 20.4 |
| A | 13 | 254 | 1363 | 62.44 | 89 | 87 | 20.4 |
| B | 0 | 190 | 6791 | 337.71 | 91 | 88 | 19.8 |
| B | 3 | 209 | 2777 | 135.48 | 91 | 88 | 19.8 |
| B | 12 | 111 | 2389 | 115.93 | 91 | 88 | 19.8 |
| C | 15 | 214 | 39968 | 1721.13 | 88 | 88 | 23.2 |
| C | 0 | 10 | 24481 | 1052.75 | 88 | 88 | 23.2 |
| C | 1 | 23 | 2932 | 122.74 | 88 | 88 | 23.2 |
| D | 12 | 6 | 50085 | 2176.8 | 86 | 83 | 23.0 |
| D | 12 | 233 | 15239 | 659.81 | 86 | 83 | 23.0 |
| D | 1 | 52 | 6925 | 297.86 | 86 | 83 | 23.0 |
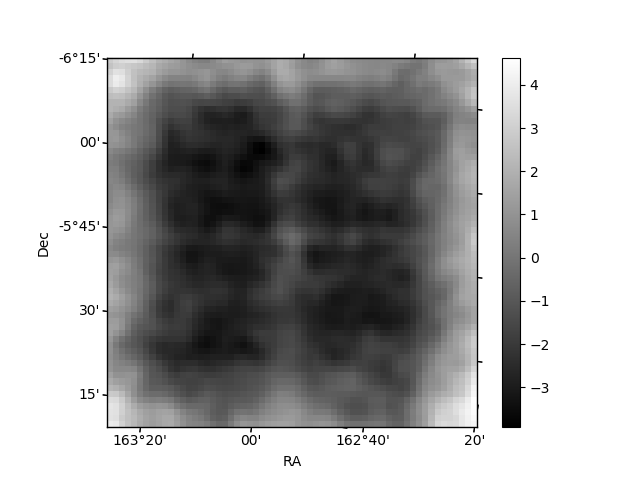
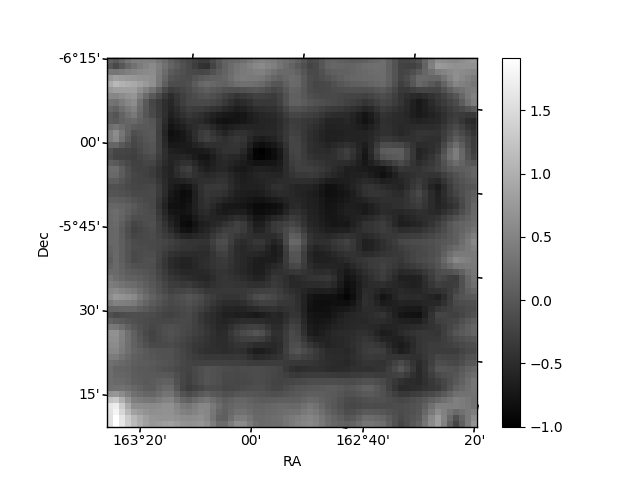
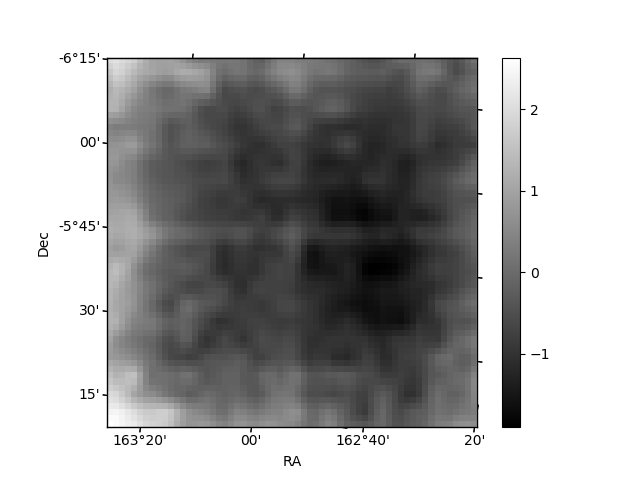
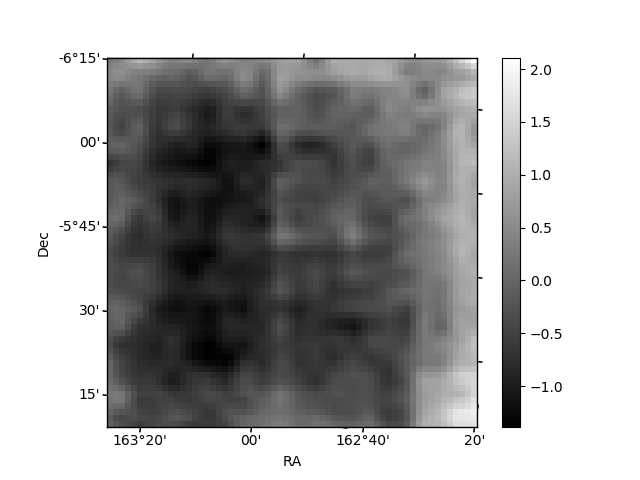
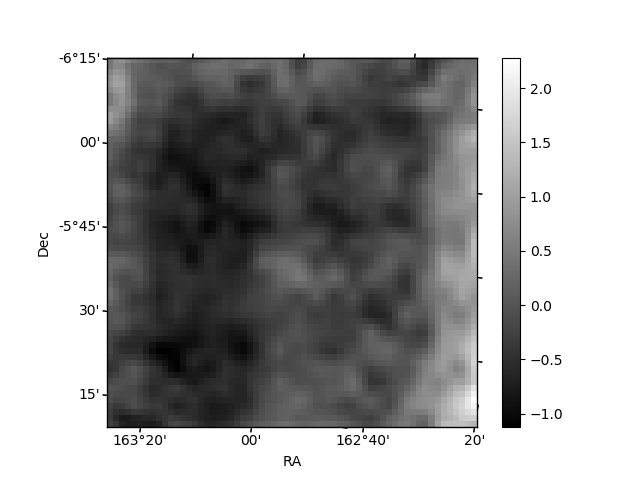
Histogram calculated using DETX and DETY for each event in the final _common_clean file
| Quadrant A | 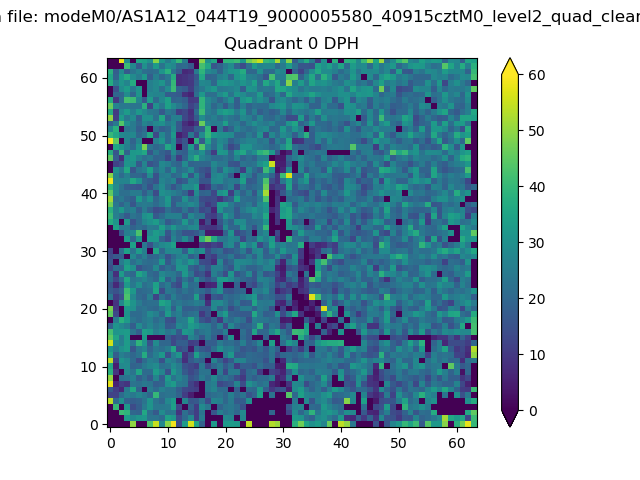 |
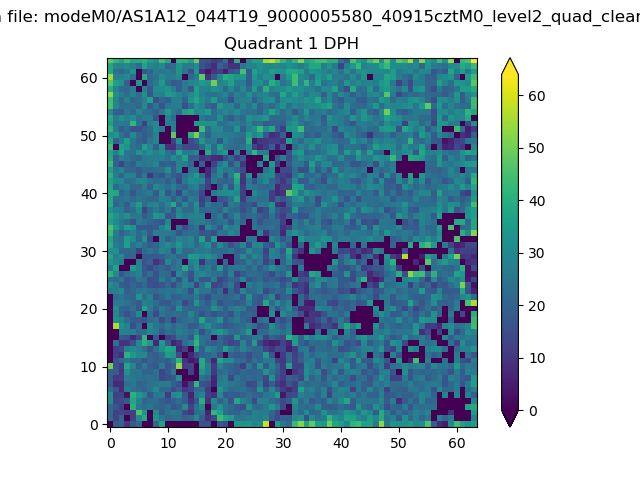 |
Quadrant B |
|---|---|---|---|
| Quadrant D | 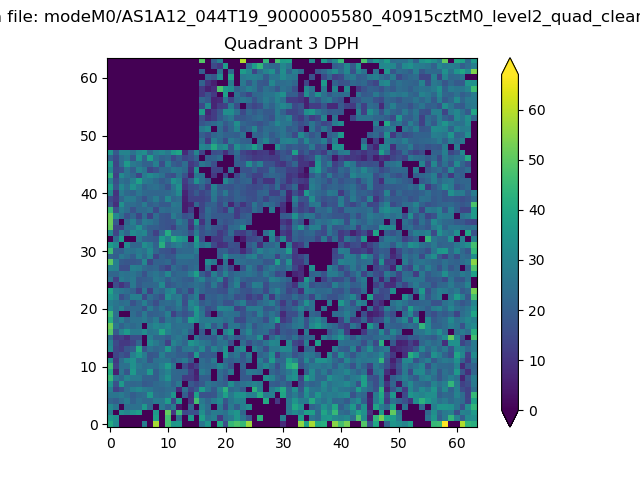 |
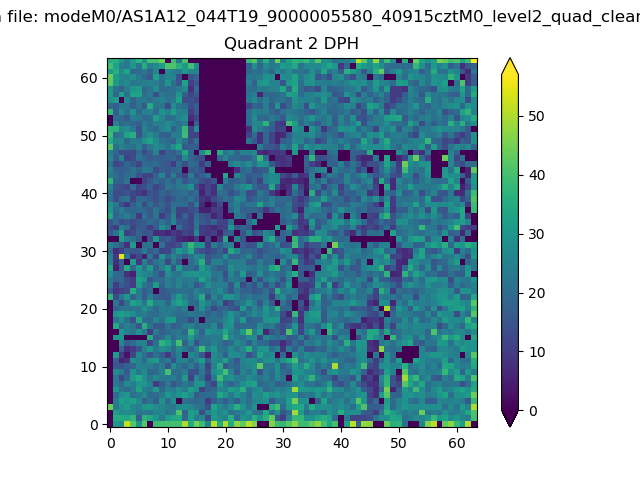 |
Quadrant C |
| Plot type | Count rate plots | Images |
|---|---|---|
| Comparison with Poisson distribution Blue bars denote a histogram of data divided into 1 sec bins. Red curve is a Poisson curve with rate = median count rate of data. |
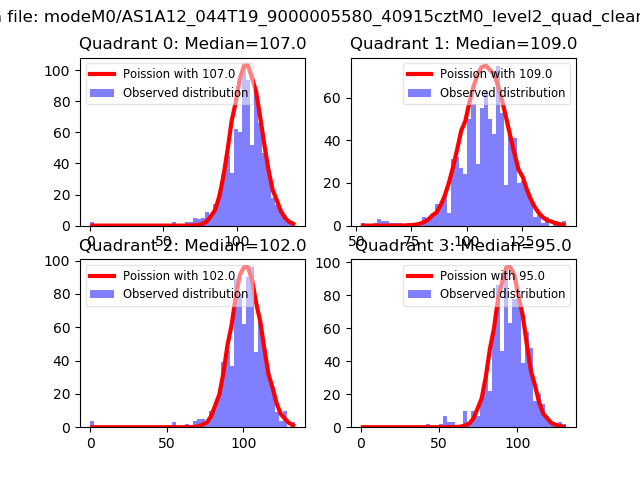 |
 |
| Quadrant-wise count rates Data is divided into 100 sec bins |
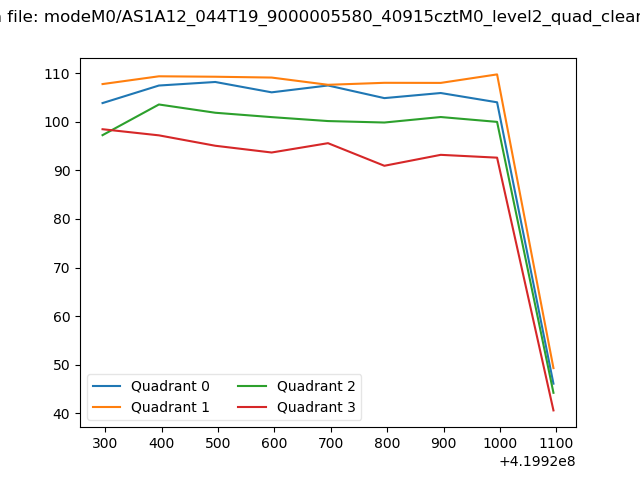 |
|
| Module-wise count rates for Quadrant A Data is divided into 100 sec bins |
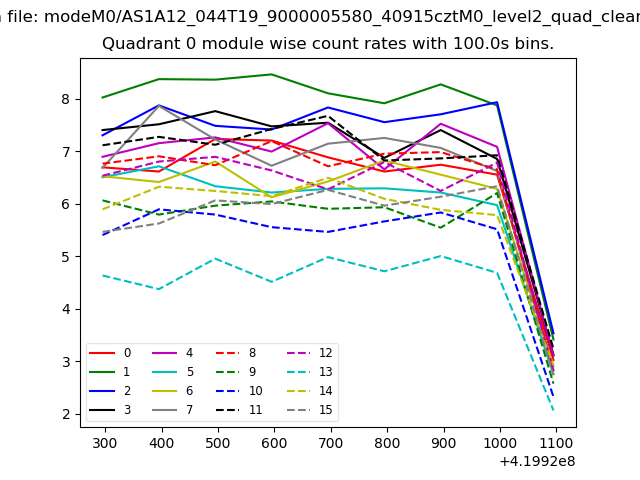 |
 |
| Module-wise count rates for Quadrant B Data is divided into 100 sec bins |
 |
 |
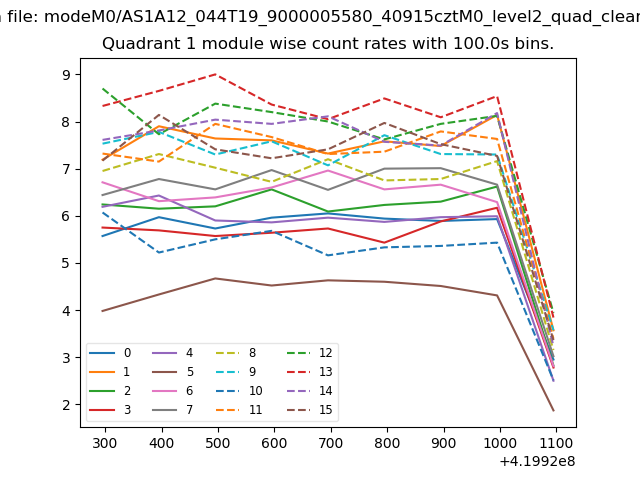
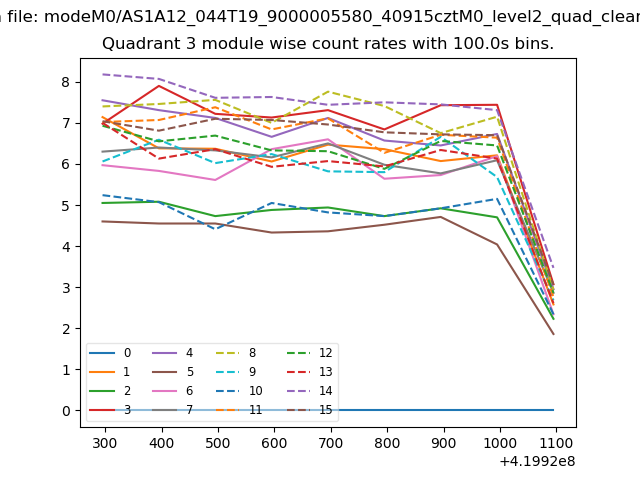
| Module-wise count rates for Quadrant C Data is divided into 100 sec bins |
 |
 |
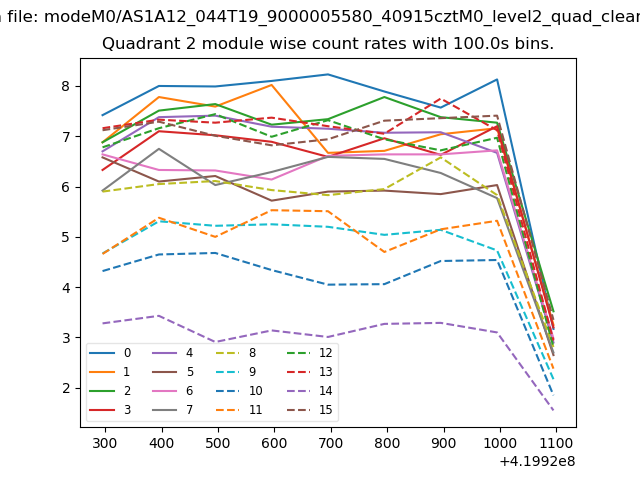
| Module-wise count rates for Quadrant D Data is divided into 100 sec bins |
 |
 |
| Parameter | Plot |
|---|---|
| CZT HV Monitor | 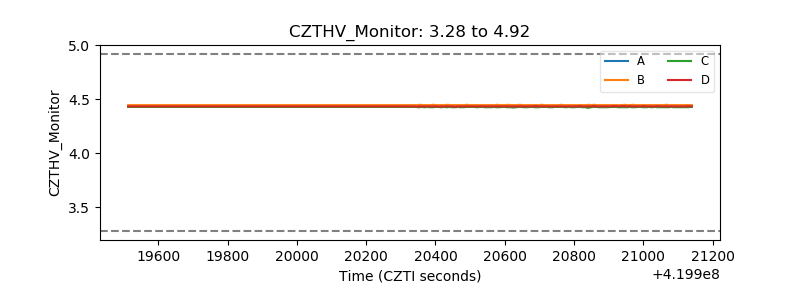 |
| D_VDD | 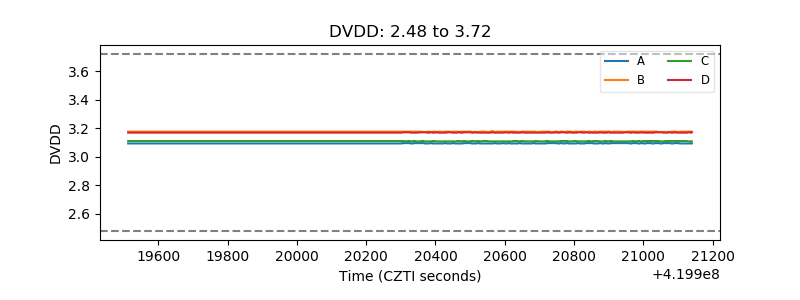 |
| Temperature 1 | 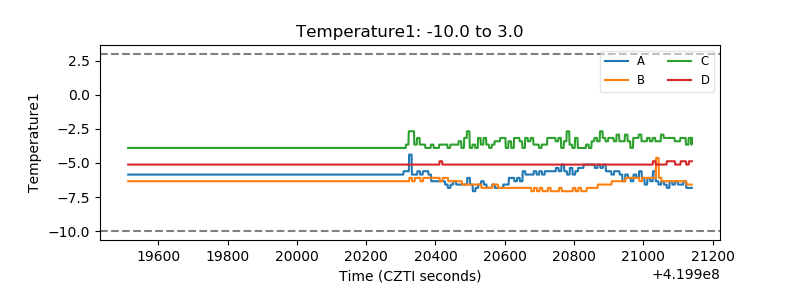 |
| Veto HV Monitor | 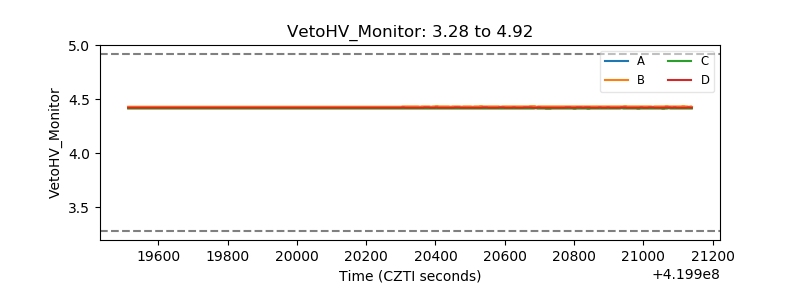 |
| Veto LLD | 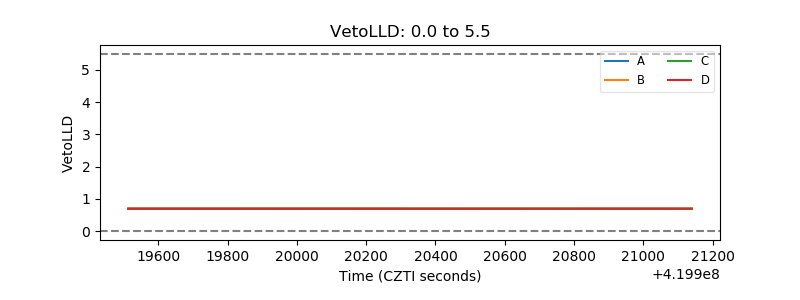 |
| Alpha Counter | 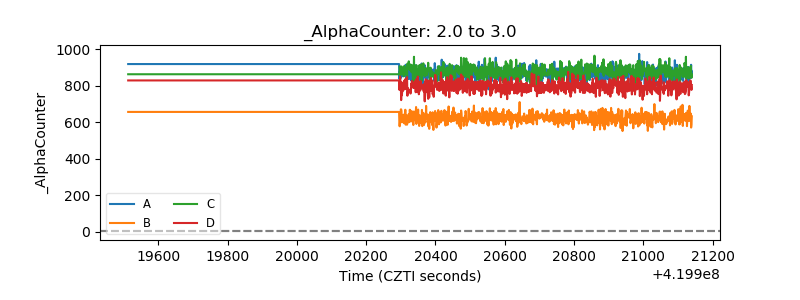 |
| _CPM_Rate |  |
| CZT Counter | 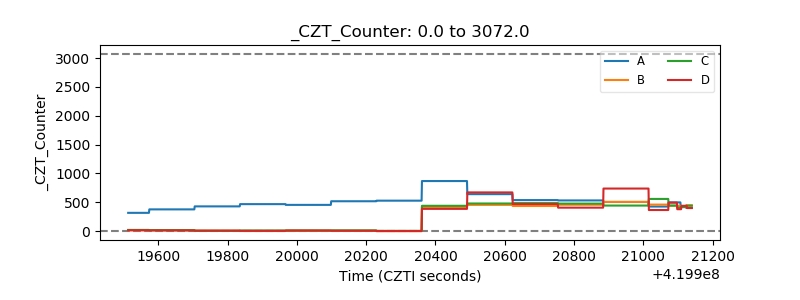 |
| +2.5 Volts monitor | 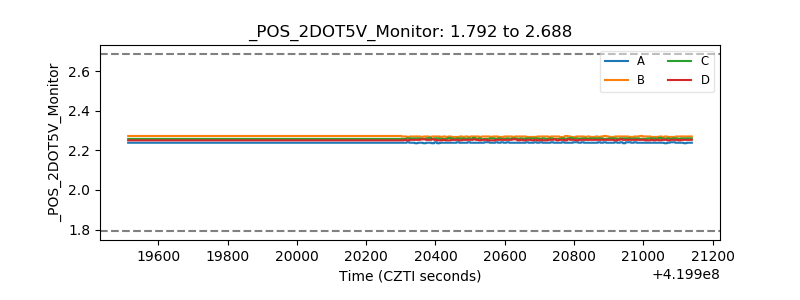 |
| +5 Volts monitor | 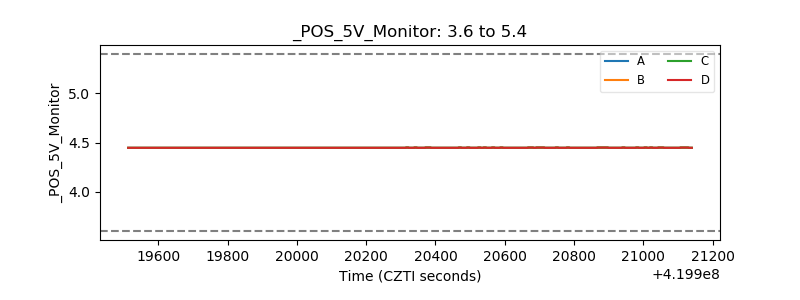 |
| _ROLL_ROT | 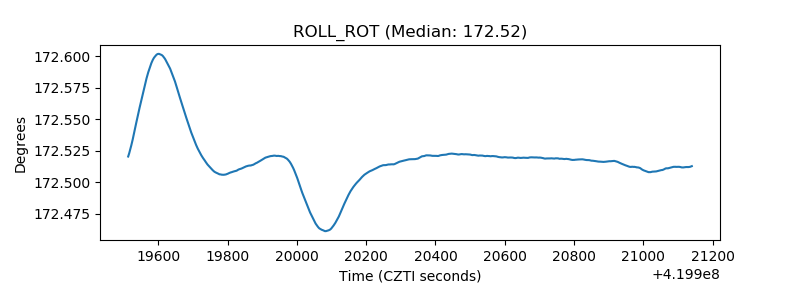 |
| _Roll_DEC | 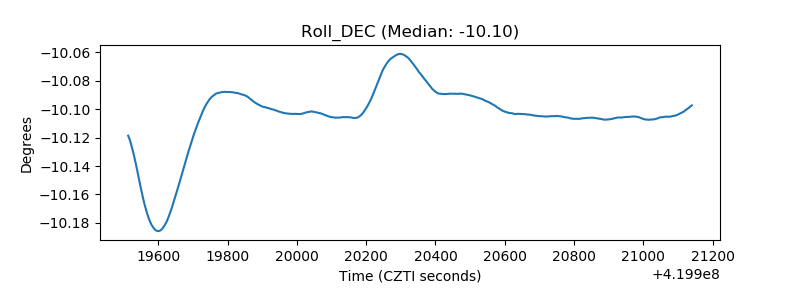 |
| _Roll_RA | 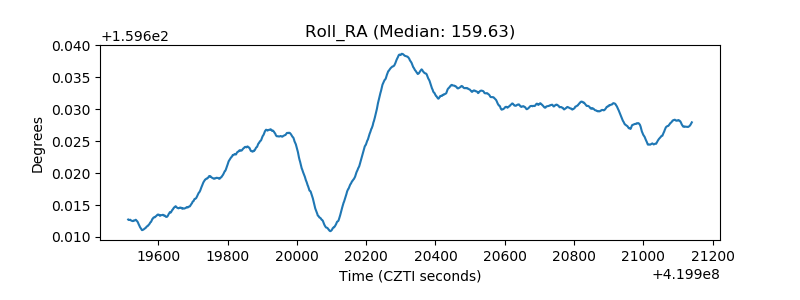 |
| Veto Counter | 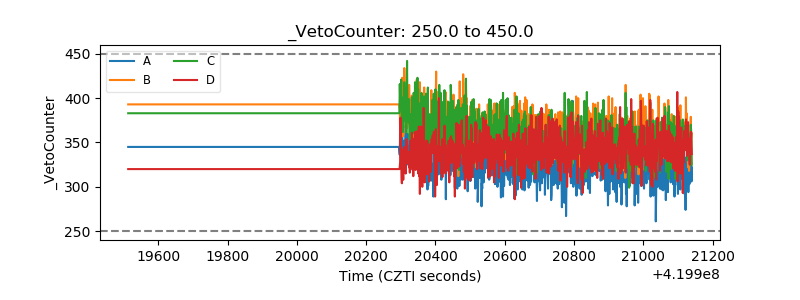 |