| Param | Original file | Final file |
|---|---|---|
| Filename | modeM0/AS1A12_044T19_9000005580_40918cztM0_level2.fits | modeM0/AS1A12_044T19_9000005580_40918cztM0_level2_quad_clean.evt |
| Size (bytes) | 893,592,000 | 246,381,120 |
| Size | 852.2 MB | 235.0 MB |
| Events in quadrant A | 8,146,715 | 1,647,903 |
| Events in quadrant B | 7,010,129 | 1,696,639 |
| Events in quadrant C | 7,385,762 | 1,592,358 |
| Events in quadrant D | 9,329,581 | 1,448,855 |
| Mode M9 | |||
|---|---|---|---|
| Quadrant | BADHDUFLAG | Total packets | Discarded packets |
| A | 0 | 49 | 0 |
| B | 0 | 49 | 0 |
| C | 0 | 49 | 0 |
| D | 0 | 49 | 0 |
| Mode SS | |||
|---|---|---|---|
| Quadrant | BADHDUFLAG | Total packets | Discarded packets |
| A | 0 | 320 | 0 |
| B | 0 | 320 | 0 |
| C | 0 | 320 | 0 |
| D | 0 | 320 | 0 |
| Mode M0 | |||
|---|---|---|---|
| Quadrant | BADHDUFLAG | Total packets | Discarded packets |
| A | 0 | 32899 | 5 |
| B | 0 | 31527 | 4 |
| C | 0 | 31671 | 4 |
| D | 0 | 38501 | 4 |
| Quadrant | Total seconds | Saturated seconds | Saturation percentage |
|---|---|---|---|
| A | 15553 | 30 | 0.192889% |
| B | 15553 | 26 | 0.167170% |
| C | 15553 | 53 | 0.340770% |
| D | 15553 | 428 | 2.751881% |
Noise dominated data is calculated using 1-second bins in cleaned event files. If a bin has >2000 counts, and if more than 50% of those come from <1% of pixels, then it is considered to be noise-dominated and hence unusable.
| Quadrant | # 1 sec bins | Bins with >0 counts | Bins with >2000 counts | High rate bins dominated by noise | Noise dominated (total time) | Noise dominated (detector-on time) | Marked lightcurve |
|---|---|---|---|---|---|---|---|
| A | 19765 | 15556 | 7 | 7 | 0.04% | 0.04% | 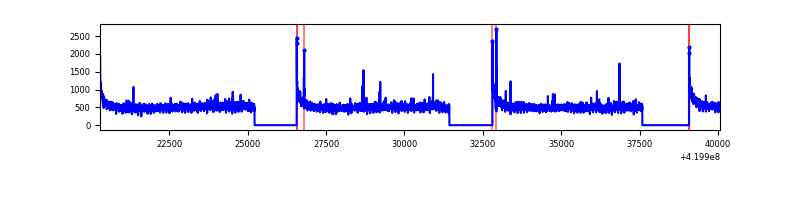 |
| B | 19765 | 15556 | 10 | 10 | 0.05% | 0.06% | 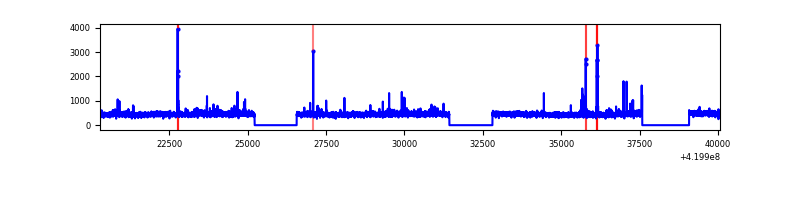 |
| C | 19765 | 15556 | 37 | 37 | 0.19% | 0.24% | 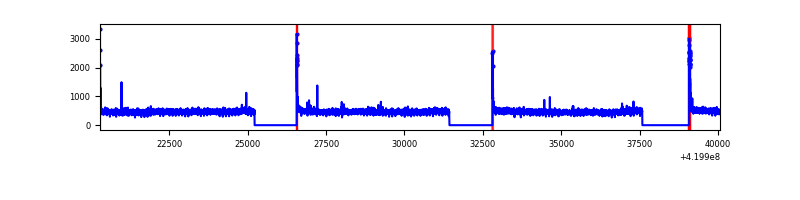 |
| D | 19765 | 15556 | 355 | 355 | 1.80% | 2.28% | 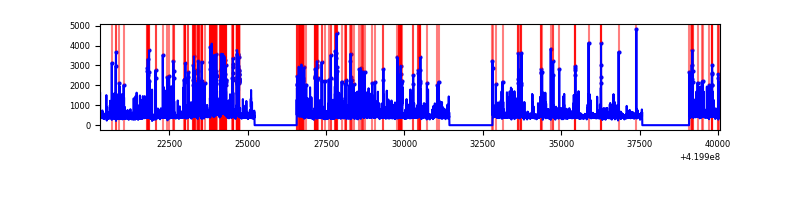 |
Top three noisy pixels from each quadrant. If the there are fewer than three noisy pixels in the level2.evt file, extra rows are filled as -1
| Pixel properties | Quadrant properties | ||||||
|---|---|---|---|---|---|---|---|
| Quadrant | DetID | PixID | Counts | Sigma | Mean | Median | Sigma |
| A | 10 | 83 | 1383647 | 3872.19 | 1734 | 1695 | 356.9 |
| A | 10 | 255 | 36553 | 97.67 | 1734 | 1695 | 356.9 |
| A | 13 | 254 | 23087 | 59.94 | 1734 | 1695 | 356.9 |
| B | 15 | 85 | 76527 | 224.09 | 1723 | 1677 | 334.0 |
| B | 5 | 255 | 71493 | 209.02 | 1723 | 1677 | 334.0 |
| B | 12 | 111 | 42865 | 123.31 | 1723 | 1677 | 334.0 |
| C | 15 | 214 | 657136 | 1687.15 | 1674 | 1683 | 388.5 |
| C | 0 | 10 | 159924 | 407.32 | 1674 | 1683 | 388.5 |
| C | 10 | 70 | 17593 | 40.95 | 1674 | 1683 | 388.5 |
| D | 2 | 249 | 805504 | 1957.7 | 1666 | 1618 | 410.6 |
| D | 12 | 233 | 650256 | 1579.62 | 1666 | 1618 | 410.6 |
| D | 12 | 16 | 426260 | 1034.13 | 1666 | 1618 | 410.6 |
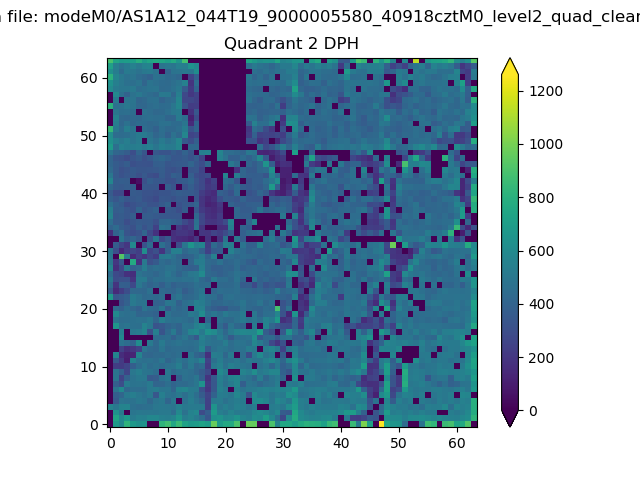
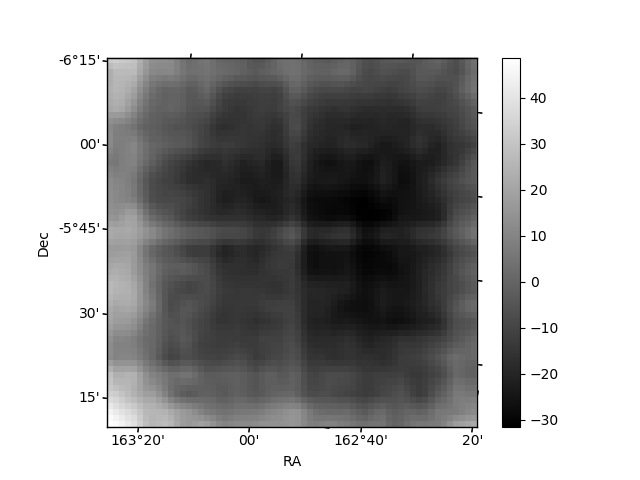
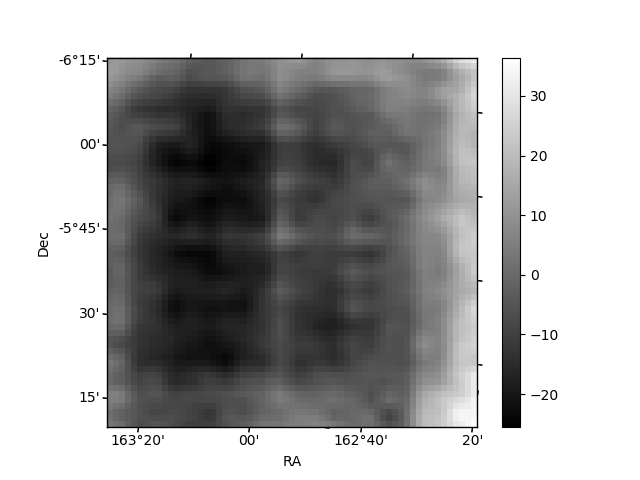
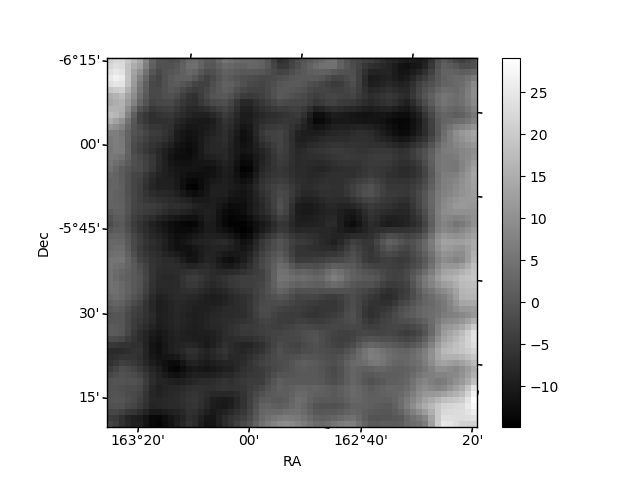
Histogram calculated using DETX and DETY for each event in the final _common_clean file
| Quadrant A | 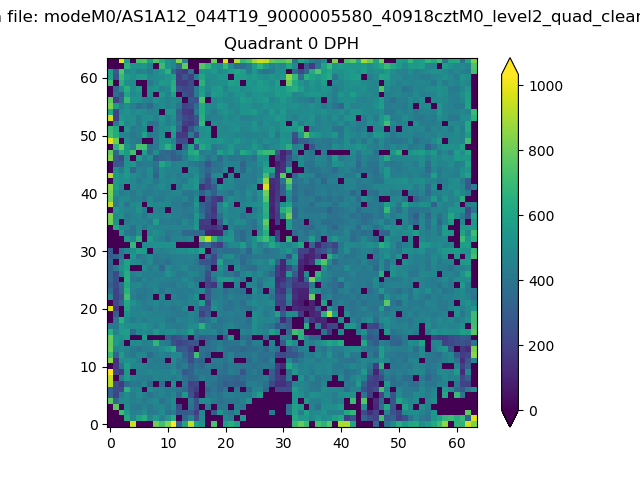 |
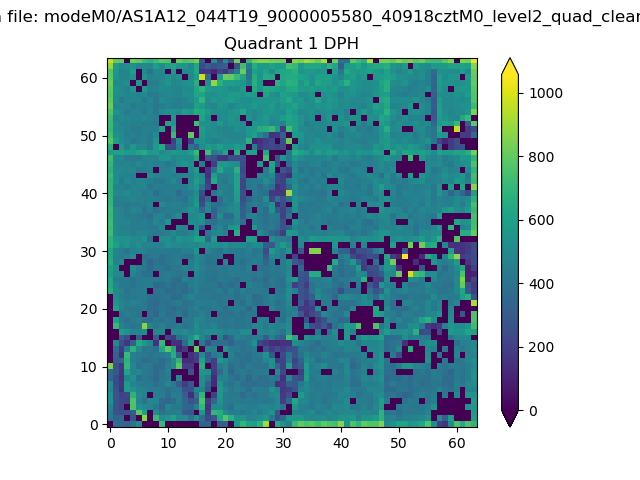 |
Quadrant B |
|---|---|---|---|
| Quadrant D | 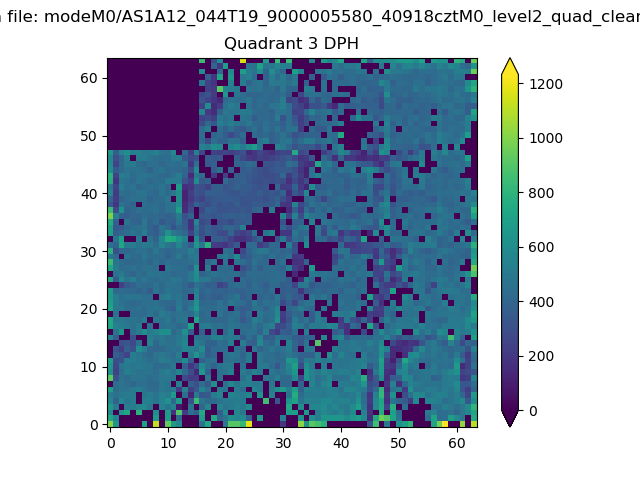 |
 |
Quadrant C |
| Plot type | Count rate plots | Images |
|---|---|---|
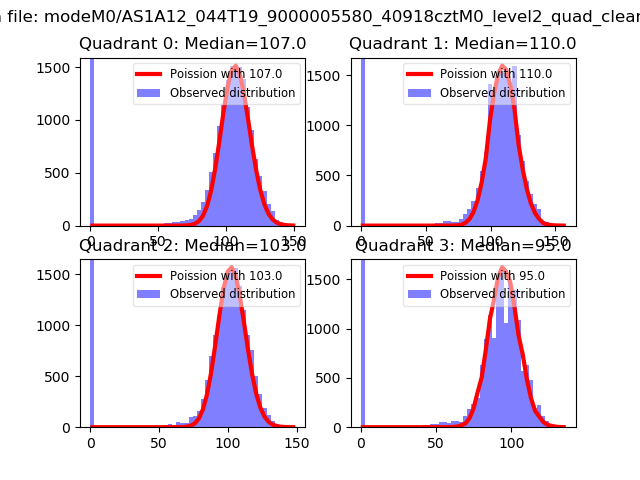
| Comparison with Poisson distribution Blue bars denote a histogram of data divided into 1 sec bins. Red curve is a Poisson curve with rate = median count rate of data. |
 |
 |
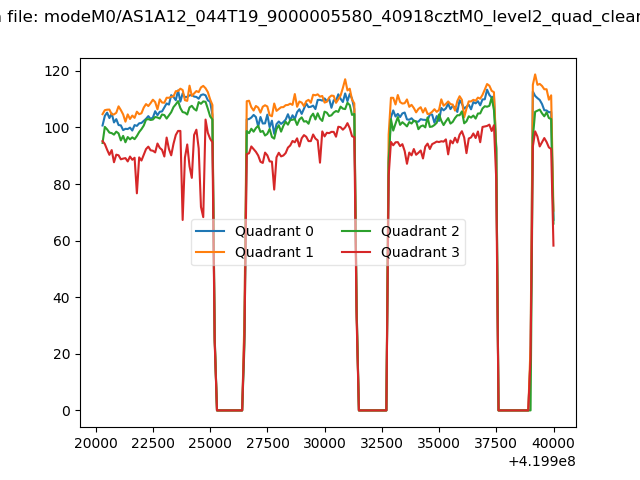
| Quadrant-wise count rates Data is divided into 100 sec bins |
 |
|
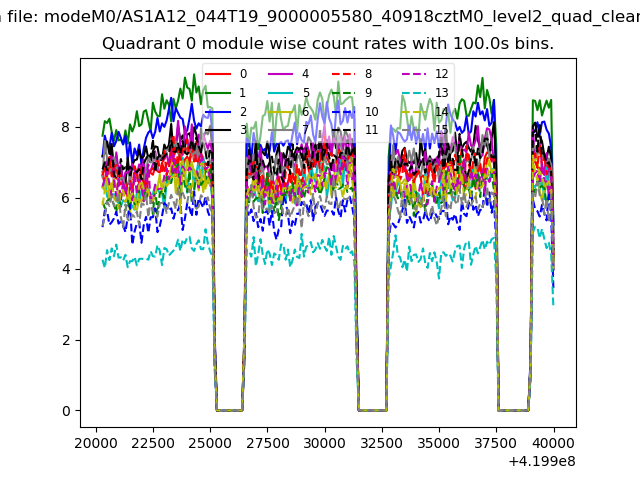
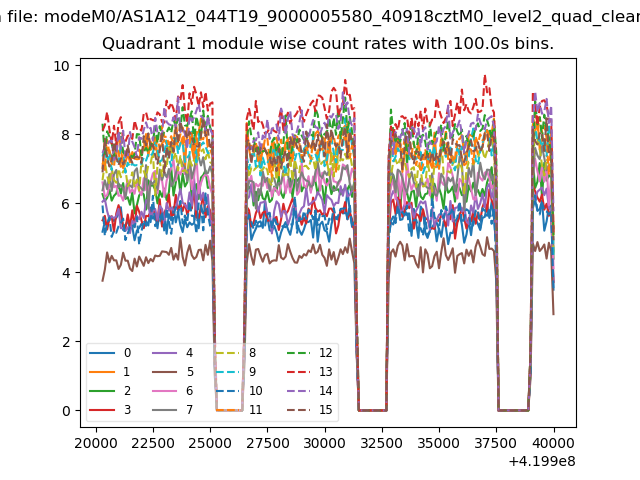
| Module-wise count rates for Quadrant A Data is divided into 100 sec bins |
 |
 |
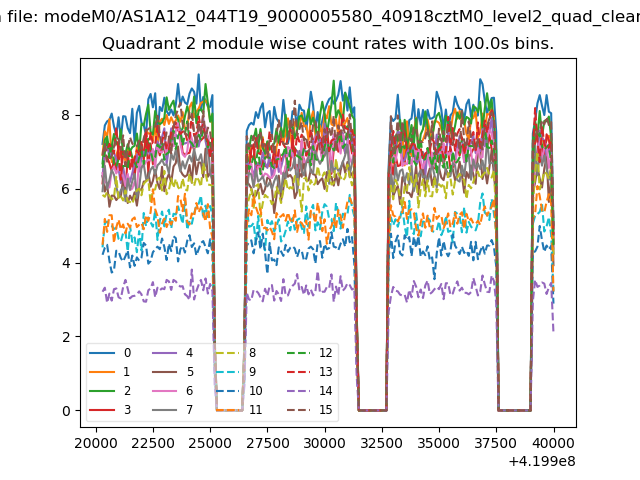
| Module-wise count rates for Quadrant B Data is divided into 100 sec bins |
 |
 |
| Module-wise count rates for Quadrant C Data is divided into 100 sec bins |
 |
 |
| Module-wise count rates for Quadrant D Data is divided into 100 sec bins |
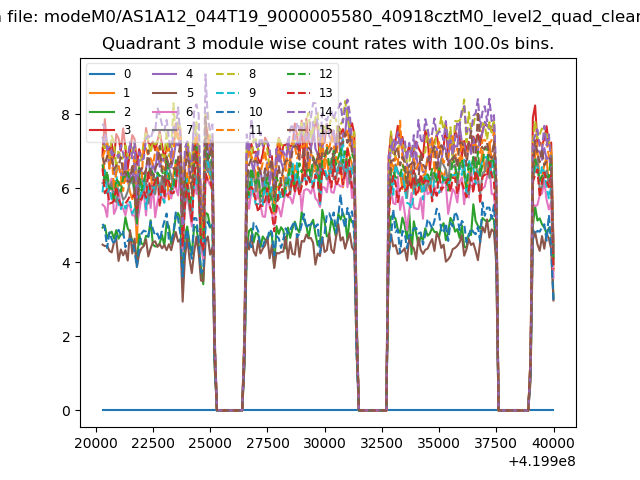 |
 |
| Parameter | Plot |
|---|---|
| CZT HV Monitor | 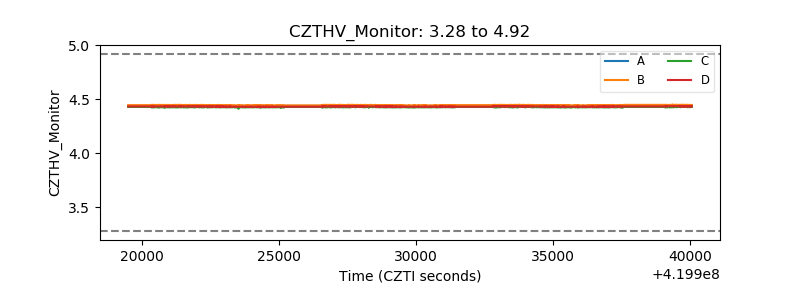 |
| D_VDD | 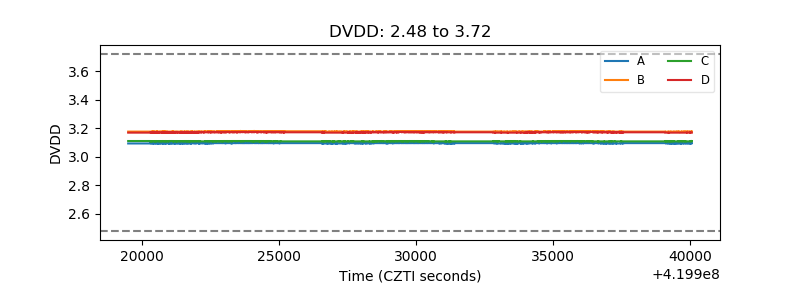 |
| Temperature 1 | 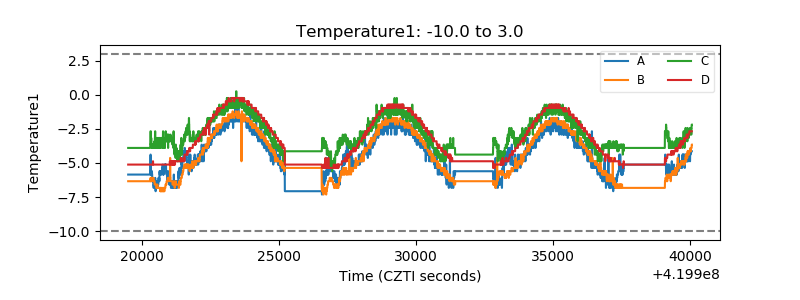 |
| Veto HV Monitor | 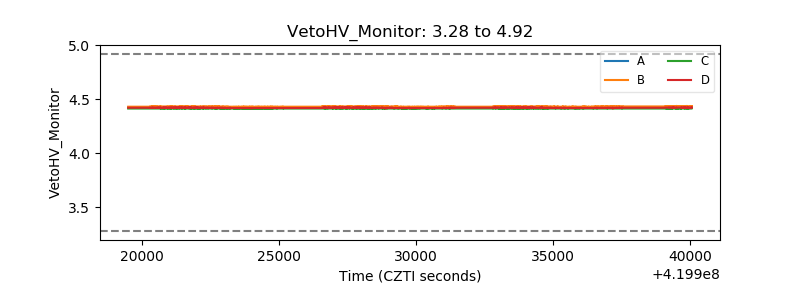 |
| Veto LLD | 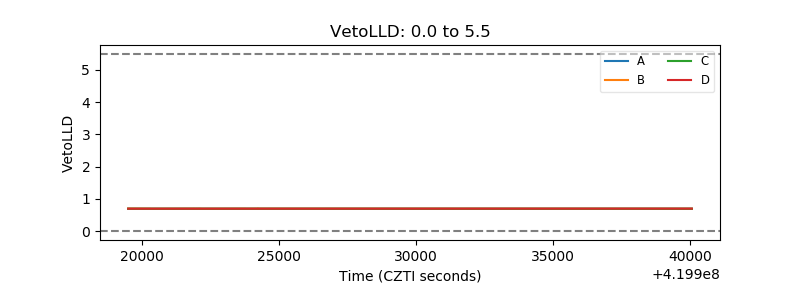 |
| Alpha Counter | 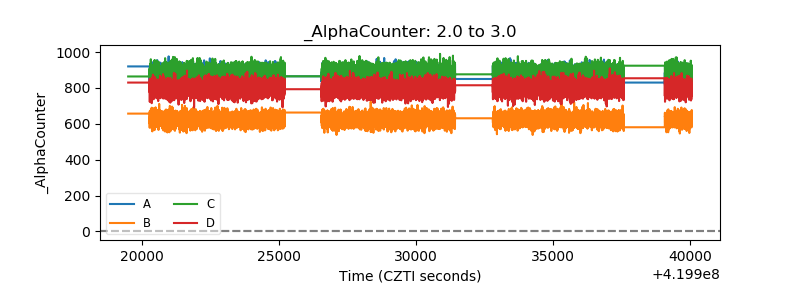 |
| _CPM_Rate | 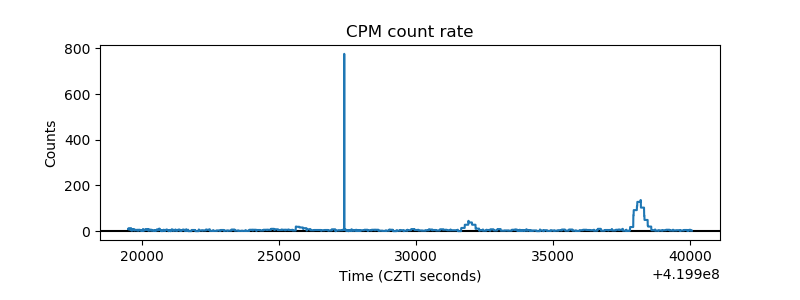 |
| CZT Counter | 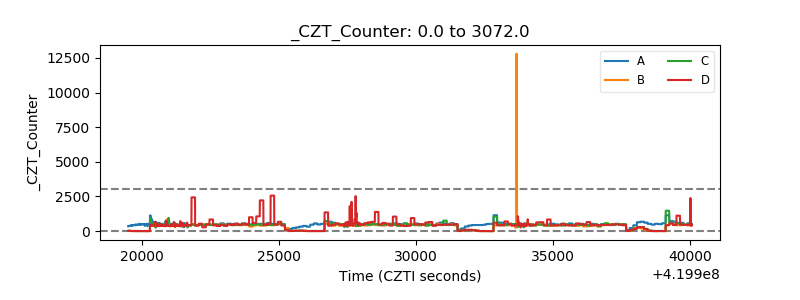 |
| +2.5 Volts monitor | 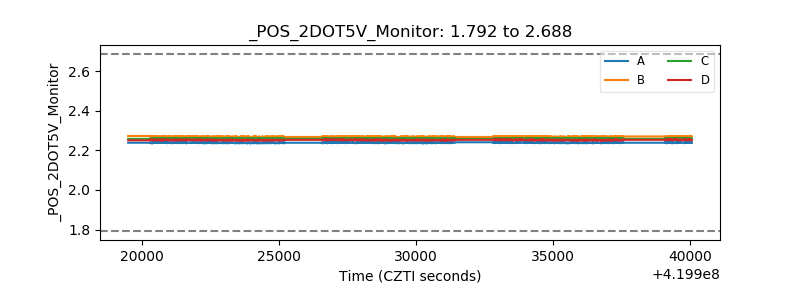 |
| +5 Volts monitor | 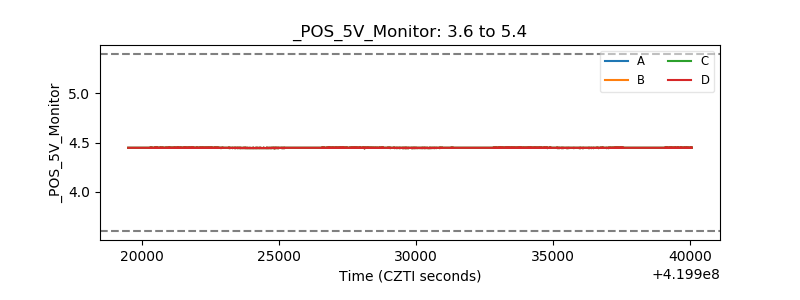 |
| _ROLL_ROT | 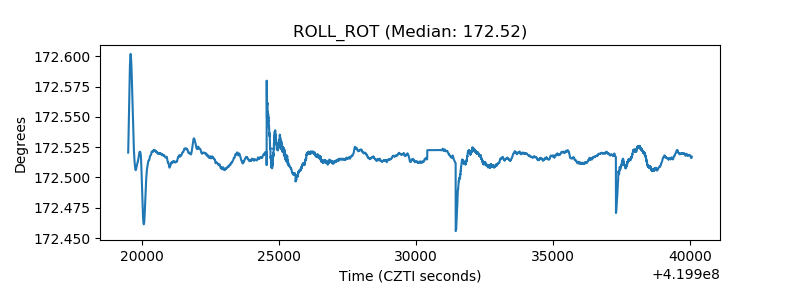 |
| _Roll_DEC | 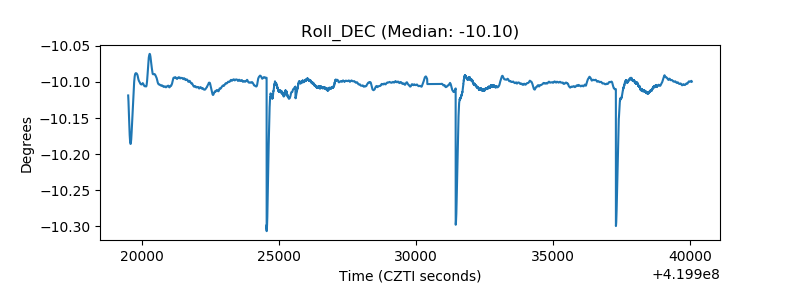 |
| _Roll_RA |  |
| Veto Counter | 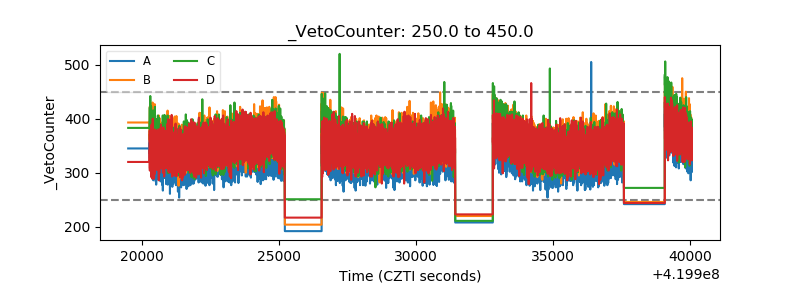 |