| Param | Original file | Final file |
|---|---|---|
| Filename | modeM0/AS1A12_044T19_9000005580_40919cztM0_level2.fits | modeM0/AS1A12_044T19_9000005580_40919cztM0_level2_quad_clean.evt |
| Size (bytes) | 323,089,920 | 93,372,480 |
| Size | 308.1 MB | 89.0 MB |
| Events in quadrant A | 3,040,342 | 626,744 |
| Events in quadrant B | 2,545,051 | 645,076 |
| Events in quadrant C | 2,759,607 | 603,915 |
| Events in quadrant D | 3,173,739 | 556,069 |
| Mode M9 | |||
|---|---|---|---|
| Quadrant | BADHDUFLAG | Total packets | Discarded packets |
| A | 0 | 32 | 0 |
| B | 0 | 32 | 0 |
| C | 0 | 32 | 0 |
| D | 0 | 32 | 0 |
| Mode SS | |||
|---|---|---|---|
| Quadrant | BADHDUFLAG | Total packets | Discarded packets |
| A | 0 | 116 | 0 |
| B | 0 | 116 | 0 |
| C | 0 | 116 | 0 |
| D | 0 | 116 | 0 |
| Mode M0 | |||
|---|---|---|---|
| Quadrant | BADHDUFLAG | Total packets | Discarded packets |
| A | 0 | 12376 | 3 |
| B | 0 | 11443 | 2 |
| C | 0 | 11715 | 2 |
| D | 0 | 13283 | 2 |
| Quadrant | Total seconds | Saturated seconds | Saturation percentage |
|---|---|---|---|
| A | 5658 | 18 | 0.318134% |
| B | 5658 | 10 | 0.176741% |
| C | 5658 | 45 | 0.795334% |
| D | 5658 | 94 | 1.661364% |
Noise dominated data is calculated using 1-second bins in cleaned event files. If a bin has >2000 counts, and if more than 50% of those come from <1% of pixels, then it is considered to be noise-dominated and hence unusable.
| Quadrant | # 1 sec bins | Bins with >0 counts | Bins with >2000 counts | High rate bins dominated by noise | Noise dominated (total time) | Noise dominated (detector-on time) | Marked lightcurve |
|---|---|---|---|---|---|---|---|
| A | 8793 | 5660 | 2 | 2 | 0.02% | 0.04% | 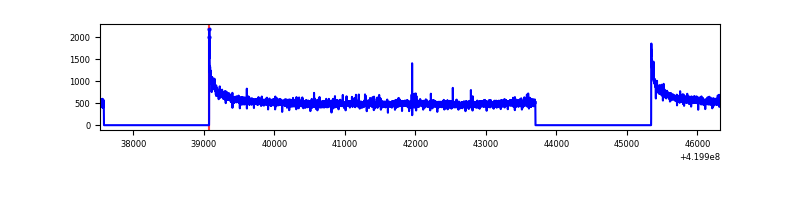 |
| B | 8793 | 5660 | 2 | 2 | 0.02% | 0.04% | 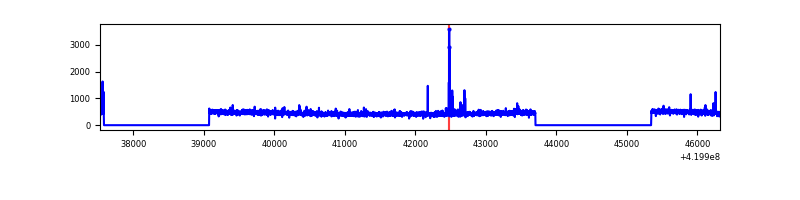 |
| C | 8793 | 5660 | 29 | 29 | 0.33% | 0.51% | 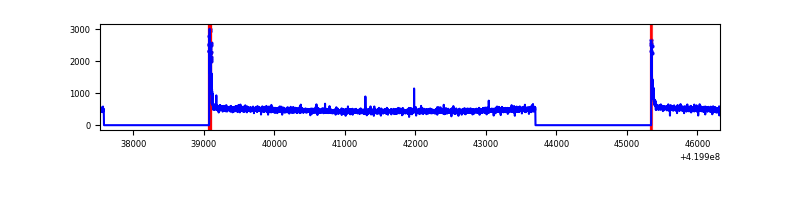 |
| D | 8793 | 5660 | 68 | 68 | 0.77% | 1.20% | 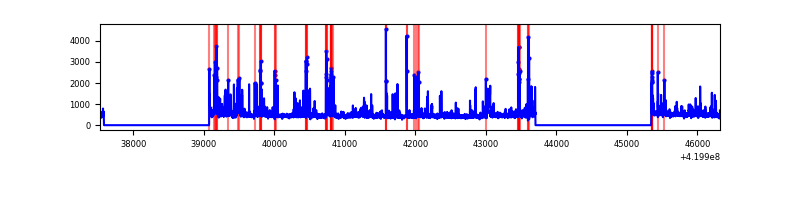 |
Top three noisy pixels from each quadrant. If the there are fewer than three noisy pixels in the level2.evt file, extra rows are filled as -1
| Pixel properties | Quadrant properties | ||||||
|---|---|---|---|---|---|---|---|
| Quadrant | DetID | PixID | Counts | Sigma | Mean | Median | Sigma |
| A | 10 | 83 | 531563 | 3959.22 | 642 | 628 | 134.1 |
| A | 2 | 79 | 10571 | 74.15 | 642 | 628 | 134.1 |
| A | 13 | 254 | 9045 | 62.77 | 642 | 628 | 134.1 |
| B | 5 | 255 | 43001 | 335.74 | 635 | 616 | 126.2 |
| B | 12 | 111 | 15748 | 119.86 | 635 | 616 | 126.2 |
| B | 11 | 111 | 14538 | 110.28 | 635 | 616 | 126.2 |
| C | 15 | 214 | 241505 | 1659.75 | 618 | 621 | 145.1 |
| C | 0 | 10 | 106945 | 732.6 | 618 | 621 | 145.1 |
| C | 13 | 61 | 4030 | 23.49 | 618 | 621 | 145.1 |
| D | 12 | 233 | 220735 | 1449.78 | 619 | 602 | 151.8 |
| D | 12 | 6 | 122845 | 805.08 | 619 | 602 | 151.8 |
| D | 1 | 47 | 114913 | 752.84 | 619 | 602 | 151.8 |
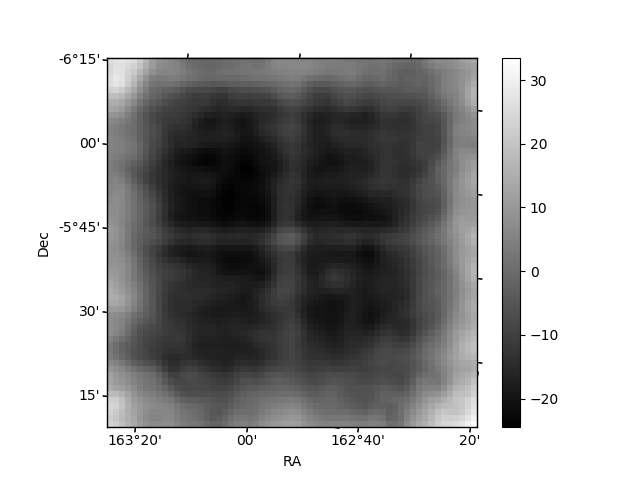
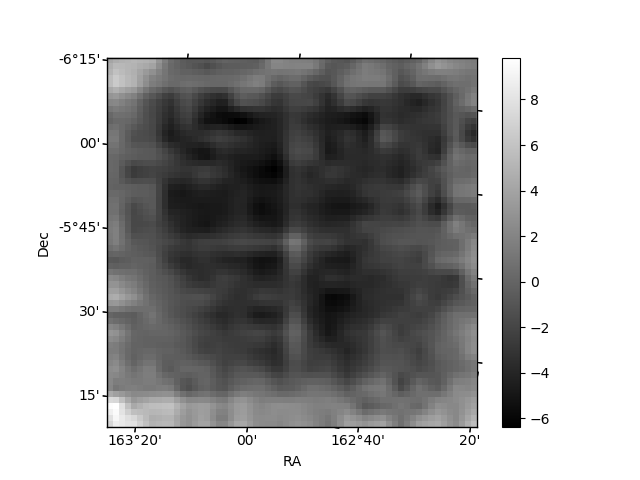
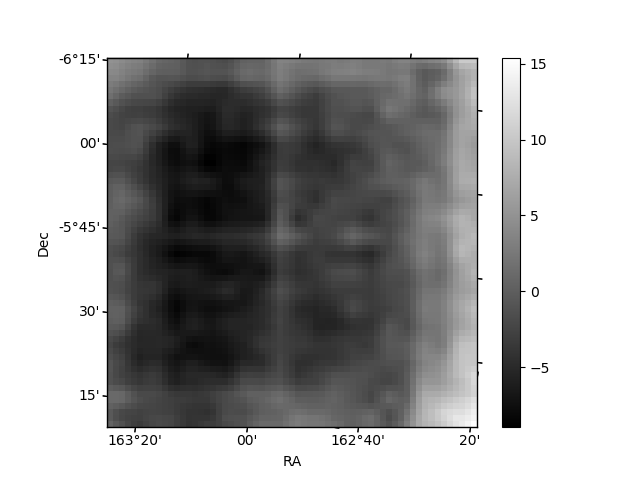
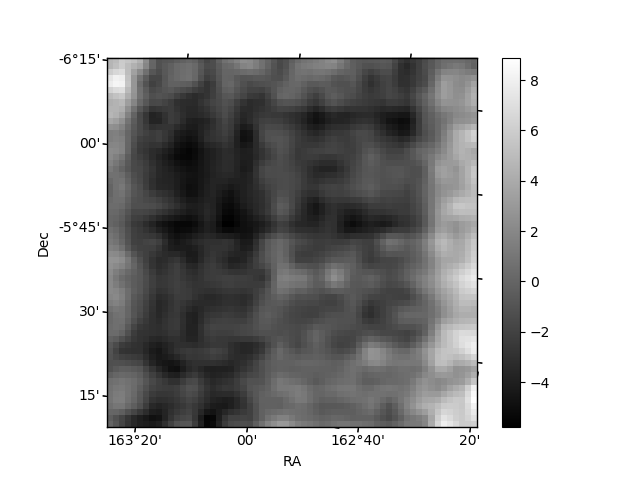
Histogram calculated using DETX and DETY for each event in the final _common_clean file
| Quadrant A | 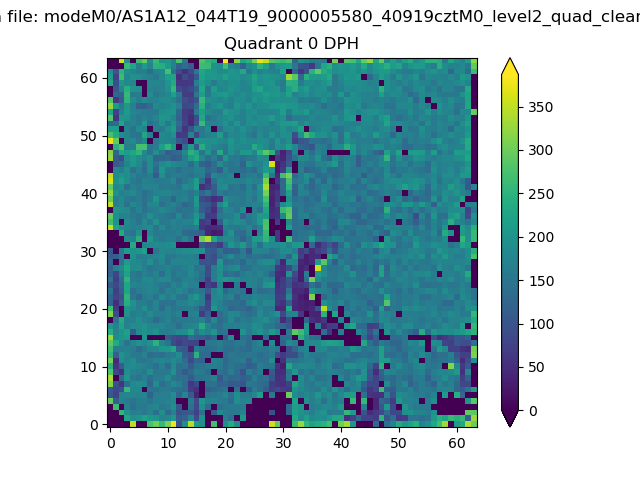 |
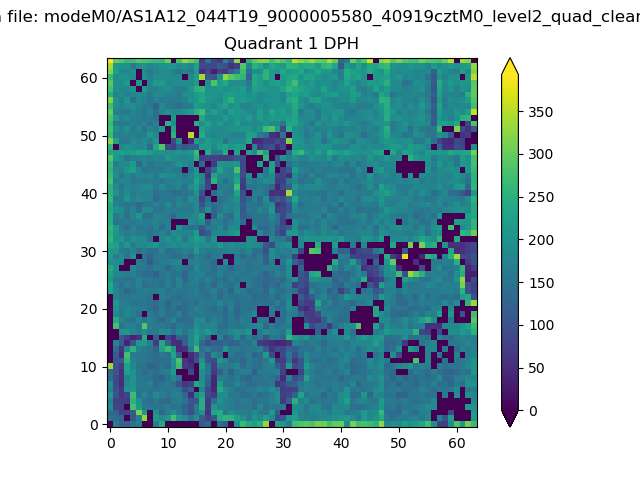 |
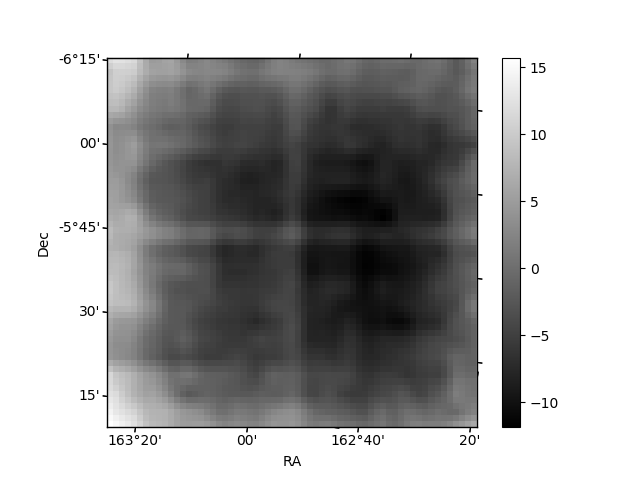
Quadrant B |
|---|---|---|---|
| Quadrant D | 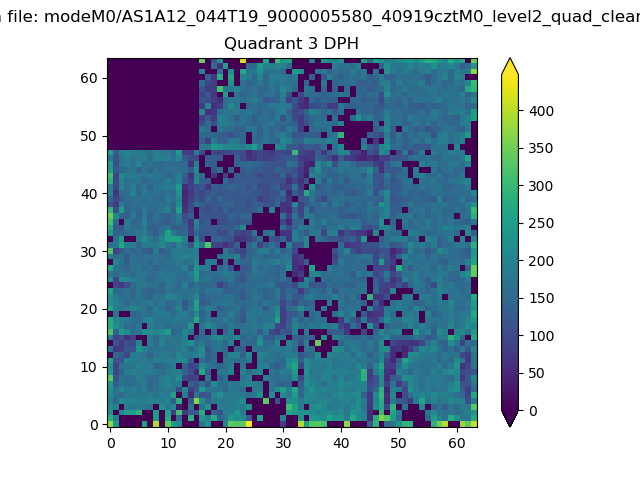 |
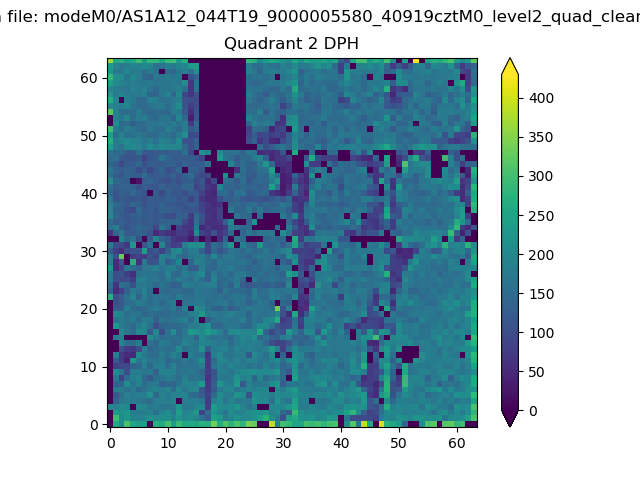 |
Quadrant C |
| Plot type | Count rate plots | Images |
|---|---|---|
| Comparison with Poisson distribution Blue bars denote a histogram of data divided into 1 sec bins. Red curve is a Poisson curve with rate = median count rate of data. |
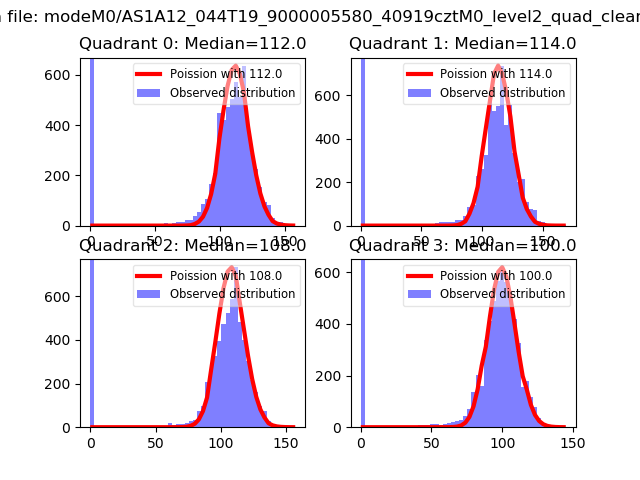 |
 |
| Quadrant-wise count rates Data is divided into 100 sec bins |
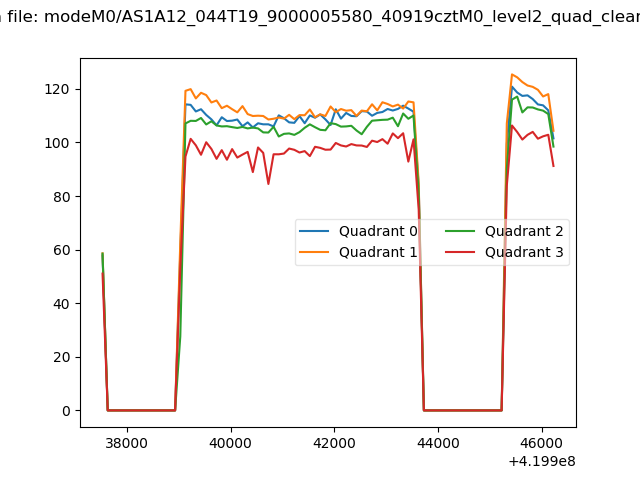 |
|
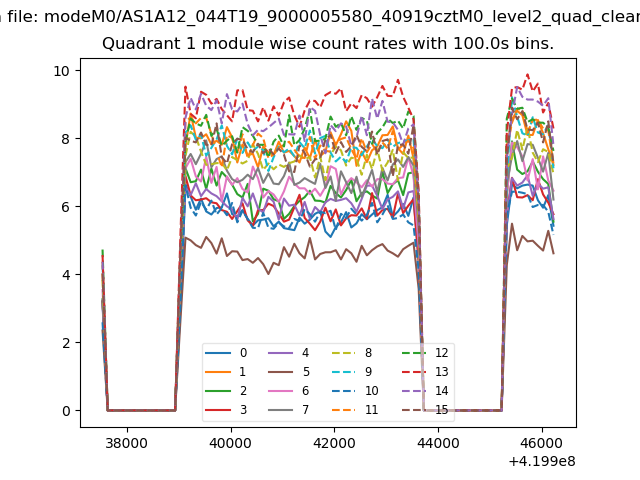
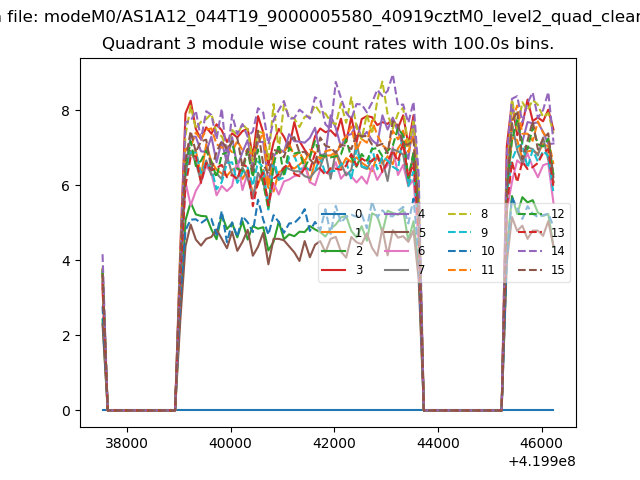
| Module-wise count rates for Quadrant A Data is divided into 100 sec bins |
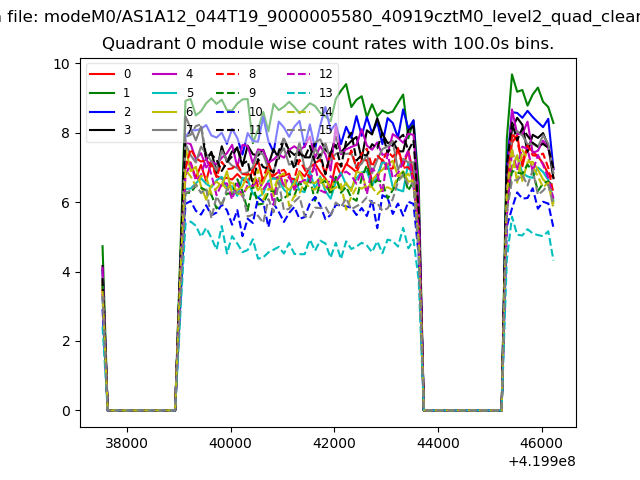 |
 |
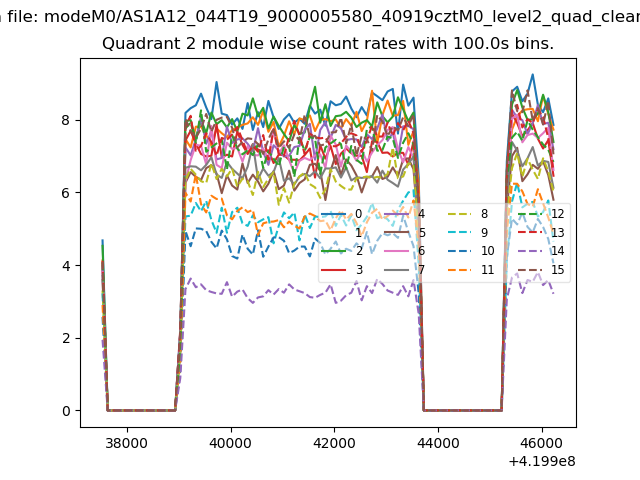
| Module-wise count rates for Quadrant B Data is divided into 100 sec bins |
 |
 |
| Module-wise count rates for Quadrant C Data is divided into 100 sec bins |
 |
 |
| Module-wise count rates for Quadrant D Data is divided into 100 sec bins |
 |
 |
| Parameter | Plot |
|---|---|
| CZT HV Monitor |  |
| D_VDD | 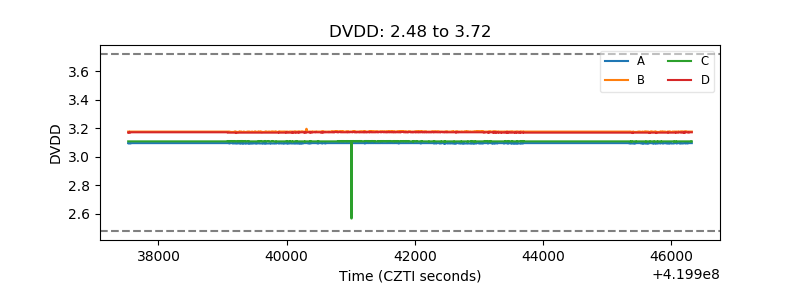 |
| Temperature 1 | 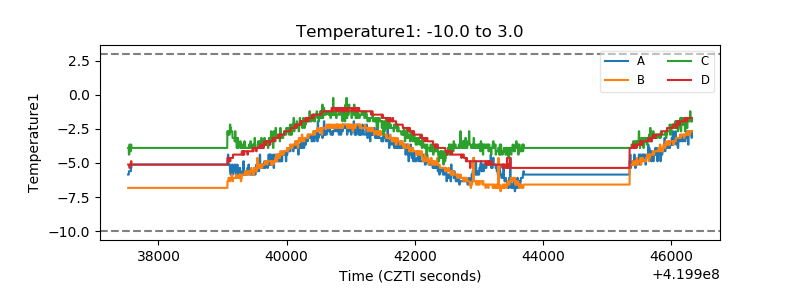 |
| Veto HV Monitor | 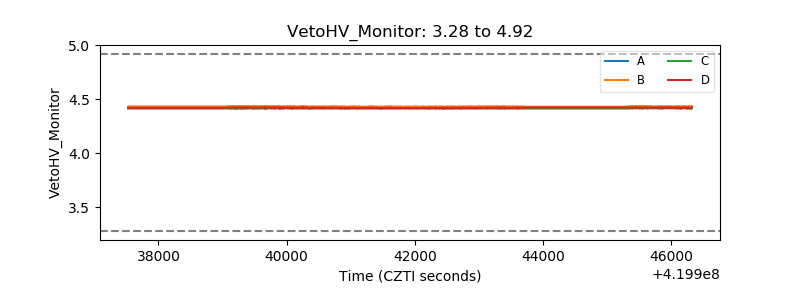 |
| Veto LLD | 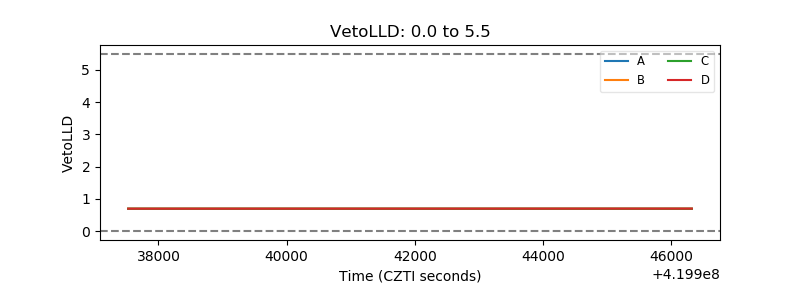 |
| Alpha Counter | 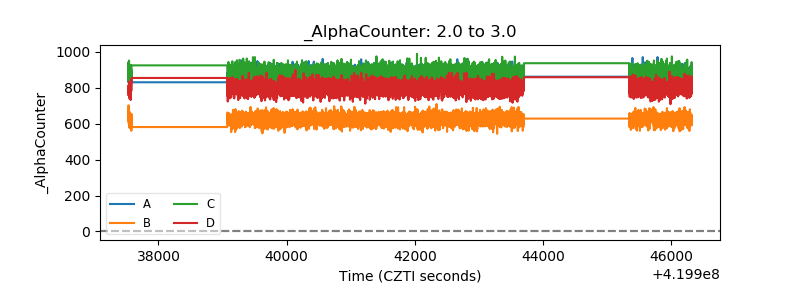 |
| _CPM_Rate | 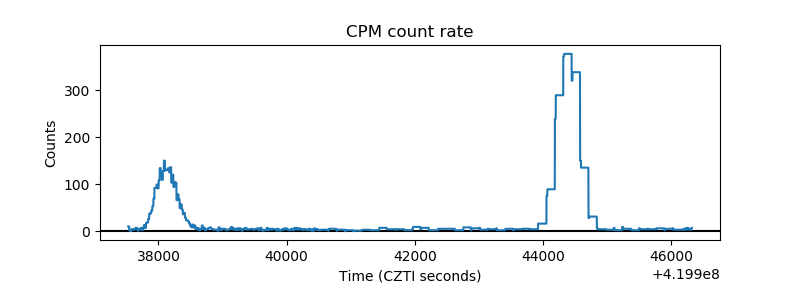 |
| CZT Counter | 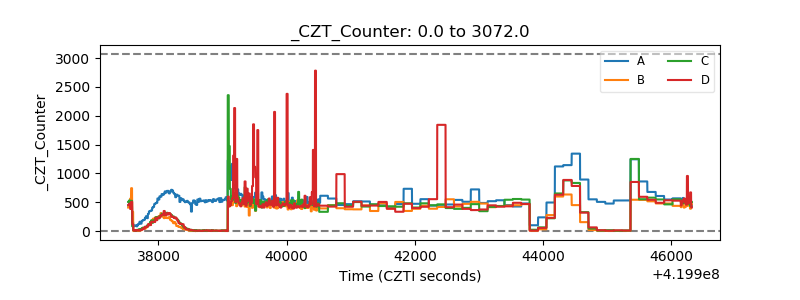 |
| +2.5 Volts monitor | 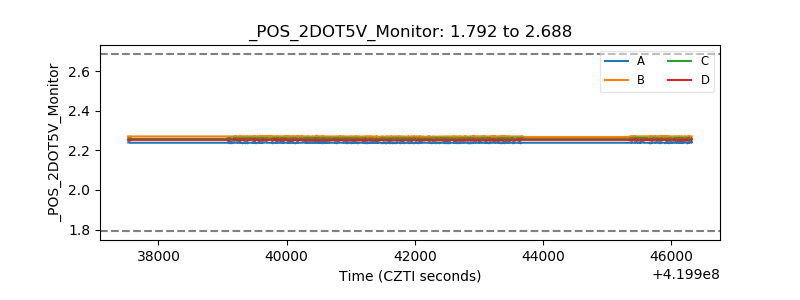 |
| +5 Volts monitor | 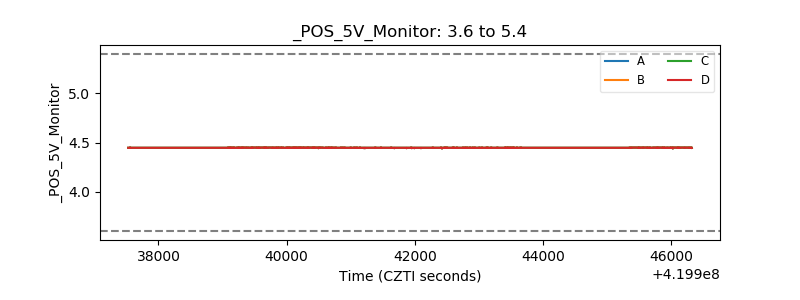 |
| _ROLL_ROT | 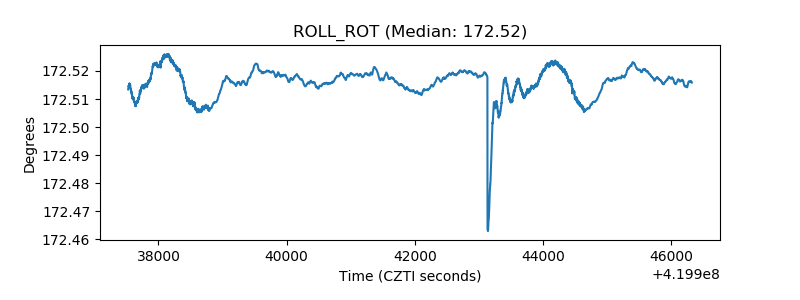 |
| _Roll_DEC | 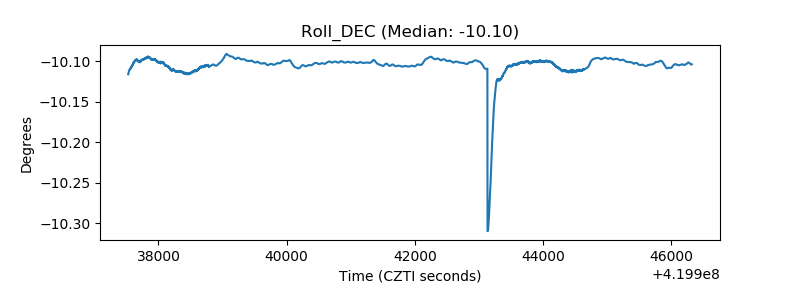 |
| _Roll_RA | 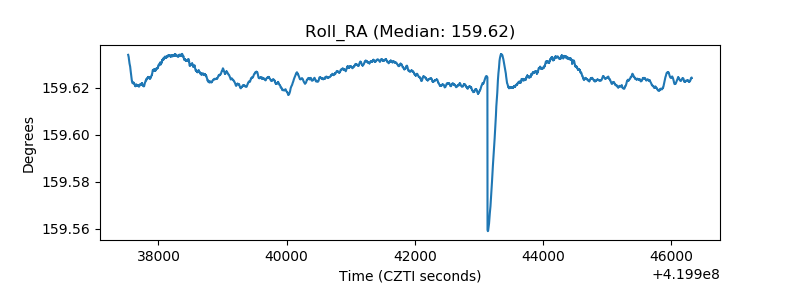 |
| Veto Counter | 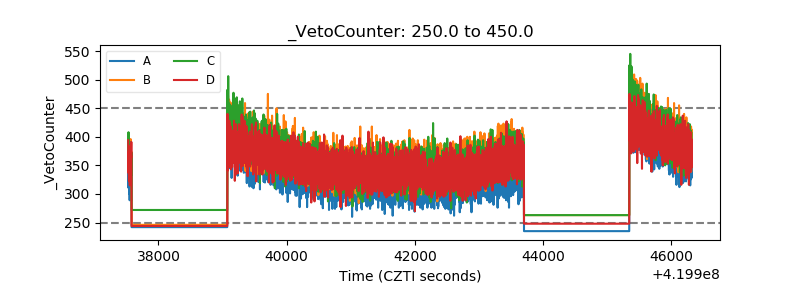 |