| Param | Original file | Final file |
|---|---|---|
| Filename | modeM0/AS1A12_044T19_9000005580_40921cztM0_level2.fits | modeM0/AS1A12_044T19_9000005580_40921cztM0_level2_quad_clean.evt |
| Size (bytes) | 304,663,680 | 89,642,880 |
| Size | 290.5 MB | 85.5 MB |
| Events in quadrant A | 2,870,050 | 606,460 |
| Events in quadrant B | 2,388,775 | 619,002 |
| Events in quadrant C | 2,603,932 | 579,825 |
| Events in quadrant D | 3,001,214 | 537,539 |
| Mode M9 | |||
|---|---|---|---|
| Quadrant | BADHDUFLAG | Total packets | Discarded packets |
| A | 0 | 18 | 0 |
| B | 0 | 18 | 0 |
| C | 0 | 18 | 0 |
| D | 0 | 18 | 0 |
| Mode SS | |||
|---|---|---|---|
| Quadrant | BADHDUFLAG | Total packets | Discarded packets |
| A | 0 | 108 | 0 |
| B | 0 | 108 | 0 |
| C | 0 | 108 | 0 |
| D | 0 | 108 | 0 |
| Mode M0 | |||
|---|---|---|---|
| Quadrant | BADHDUFLAG | Total packets | Discarded packets |
| A | 0 | 11727 | 3 |
| B | 0 | 10712 | 2 |
| C | 0 | 11049 | 2 |
| D | 0 | 12503 | 2 |
| Quadrant | Total seconds | Saturated seconds | Saturation percentage |
|---|---|---|---|
| A | 5307 | 13 | 0.244959% |
| B | 5307 | 7 | 0.131901% |
| C | 5307 | 34 | 0.640663% |
| D | 5307 | 68 | 1.281327% |
Noise dominated data is calculated using 1-second bins in cleaned event files. If a bin has >2000 counts, and if more than 50% of those come from <1% of pixels, then it is considered to be noise-dominated and hence unusable.
| Quadrant | # 1 sec bins | Bins with >0 counts | Bins with >2000 counts | High rate bins dominated by noise | Noise dominated (total time) | Noise dominated (detector-on time) | Marked lightcurve |
|---|---|---|---|---|---|---|---|
| A | 7069 | 5308 | 0 | 0 | 0.00% | 0.00% | 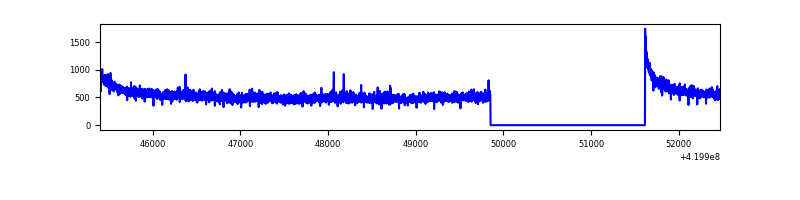 |
| B | 7069 | 5308 | 0 | 0 | 0.00% | 0.00% | 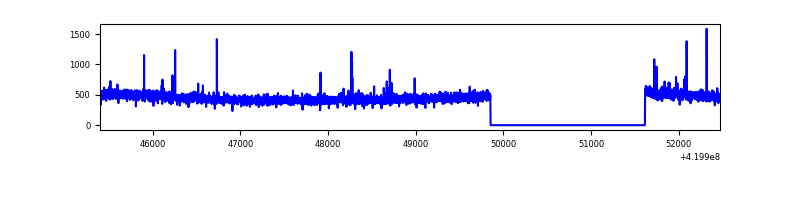 |
| C | 7069 | 5308 | 30 | 30 | 0.42% | 0.57% | 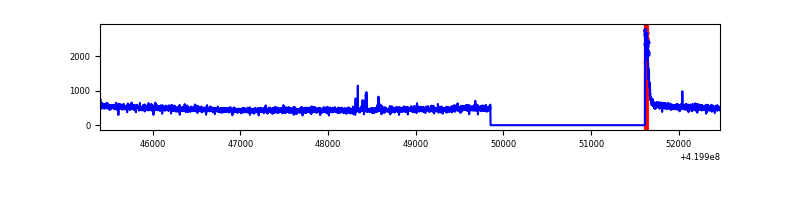 |
| D | 7069 | 5308 | 57 | 57 | 0.81% | 1.07% | 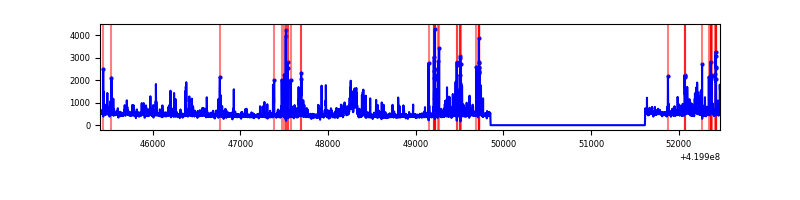 |
Top three noisy pixels from each quadrant. If the there are fewer than three noisy pixels in the level2.evt file, extra rows are filled as -1
| Pixel properties | Quadrant properties | ||||||
|---|---|---|---|---|---|---|---|
| Quadrant | DetID | PixID | Counts | Sigma | Mean | Median | Sigma |
| A | 10 | 83 | 480257 | 3794.41 | 608 | 596 | 126.4 |
| A | 12 | 189 | 17613 | 134.61 | 608 | 596 | 126.4 |
| A | 13 | 254 | 8818 | 65.04 | 608 | 596 | 126.4 |
| B | 5 | 255 | 24233 | 199.77 | 600 | 583 | 118.4 |
| B | 12 | 111 | 14841 | 120.44 | 600 | 583 | 118.4 |
| B | 11 | 111 | 13668 | 110.53 | 600 | 583 | 118.4 |
| C | 15 | 214 | 225620 | 1659.36 | 581 | 585 | 135.6 |
| C | 0 | 10 | 95653 | 701.01 | 581 | 585 | 135.6 |
| C | 14 | 254 | 13629 | 96.18 | 581 | 585 | 135.6 |
| D | 2 | 249 | 174090 | 1207.78 | 586 | 569 | 143.7 |
| D | 12 | 233 | 115905 | 802.79 | 586 | 569 | 143.7 |
| D | 13 | 249 | 89423 | 618.46 | 586 | 569 | 143.7 |
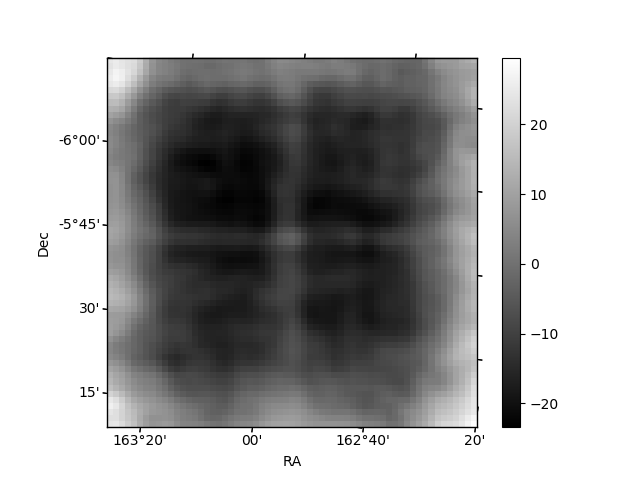
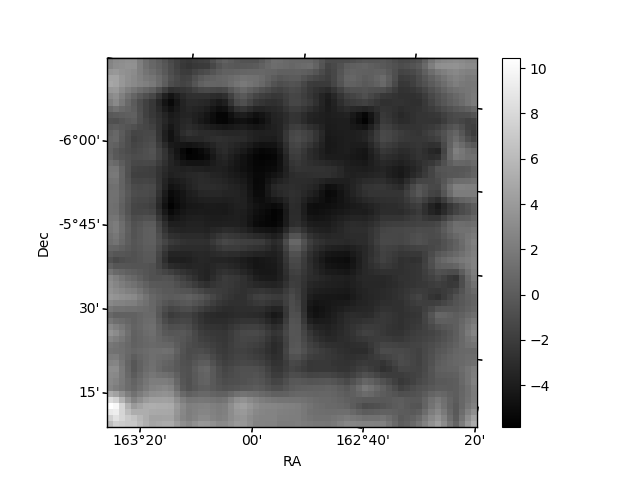
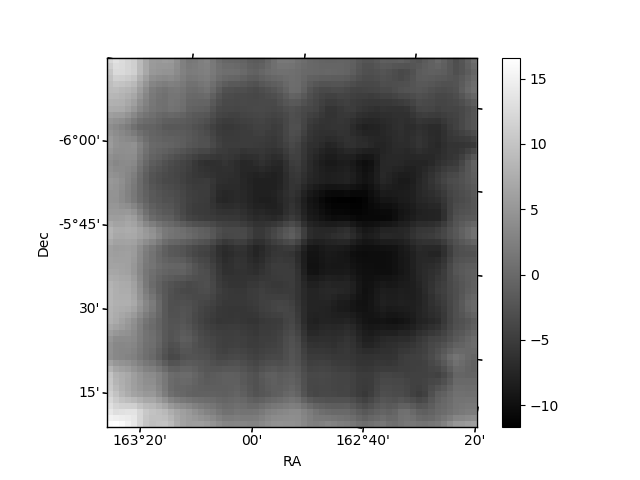
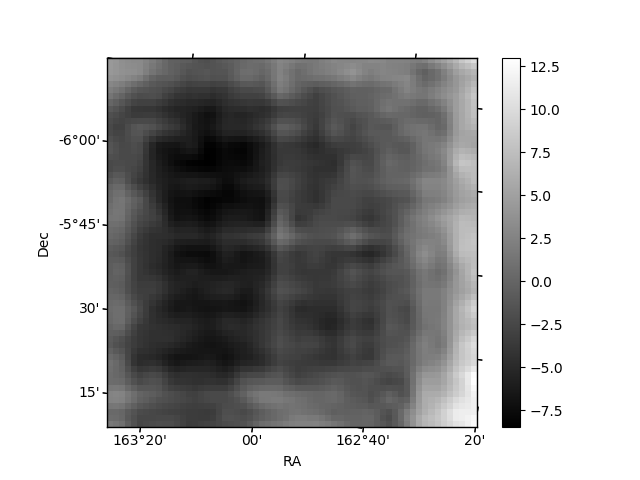
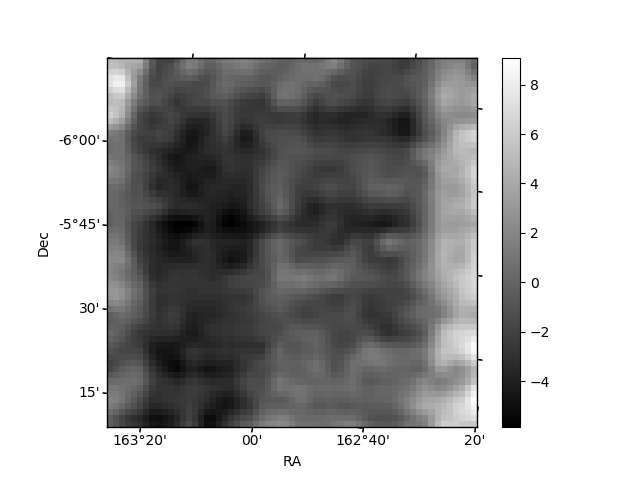
Histogram calculated using DETX and DETY for each event in the final _common_clean file
| Quadrant A | 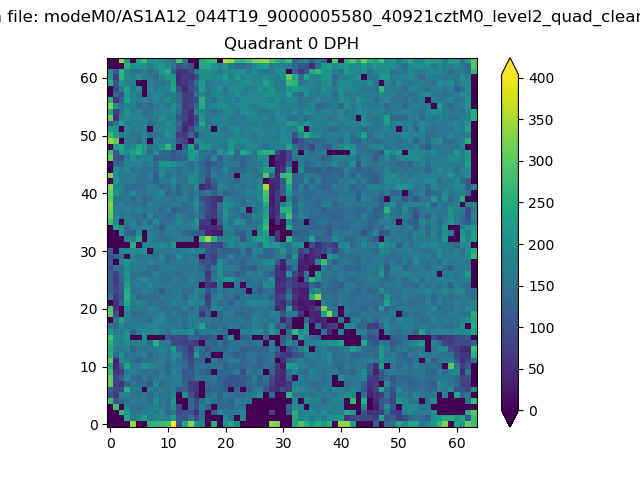 |
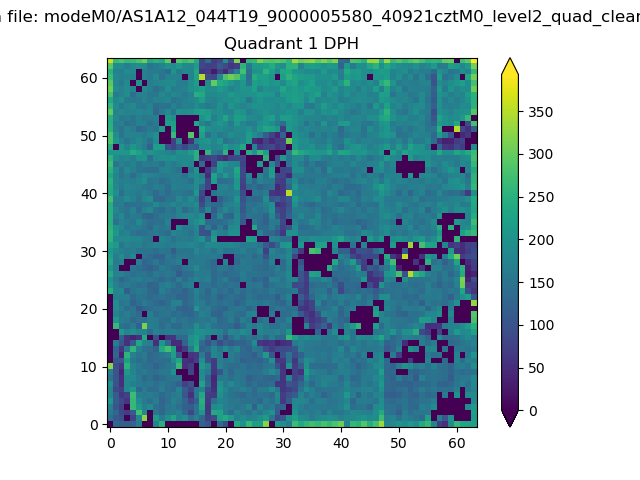 |
Quadrant B |
|---|---|---|---|
| Quadrant D | 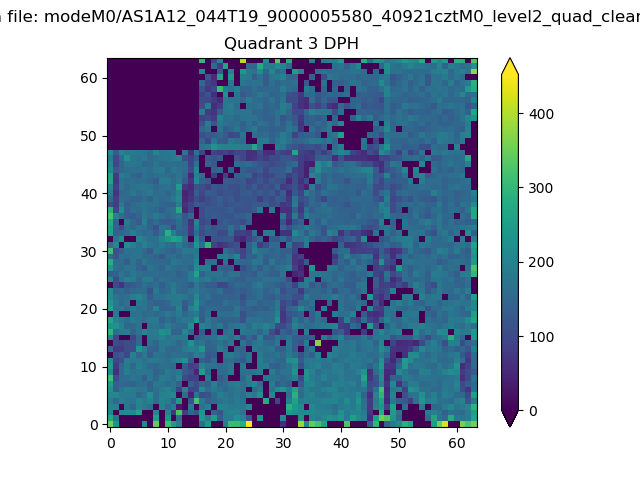 |
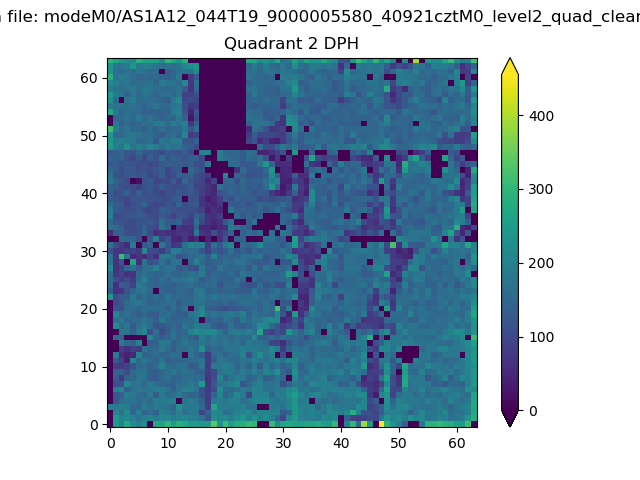 |
Quadrant C |
| Plot type | Count rate plots | Images |
|---|---|---|
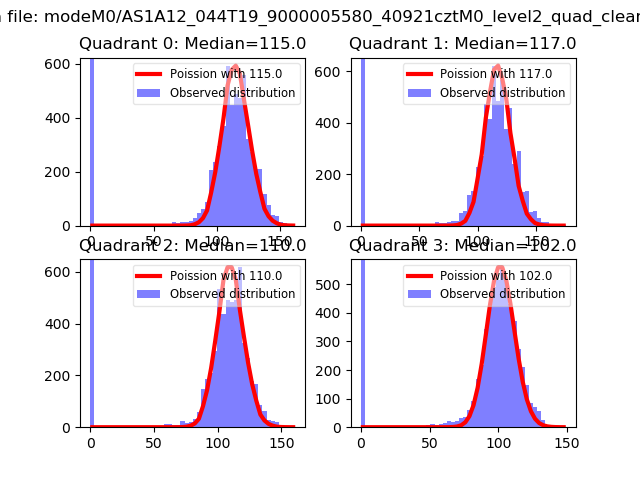
| Comparison with Poisson distribution Blue bars denote a histogram of data divided into 1 sec bins. Red curve is a Poisson curve with rate = median count rate of data. |
 |
 |
| Quadrant-wise count rates Data is divided into 100 sec bins |
 |
|
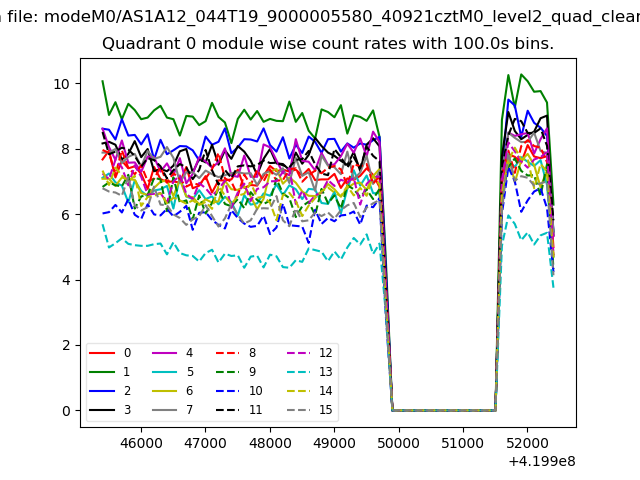
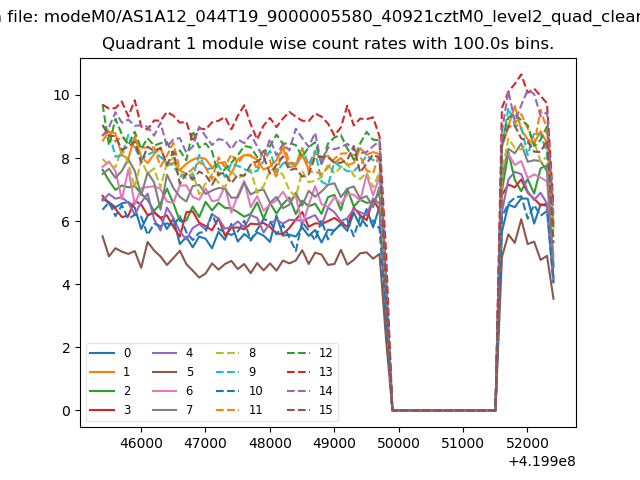
| Module-wise count rates for Quadrant A Data is divided into 100 sec bins |
 |
 |
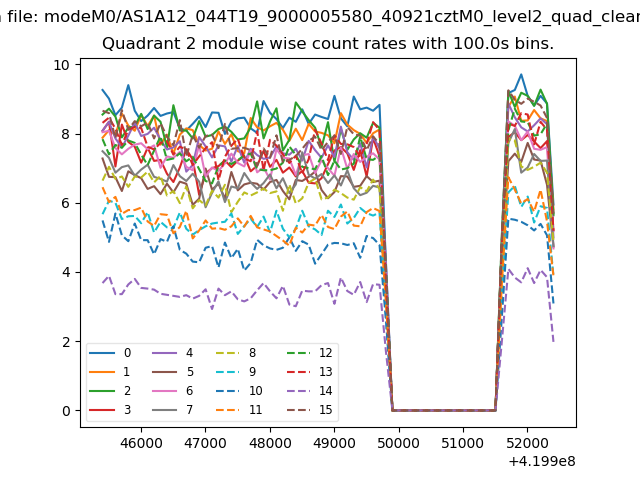
| Module-wise count rates for Quadrant B Data is divided into 100 sec bins |
 |
 |
| Module-wise count rates for Quadrant C Data is divided into 100 sec bins |
 |
 |
| Module-wise count rates for Quadrant D Data is divided into 100 sec bins |
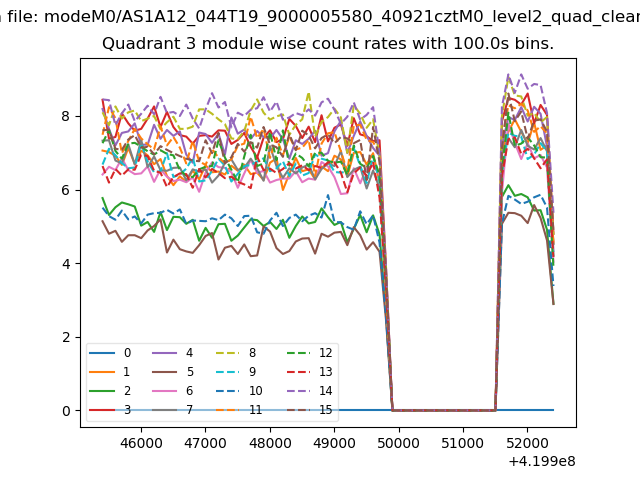 |
 |
| Parameter | Plot |
|---|---|
| CZT HV Monitor | 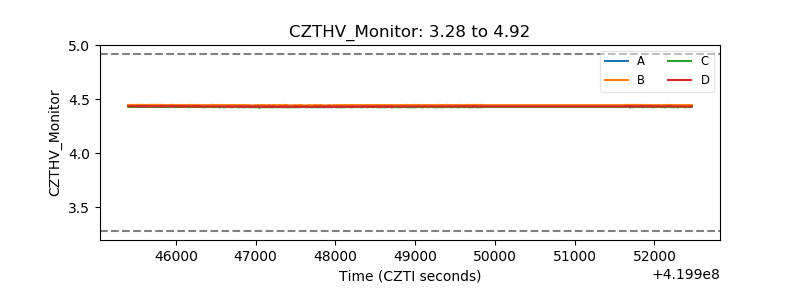 |
| D_VDD | 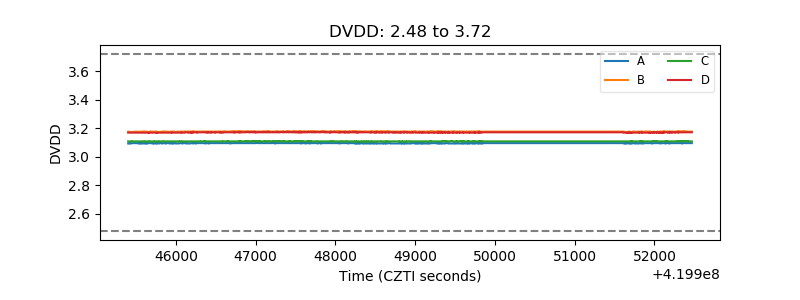 |
| Temperature 1 | 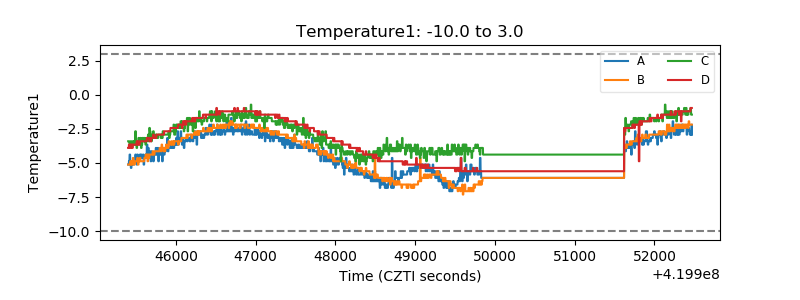 |
| Veto HV Monitor | 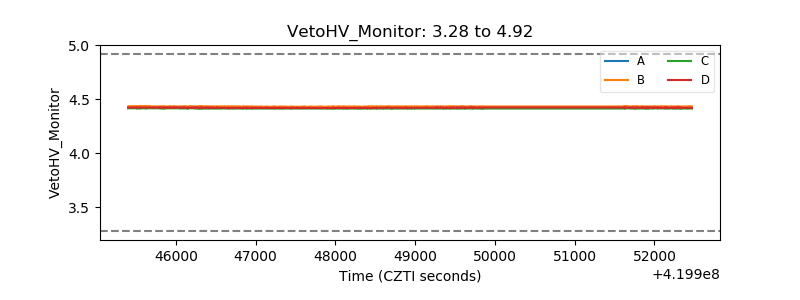 |
| Veto LLD | 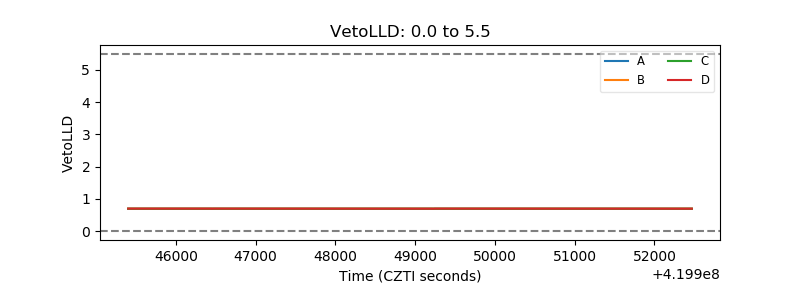 |
| Alpha Counter | 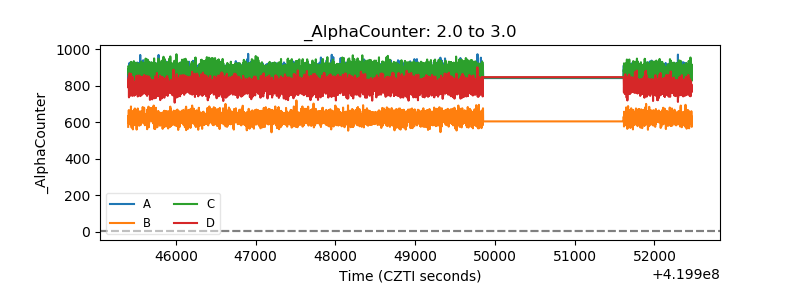 |
| _CPM_Rate | 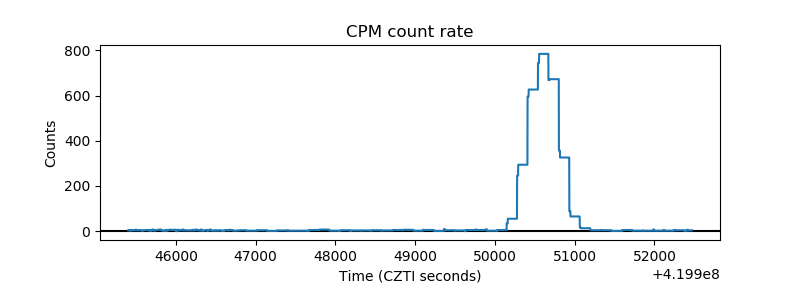 |
| CZT Counter | 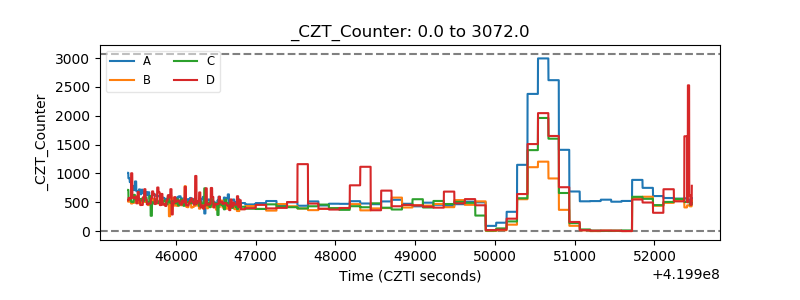 |
| +2.5 Volts monitor | 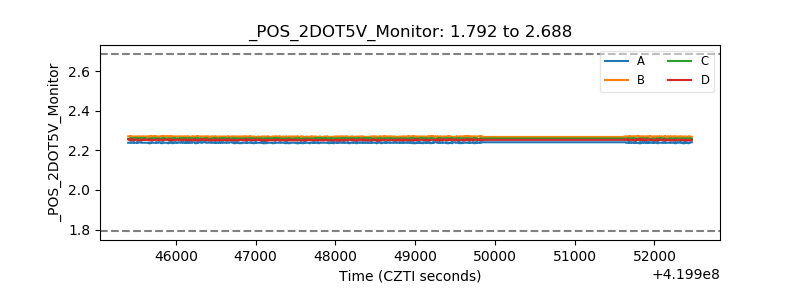 |
| +5 Volts monitor | 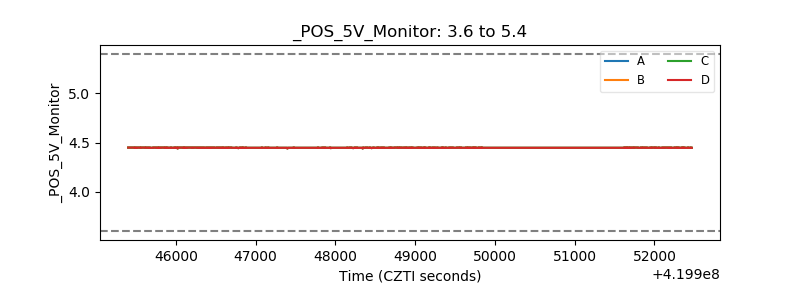 |
| _ROLL_ROT | 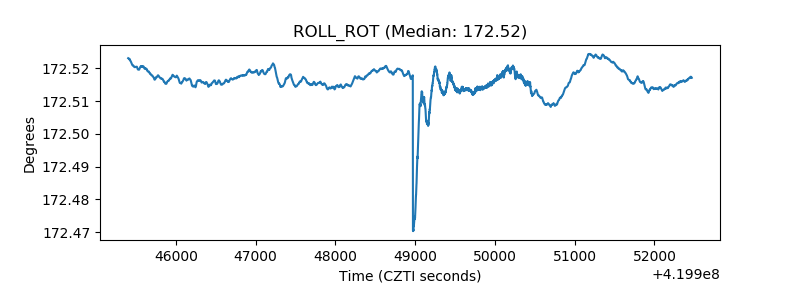 |
| _Roll_DEC | 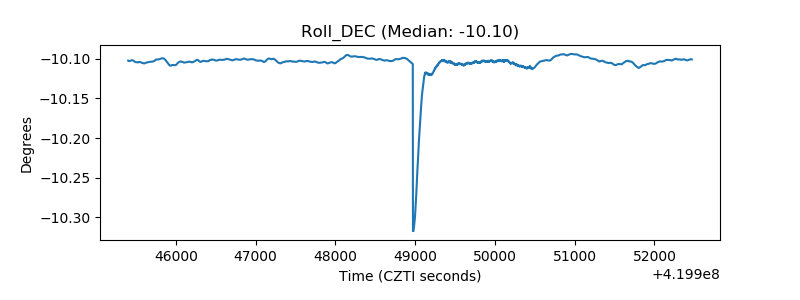 |
| _Roll_RA | 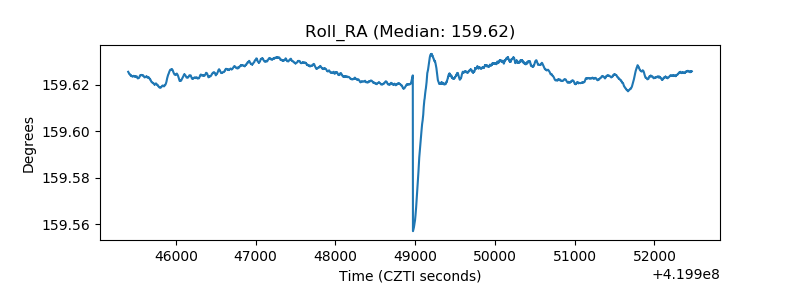 |
| Veto Counter | 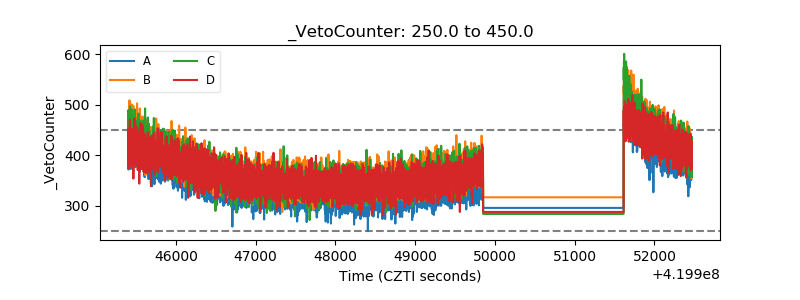 |