| Param | Original file | Final file |
|---|---|---|
| Filename | modeM0/AS1A12_044T19_9000005580_40922cztM0_level2.fits | modeM0/AS1A12_044T19_9000005580_40922cztM0_level2_quad_clean.evt |
| Size (bytes) | 335,903,040 | 94,294,080 |
| Size | 320.3 MB | 89.9 MB |
| Events in quadrant A | 3,011,788 | 649,490 |
| Events in quadrant B | 2,544,027 | 655,326 |
| Events in quadrant C | 2,760,365 | 606,888 |
| Events in quadrant D | 3,694,461 | 563,418 |
| Mode M9 | |||
|---|---|---|---|
| Quadrant | BADHDUFLAG | Total packets | Discarded packets |
| A | 0 | 31 | 0 |
| B | 0 | 31 | 0 |
| C | 0 | 31 | 0 |
| D | 0 | 32 | 0 |
| Mode SS | |||
|---|---|---|---|
| Quadrant | BADHDUFLAG | Total packets | Discarded packets |
| A | 0 | 110 | 0 |
| B | 0 | 110 | 0 |
| C | 0 | 110 | 0 |
| D | 0 | 110 | 0 |
| Mode M0 | |||
|---|---|---|---|
| Quadrant | BADHDUFLAG | Total packets | Discarded packets |
| A | 0 | 12258 | 3 |
| B | 0 | 11208 | 2 |
| C | 0 | 11592 | 2 |
| D | 0 | 14601 | 2 |
| Quadrant | Total seconds | Saturated seconds | Saturation percentage |
|---|---|---|---|
| A | 5436 | 21 | 0.386313% |
| B | 5436 | 21 | 0.386313% |
| C | 5436 | 68 | 1.250920% |
| D | 5436 | 190 | 3.495217% |
Noise dominated data is calculated using 1-second bins in cleaned event files. If a bin has >2000 counts, and if more than 50% of those come from <1% of pixels, then it is considered to be noise-dominated and hence unusable.
| Quadrant | # 1 sec bins | Bins with >0 counts | Bins with >2000 counts | High rate bins dominated by noise | Noise dominated (total time) | Noise dominated (detector-on time) | Marked lightcurve |
|---|---|---|---|---|---|---|---|
| A | 7348 | 5437 | 1 | 1 | 0.01% | 0.02% | 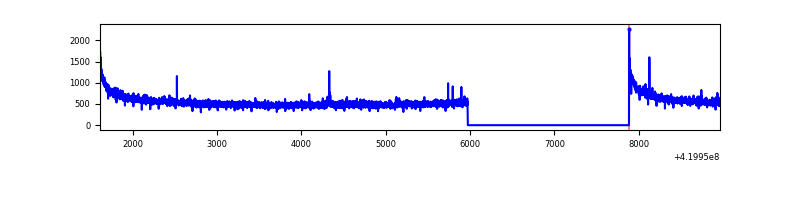 |
| B | 7348 | 5437 | 13 | 13 | 0.18% | 0.24% | 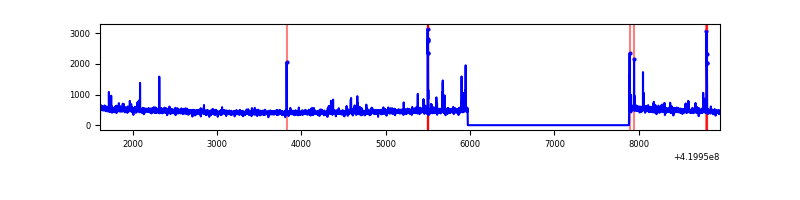 |
| C | 7348 | 5437 | 55 | 55 | 0.75% | 1.01% | 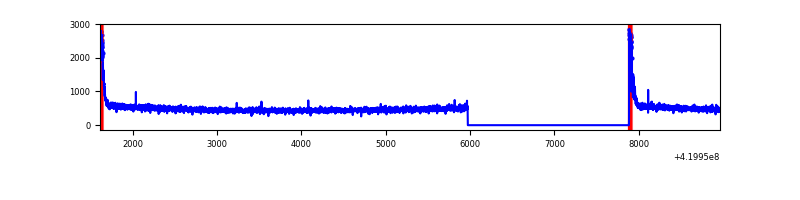 |
| D | 7348 | 5437 | 163 | 163 | 2.22% | 3.00% | 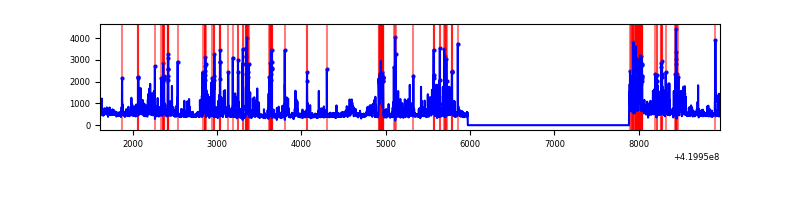 |
Top three noisy pixels from each quadrant. If the there are fewer than three noisy pixels in the level2.evt file, extra rows are filled as -1
| Pixel properties | Quadrant properties | ||||||
|---|---|---|---|---|---|---|---|
| Quadrant | DetID | PixID | Counts | Sigma | Mean | Median | Sigma |
| A | 10 | 83 | 529651 | 4104.61 | 632 | 619 | 128.9 |
| A | 12 | 189 | 21634 | 163.05 | 632 | 619 | 128.9 |
| A | 13 | 254 | 8793 | 63.42 | 632 | 619 | 128.9 |
| B | 5 | 255 | 75579 | 616.75 | 621 | 604 | 121.6 |
| B | 0 | 229 | 27417 | 220.57 | 621 | 604 | 121.6 |
| B | 12 | 111 | 14911 | 117.69 | 621 | 604 | 121.6 |
| C | 15 | 214 | 229213 | 1629.77 | 601 | 605 | 140.3 |
| C | 0 | 10 | 184467 | 1310.77 | 601 | 605 | 140.3 |
| C | 13 | 61 | 4104 | 24.94 | 601 | 605 | 140.3 |
| D | 2 | 249 | 520928 | 3462.97 | 605 | 588 | 150.3 |
| D | 13 | 249 | 291188 | 1934.0 | 605 | 588 | 150.3 |
| D | 12 | 233 | 213836 | 1419.21 | 605 | 588 | 150.3 |
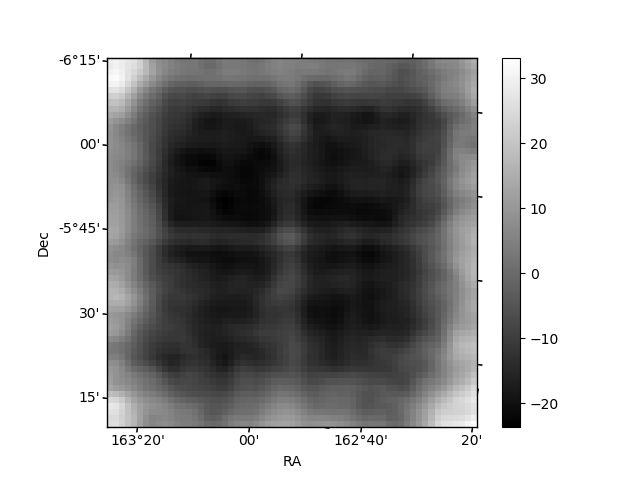
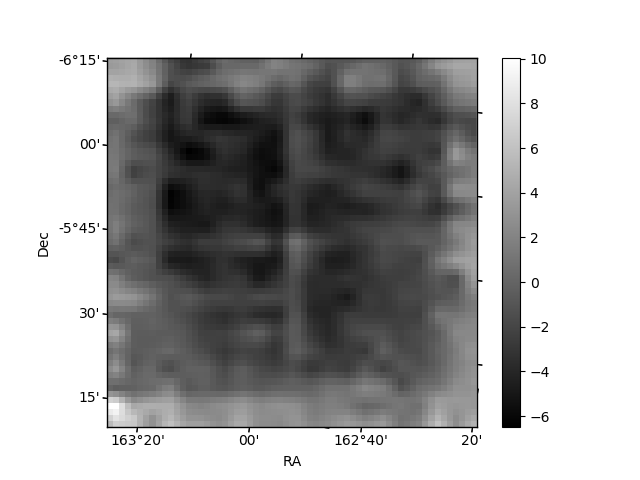
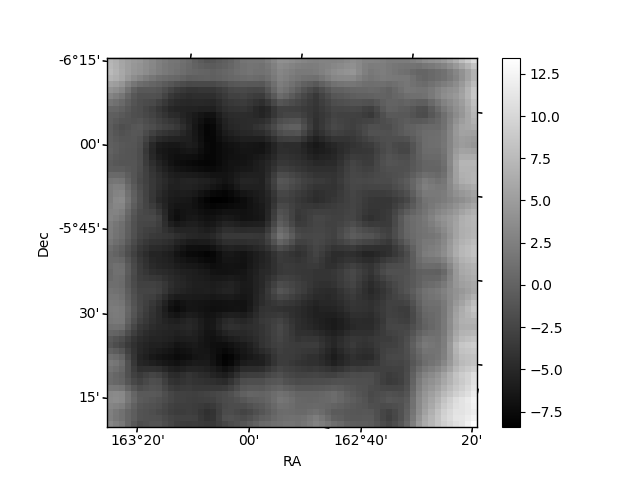
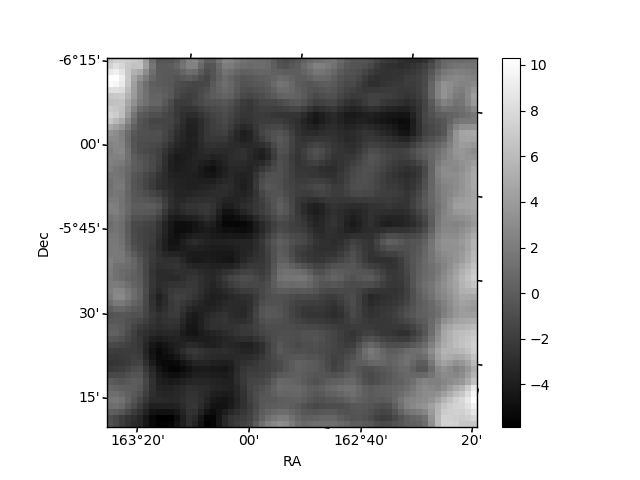
Histogram calculated using DETX and DETY for each event in the final _common_clean file
| Quadrant A | 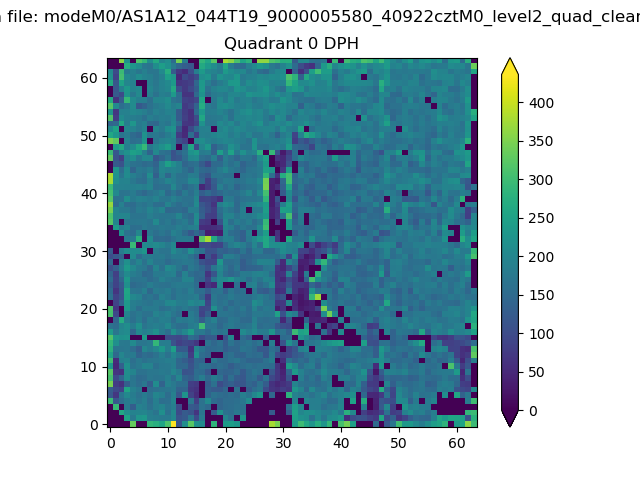 |
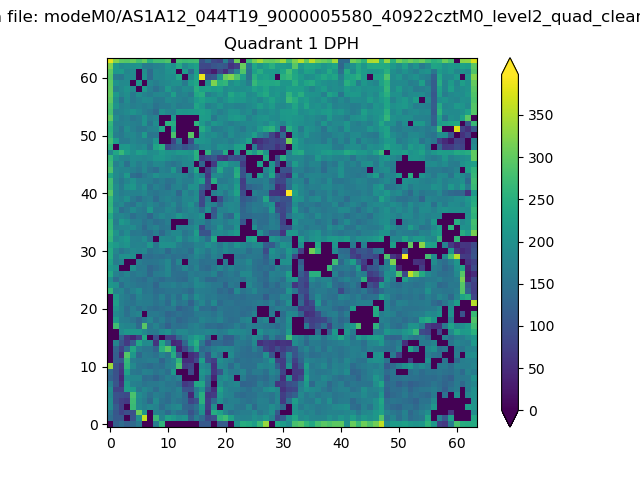 |
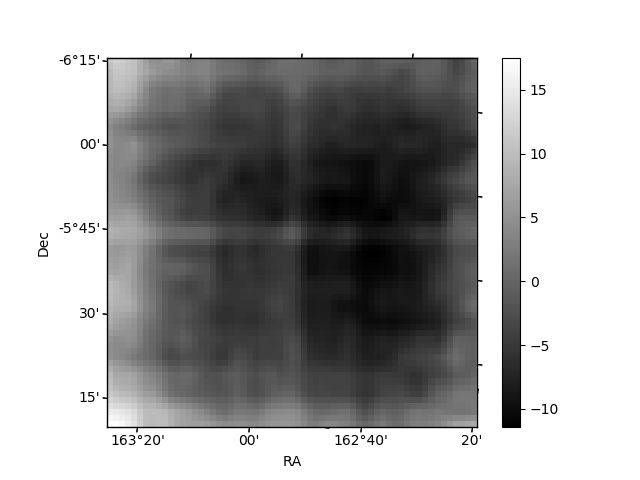
Quadrant B |
|---|---|---|---|
| Quadrant D | 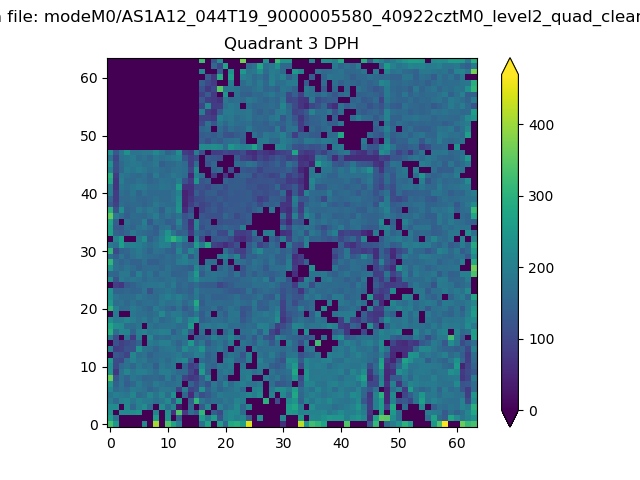 |
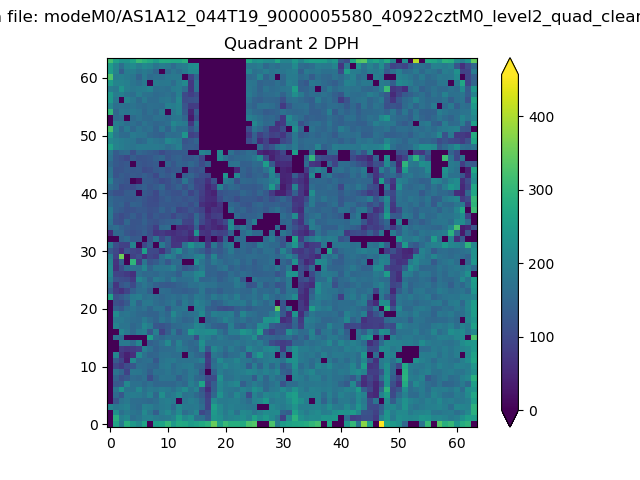 |
Quadrant C |
| Plot type | Count rate plots | Images |
|---|---|---|
| Comparison with Poisson distribution Blue bars denote a histogram of data divided into 1 sec bins. Red curve is a Poisson curve with rate = median count rate of data. |
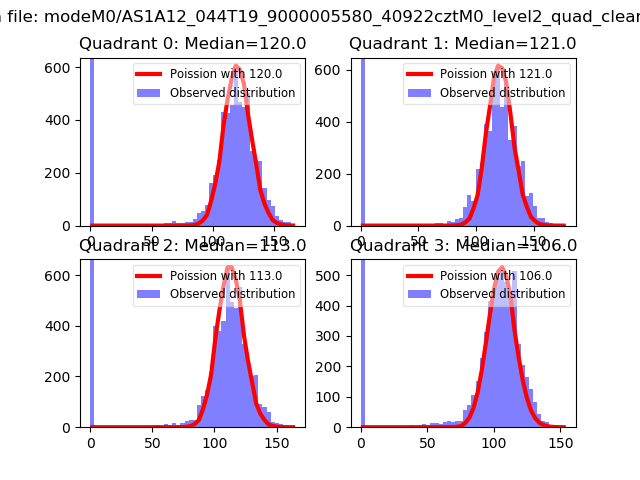 |
 |
| Quadrant-wise count rates Data is divided into 100 sec bins |
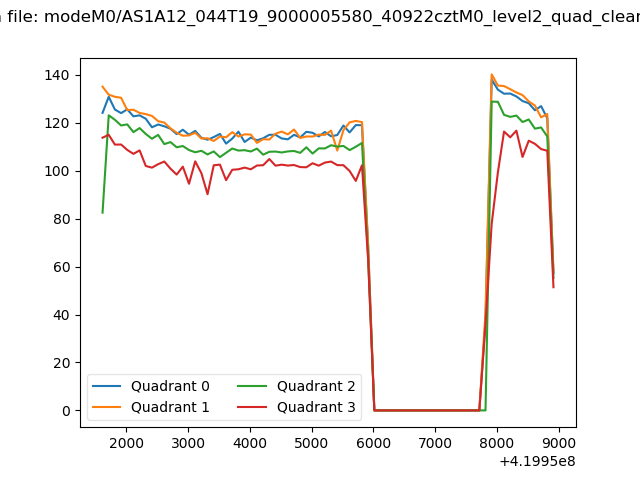 |
|
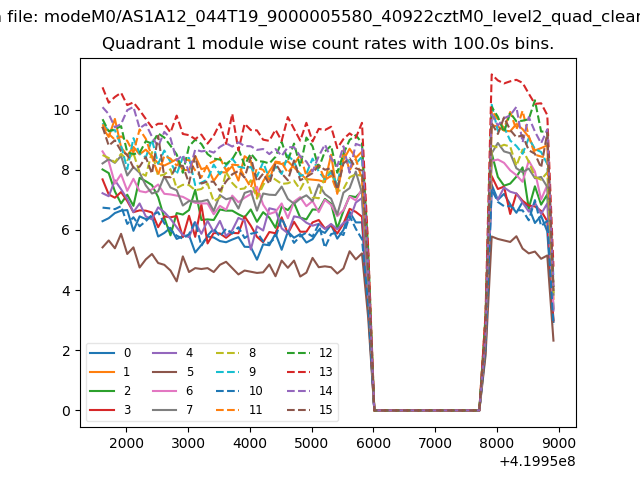
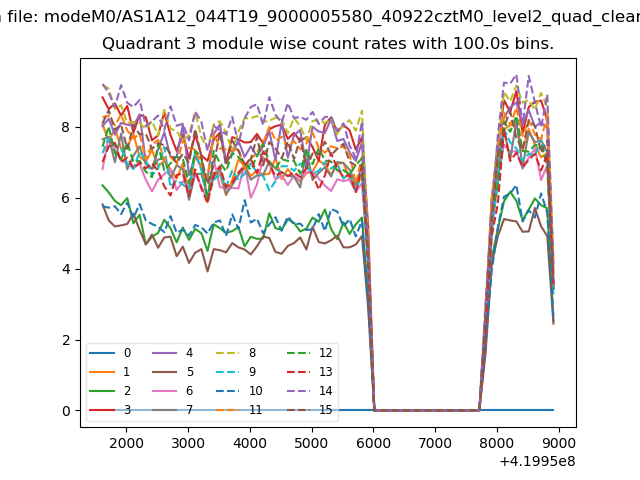
| Module-wise count rates for Quadrant A Data is divided into 100 sec bins |
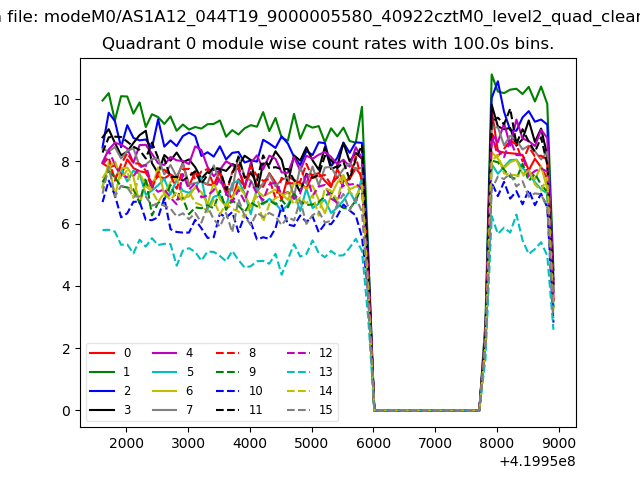 |
 |
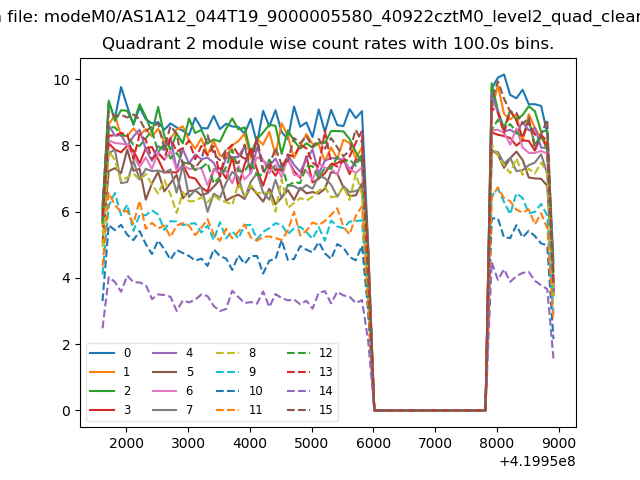
| Module-wise count rates for Quadrant B Data is divided into 100 sec bins |
 |
 |
| Module-wise count rates for Quadrant C Data is divided into 100 sec bins |
 |
 |
| Module-wise count rates for Quadrant D Data is divided into 100 sec bins |
 |
 |
| Parameter | Plot |
|---|---|
| CZT HV Monitor | 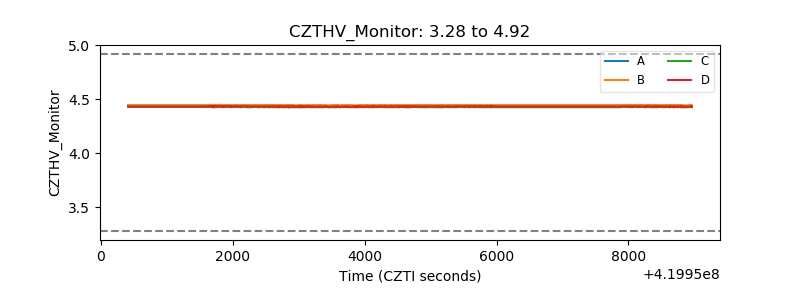 |
| D_VDD | 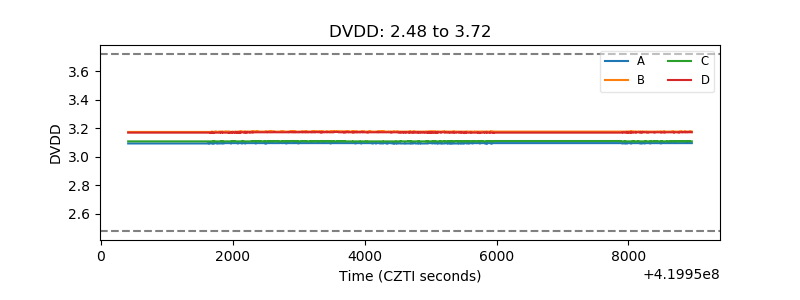 |
| Temperature 1 | 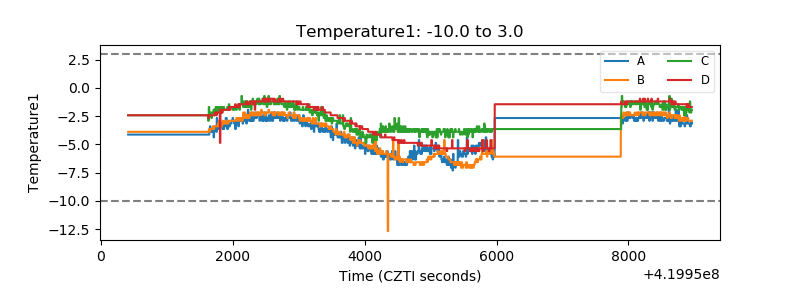 |
| Veto HV Monitor | 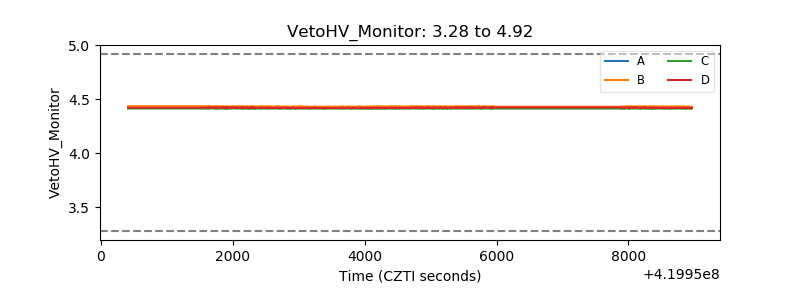 |
| Veto LLD | 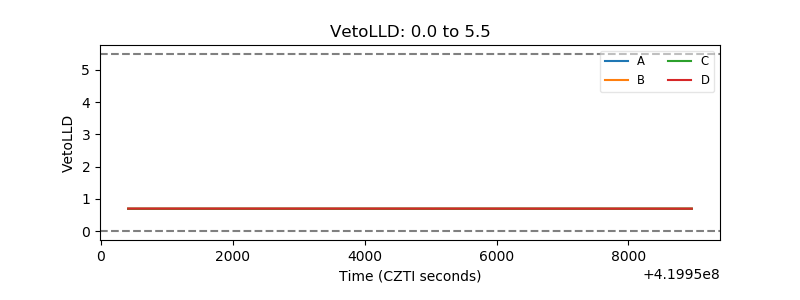 |
| Alpha Counter | 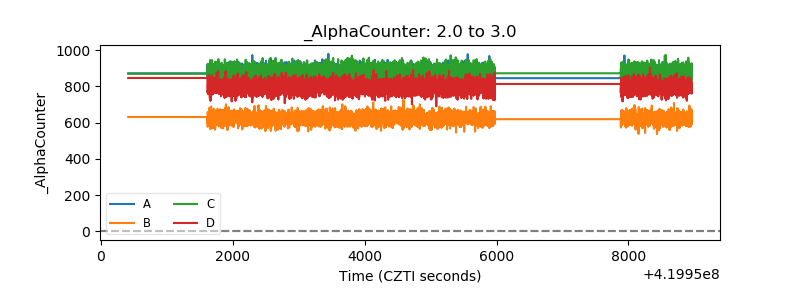 |
| _CPM_Rate | 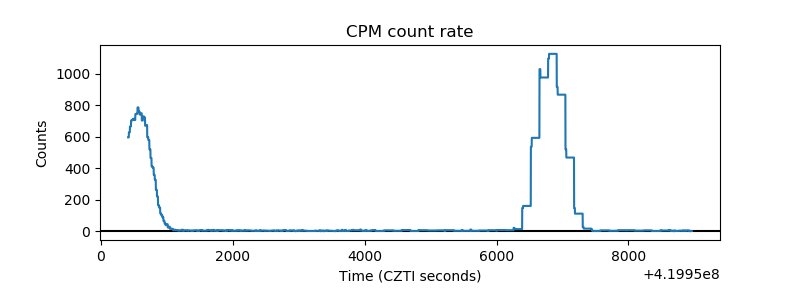 |
| CZT Counter | 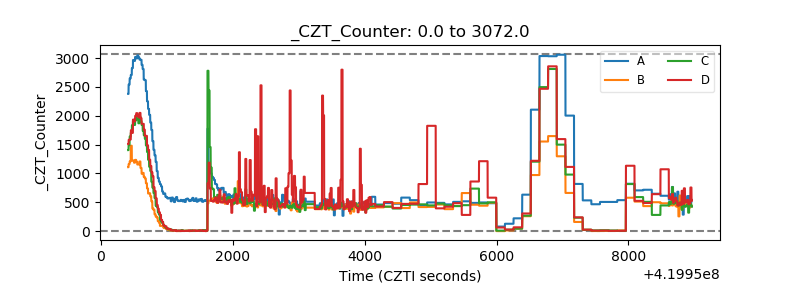 |
| +2.5 Volts monitor | 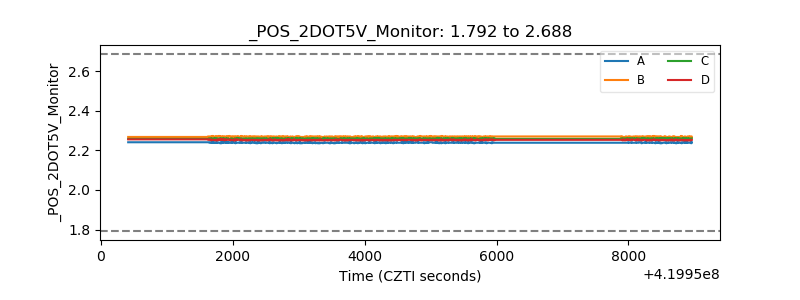 |
| +5 Volts monitor | 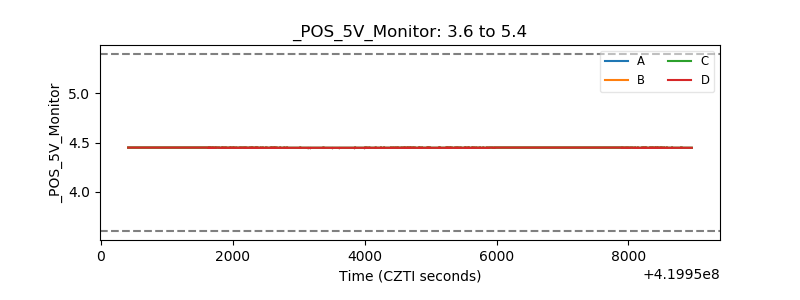 |
| _ROLL_ROT | 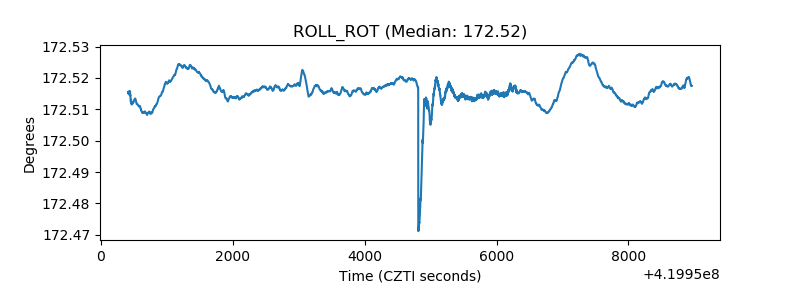 |
| _Roll_DEC | 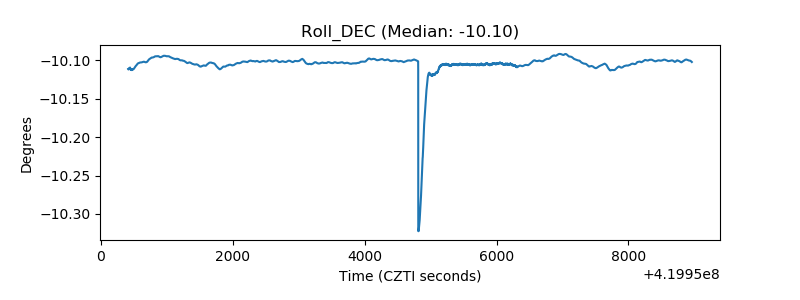 |
| _Roll_RA | 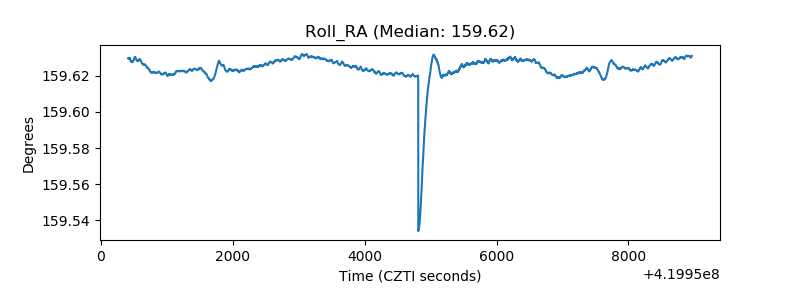 |
| Veto Counter | 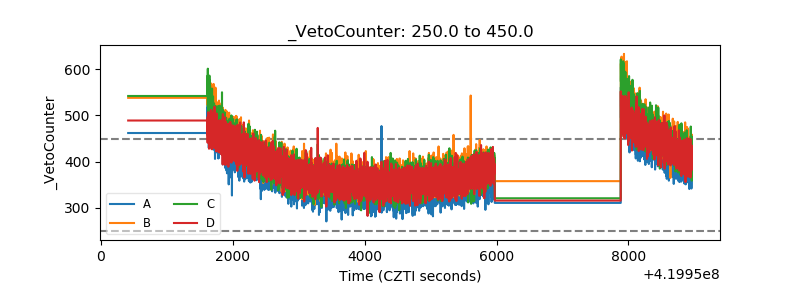 |