| Param | Original file | Final file |
|---|---|---|
| Filename | modeM0/AS1A12_044T19_9000005580_40923cztM0_level2.fits | modeM0/AS1A12_044T19_9000005580_40923cztM0_level2_quad_clean.evt |
| Size (bytes) | 133,983,360 | 35,259,840 |
| Size | 127.8 MB | 33.6 MB |
| Events in quadrant A | 1,154,727 | 245,234 |
| Events in quadrant B | 928,014 | 247,328 |
| Events in quadrant C | 1,027,078 | 227,065 |
| Events in quadrant D | 1,694,552 | 205,370 |
| Mode M9 | |||
|---|---|---|---|
| Quadrant | BADHDUFLAG | Total packets | Discarded packets |
| A | 0 | 1 | 0 |
| B | 0 | 1 | 0 |
| C | 0 | 1 | 0 |
| D | 0 | 2 | 0 |
| Mode SS | |||
|---|---|---|---|
| Quadrant | BADHDUFLAG | Total packets | Discarded packets |
| A | 0 | 40 | 0 |
| B | 0 | 40 | 0 |
| C | 0 | 40 | 0 |
| D | 0 | 40 | 0 |
| Mode M0 | |||
|---|---|---|---|
| Quadrant | BADHDUFLAG | Total packets | Discarded packets |
| A | 0 | 4658 | 1 |
| B | 0 | 4068 | 1 |
| C | 0 | 4281 | 1 |
| D | 0 | 6325 | 1 |
| Quadrant | Total seconds | Saturated seconds | Saturation percentage |
|---|---|---|---|
| A | 1963 | 8 | 0.407539% |
| B | 1963 | 9 | 0.458482% |
| C | 1963 | 33 | 1.681100% |
| D | 1963 | 151 | 7.692308% |
Noise dominated data is calculated using 1-second bins in cleaned event files. If a bin has >2000 counts, and if more than 50% of those come from <1% of pixels, then it is considered to be noise-dominated and hence unusable.
| Quadrant | # 1 sec bins | Bins with >0 counts | Bins with >2000 counts | High rate bins dominated by noise | Noise dominated (total time) | Noise dominated (detector-on time) | Marked lightcurve |
|---|---|---|---|---|---|---|---|
| A | 1963 | 1963 | 2 | 2 | 0.10% | 0.10% | 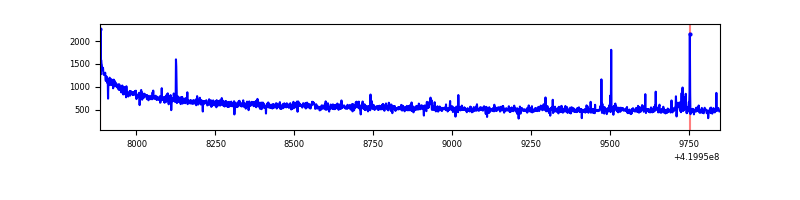 |
| B | 1963 | 1963 | 6 | 6 | 0.31% | 0.31% | 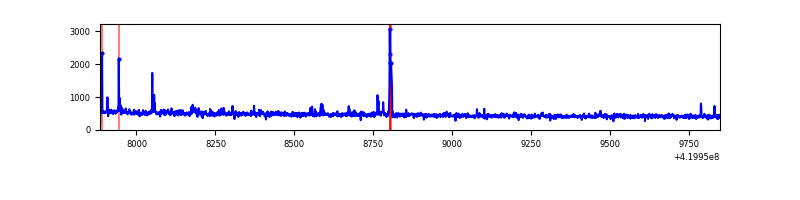 |
| C | 1963 | 1963 | 25 | 25 | 1.27% | 1.27% | 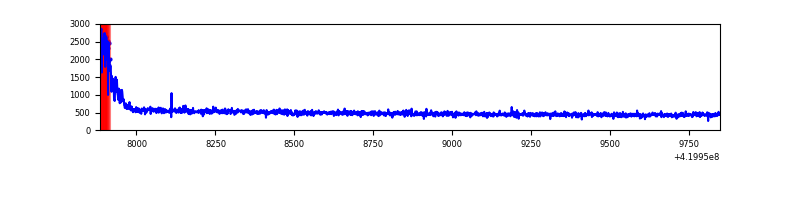 |
| D | 1963 | 1963 | 125 | 125 | 6.37% | 6.37% | 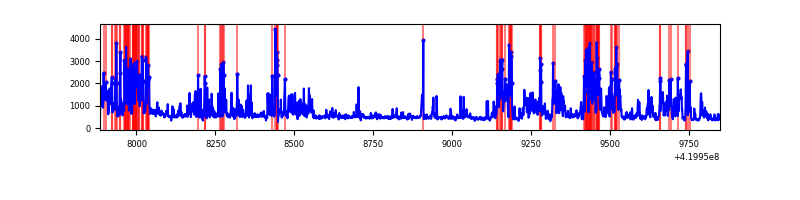 |
Top three noisy pixels from each quadrant. If the there are fewer than three noisy pixels in the level2.evt file, extra rows are filled as -1
| Pixel properties | Quadrant properties | ||||||
|---|---|---|---|---|---|---|---|
| Quadrant | DetID | PixID | Counts | Sigma | Mean | Median | Sigma |
| A | 10 | 83 | 224902 | 4578.16 | 234 | 229 | 49.1 |
| A | 13 | 248 | 12801 | 256.18 | 234 | 229 | 49.1 |
| A | 12 | 189 | 4566 | 88.38 | 234 | 229 | 49.1 |
| B | 0 | 229 | 25145 | 550.06 | 226 | 220 | 45.3 |
| B | 5 | 255 | 13534 | 293.82 | 226 | 220 | 45.3 |
| B | 12 | 111 | 5228 | 110.52 | 226 | 220 | 45.3 |
| C | 0 | 10 | 91207 | 1744.08 | 218 | 219 | 52.2 |
| C | 15 | 214 | 83956 | 1605.09 | 218 | 219 | 52.2 |
| C | 13 | 61 | 1432 | 23.25 | 218 | 219 | 52.2 |
| D | 2 | 249 | 498955 | 8998.02 | 219 | 212 | 55.4 |
| D | 13 | 249 | 164230 | 2959.11 | 219 | 212 | 55.4 |
| D | 12 | 233 | 61193 | 1100.18 | 219 | 212 | 55.4 |
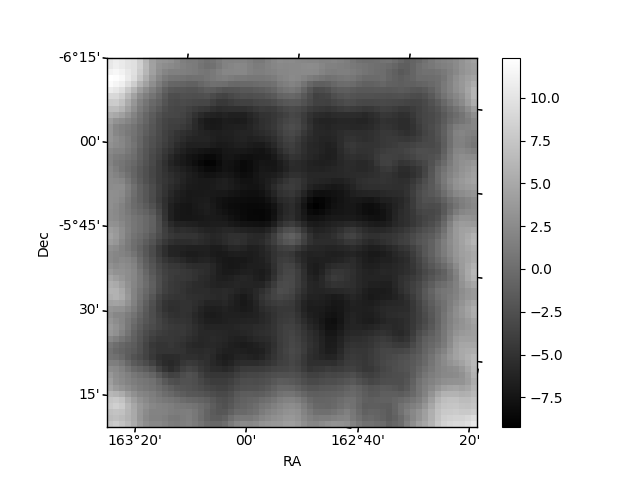
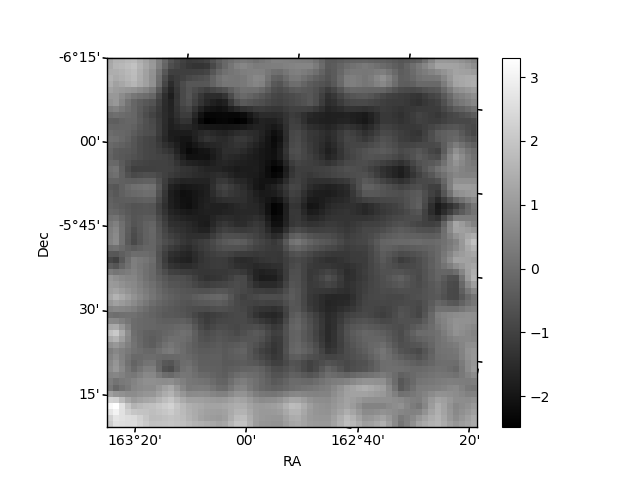
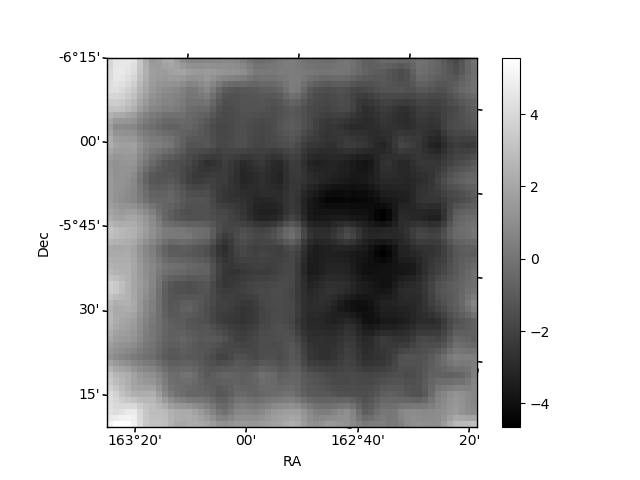
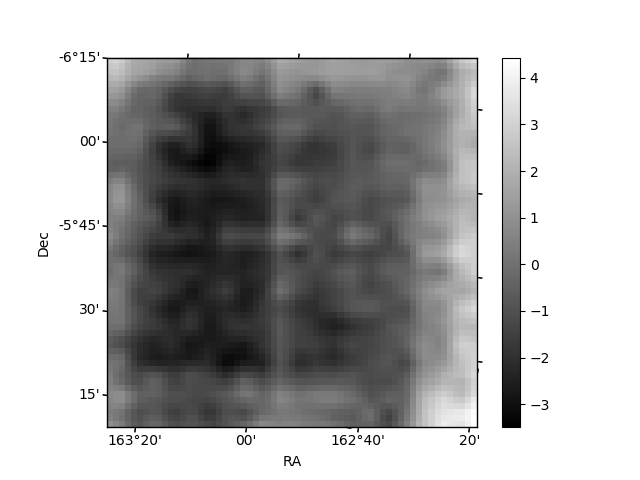
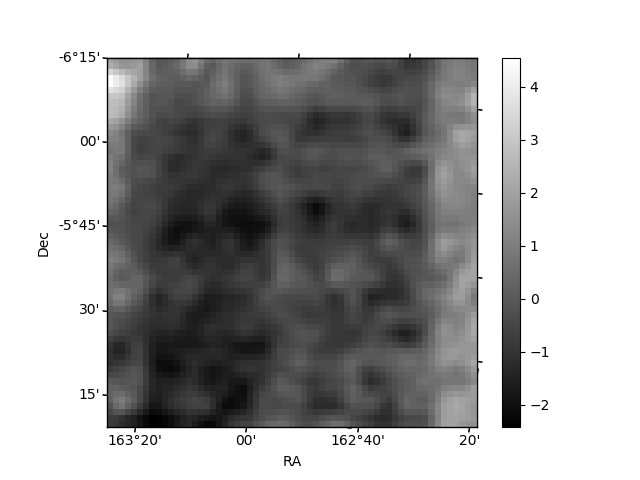
Histogram calculated using DETX and DETY for each event in the final _common_clean file
| Quadrant A | 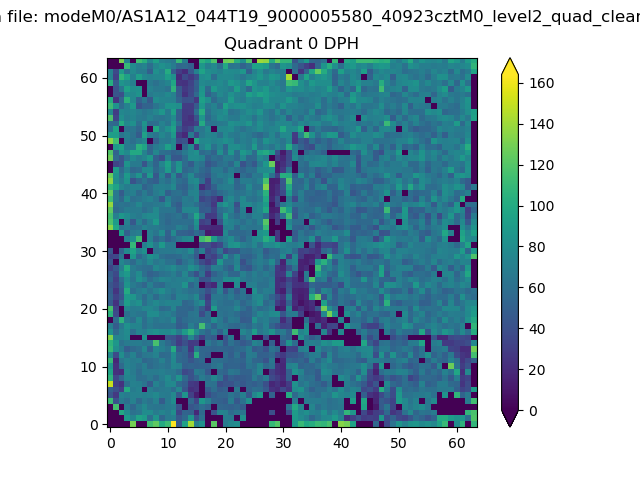 |
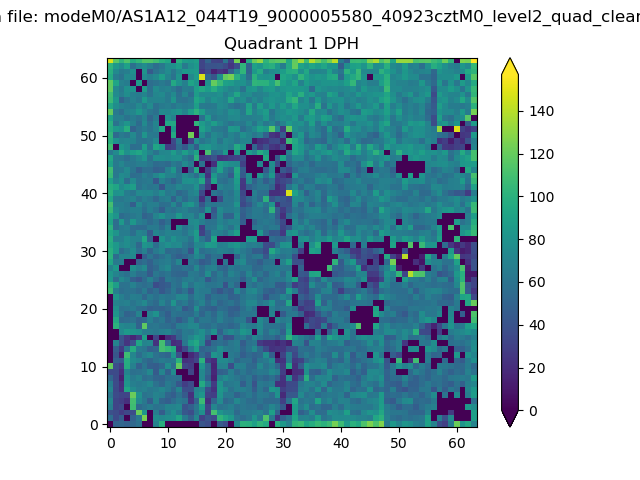 |
Quadrant B |
|---|---|---|---|
| Quadrant D | 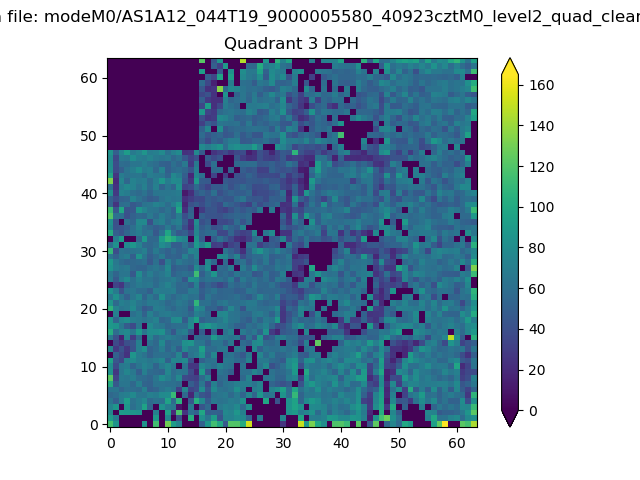 |
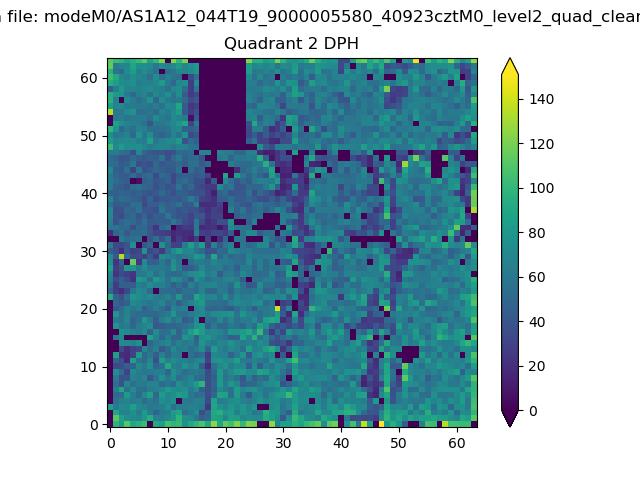 |
Quadrant C |
| Plot type | Count rate plots | Images |
|---|---|---|
| Comparison with Poisson distribution Blue bars denote a histogram of data divided into 1 sec bins. Red curve is a Poisson curve with rate = median count rate of data. |
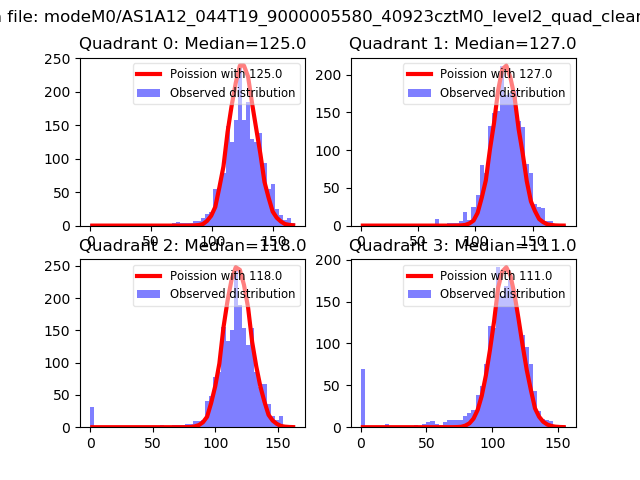 |
 |
| Quadrant-wise count rates Data is divided into 100 sec bins |
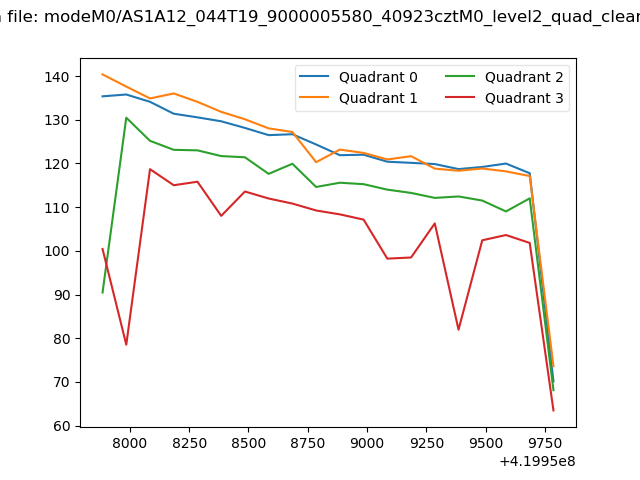 |
|
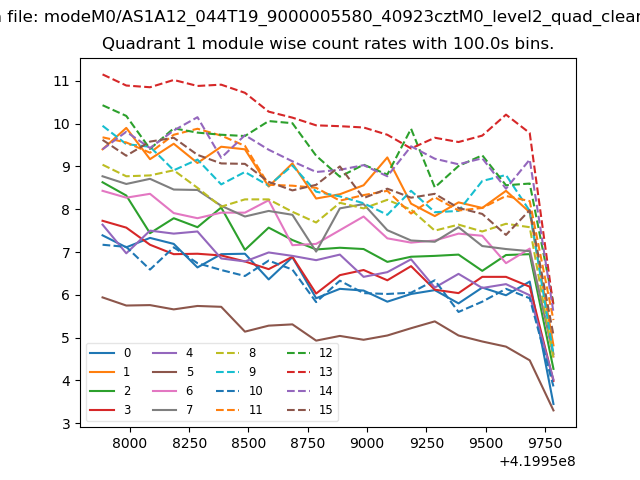
| Module-wise count rates for Quadrant A Data is divided into 100 sec bins |
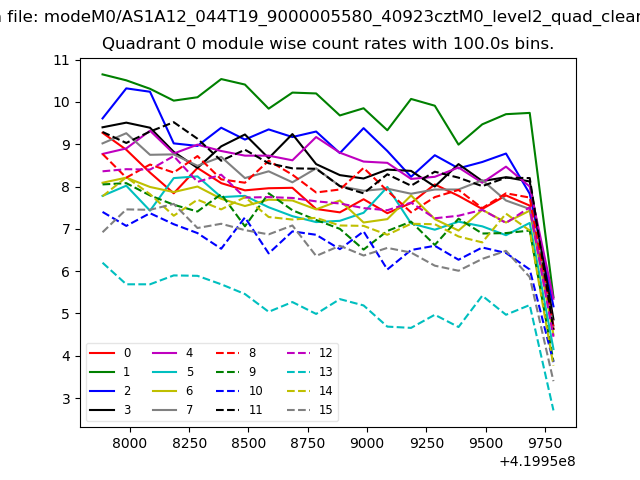 |
 |
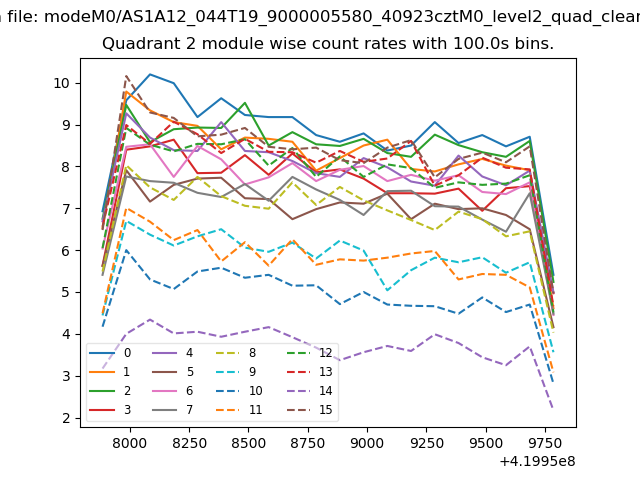
| Module-wise count rates for Quadrant B Data is divided into 100 sec bins |
 |
 |
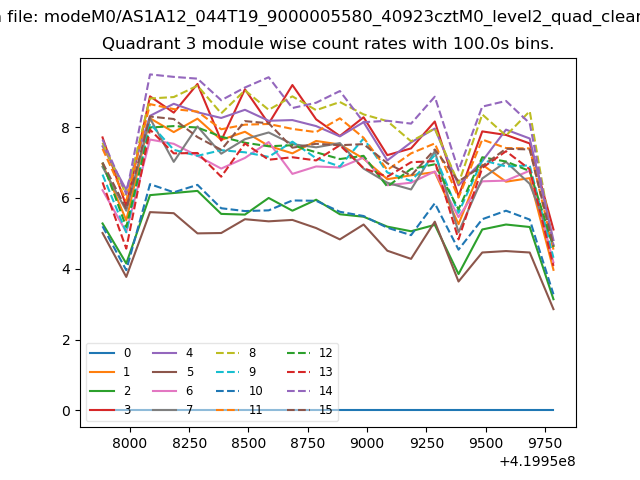
| Module-wise count rates for Quadrant C Data is divided into 100 sec bins |
 |
 |
| Module-wise count rates for Quadrant D Data is divided into 100 sec bins |
 |
 |
| Parameter | Plot |
|---|---|
| CZT HV Monitor | 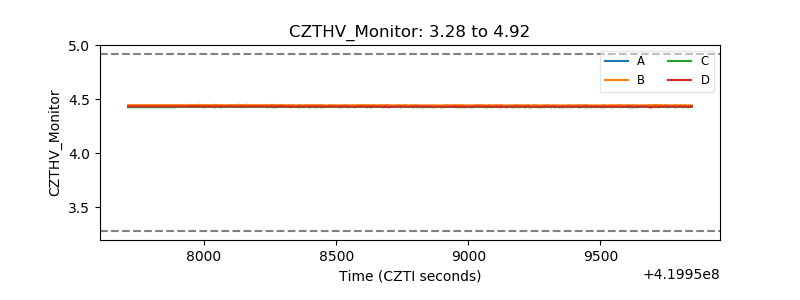 |
| D_VDD | 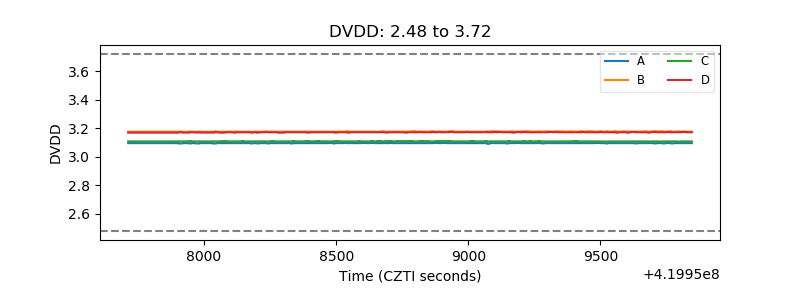 |
| Temperature 1 | 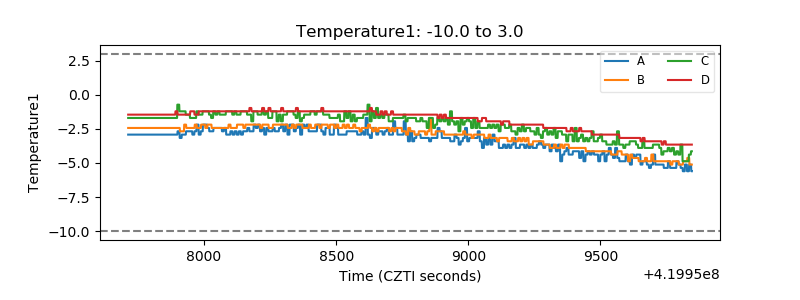 |
| Veto HV Monitor | 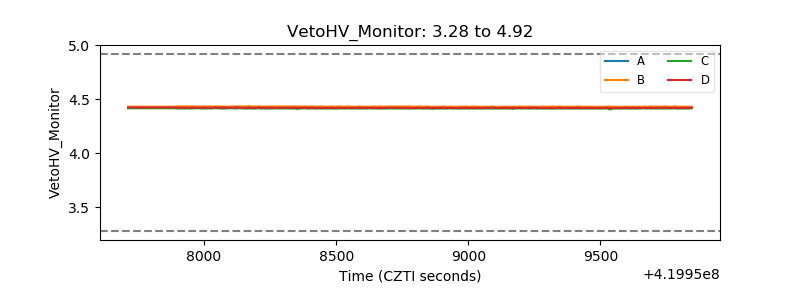 |
| Veto LLD | 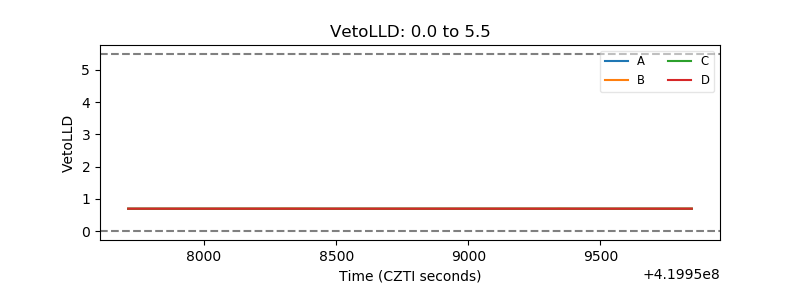 |
| Alpha Counter | 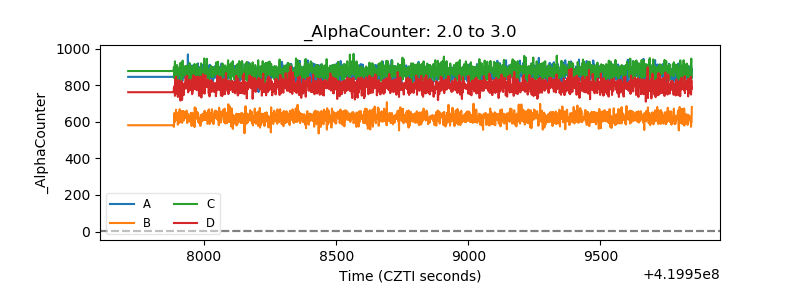 |
| _CPM_Rate | 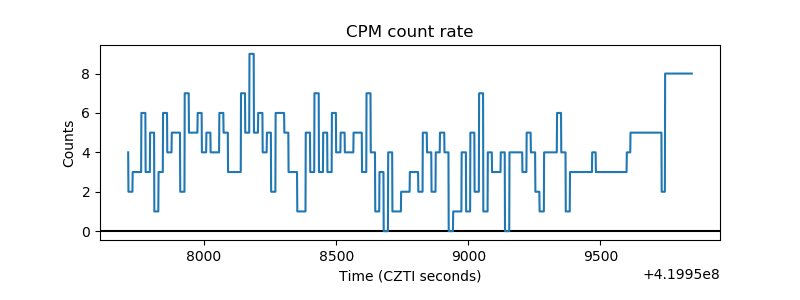 |
| CZT Counter | 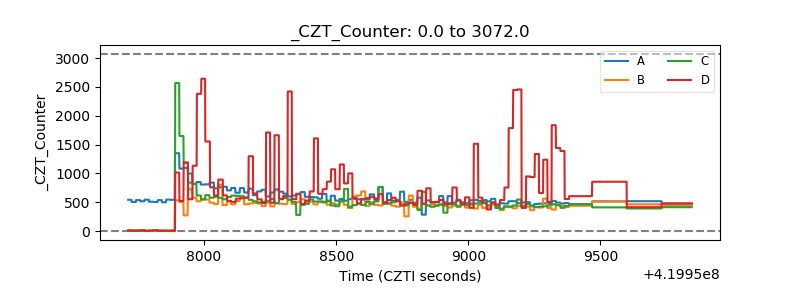 |
| +2.5 Volts monitor | 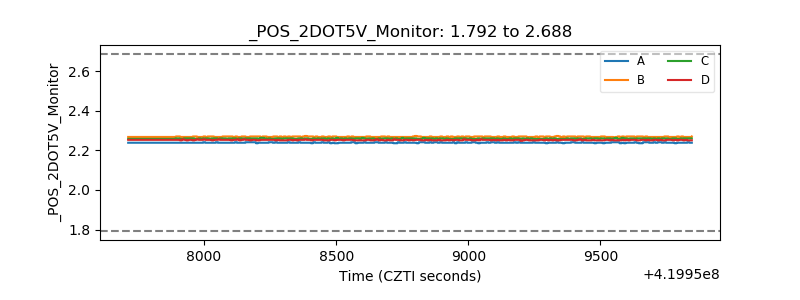 |
| +5 Volts monitor | 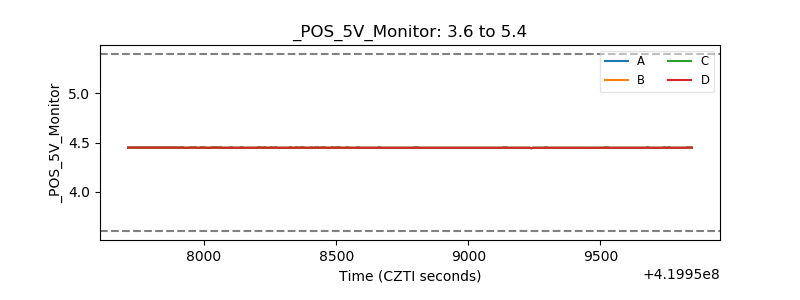 |
| _ROLL_ROT | 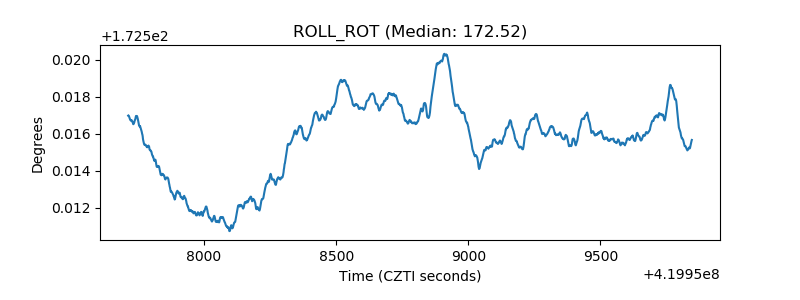 |
| _Roll_DEC | 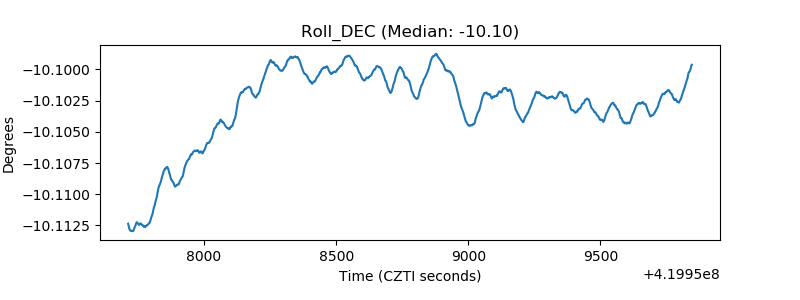 |
| _Roll_RA | 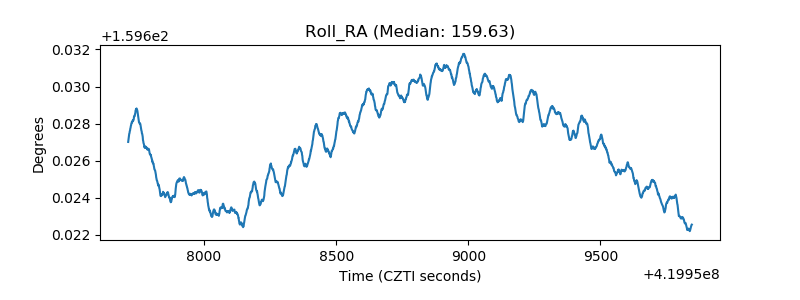 |
| Veto Counter | 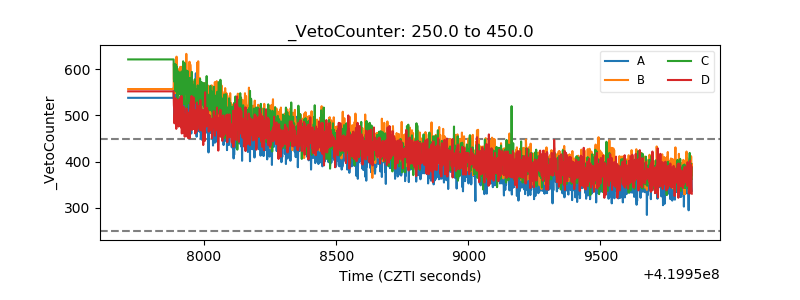 |