| Param | Original file | Final file |
|---|---|---|
| Filename | modeM0/AS1A12_052T04_9000005582_40923cztM0_level2.fits | modeM0/AS1A12_052T04_9000005582_40923cztM0_level2_quad_clean.evt |
| Size (bytes) | 122,760,000 | 34,922,880 |
| Size | 117.1 MB | 33.3 MB |
| Events in quadrant A | 1,113,567 | 240,073 |
| Events in quadrant B | 928,064 | 243,817 |
| Events in quadrant C | 1,036,132 | 226,187 |
| Events in quadrant D | 1,316,499 | 209,566 |
| Mode M9 | |||
|---|---|---|---|
| Quadrant | BADHDUFLAG | Total packets | Discarded packets |
| A | 0 | 20 | 0 |
| B | 0 | 20 | 0 |
| C | 0 | 20 | 0 |
| D | 0 | 20 | 0 |
| Mode SS | |||
|---|---|---|---|
| Quadrant | BADHDUFLAG | Total packets | Discarded packets |
| A | 0 | 40 | 0 |
| B | 0 | 40 | 0 |
| C | 0 | 40 | 0 |
| D | 0 | 40 | 0 |
| Mode M0 | |||
|---|---|---|---|
| Quadrant | BADHDUFLAG | Total packets | Discarded packets |
| A | 0 | 4453 | 2 |
| B | 0 | 3945 | 1 |
| C | 0 | 4125 | 1 |
| D | 0 | 5148 | 1 |
| Quadrant | Total seconds | Saturated seconds | Saturation percentage |
|---|---|---|---|
| A | 1894 | 10 | 0.527983% |
| B | 1894 | 8 | 0.422386% |
| C | 1894 | 31 | 1.636748% |
| D | 1894 | 73 | 3.854277% |
Noise dominated data is calculated using 1-second bins in cleaned event files. If a bin has >2000 counts, and if more than 50% of those come from <1% of pixels, then it is considered to be noise-dominated and hence unusable.
| Quadrant | # 1 sec bins | Bins with >0 counts | Bins with >2000 counts | High rate bins dominated by noise | Noise dominated (total time) | Noise dominated (detector-on time) | Marked lightcurve |
|---|---|---|---|---|---|---|---|
| A | 3896 | 1895 | 5 | 5 | 0.13% | 0.26% | 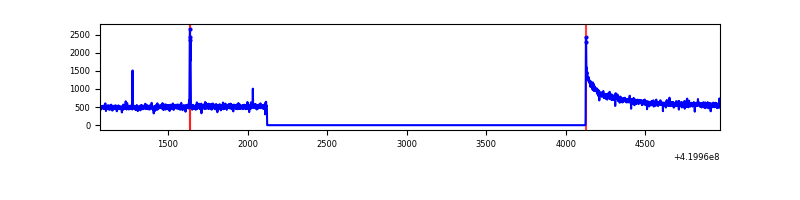 |
| B | 3896 | 1895 | 3 | 3 | 0.08% | 0.16% | 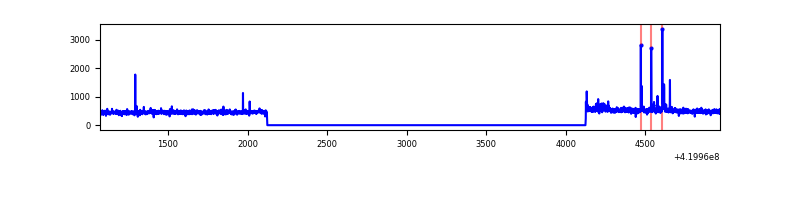 |
| C | 3896 | 1895 | 30 | 30 | 0.77% | 1.58% | 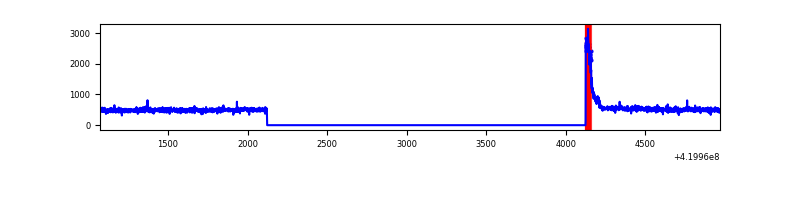 |
| D | 3896 | 1895 | 56 | 56 | 1.44% | 2.96% | 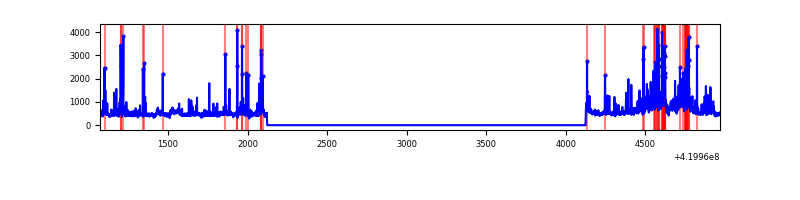 |
Top three noisy pixels from each quadrant. If the there are fewer than three noisy pixels in the level2.evt file, extra rows are filled as -1
| Pixel properties | Quadrant properties | ||||||
|---|---|---|---|---|---|---|---|
| Quadrant | DetID | PixID | Counts | Sigma | Mean | Median | Sigma |
| A | 10 | 83 | 213855 | 4500.21 | 227 | 223 | 47.5 |
| A | 9 | 254 | 14720 | 305.38 | 227 | 223 | 47.5 |
| A | 13 | 254 | 2830 | 54.92 | 227 | 223 | 47.5 |
| B | 5 | 255 | 35338 | 789.41 | 225 | 220 | 44.5 |
| B | 12 | 111 | 5187 | 111.65 | 225 | 220 | 44.5 |
| B | 11 | 111 | 4775 | 102.39 | 225 | 220 | 44.5 |
| C | 0 | 10 | 95256 | 1831.51 | 218 | 220 | 51.9 |
| C | 15 | 214 | 81834 | 1572.85 | 218 | 220 | 51.9 |
| C | 0 | 239 | 5102 | 94.08 | 218 | 220 | 51.9 |
| D | 1 | 47 | 155375 | 2859.47 | 218 | 212 | 54.3 |
| D | 2 | 249 | 82987 | 1525.44 | 218 | 212 | 54.3 |
| D | 12 | 233 | 77783 | 1429.54 | 218 | 212 | 54.3 |
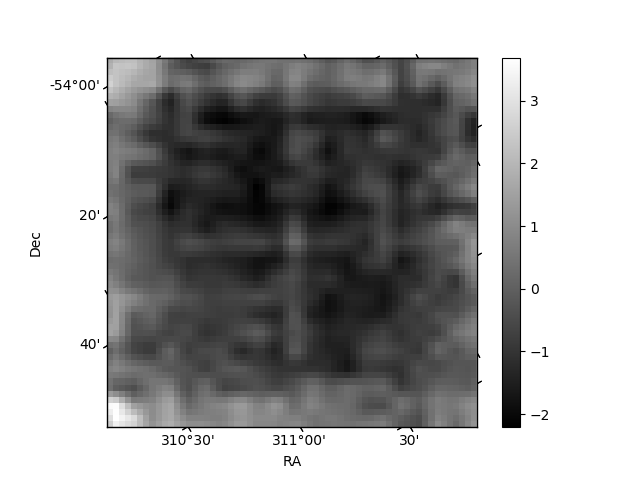
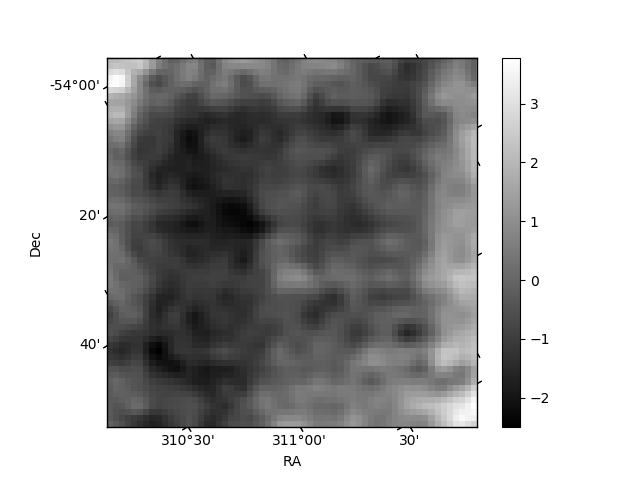
Histogram calculated using DETX and DETY for each event in the final _common_clean file
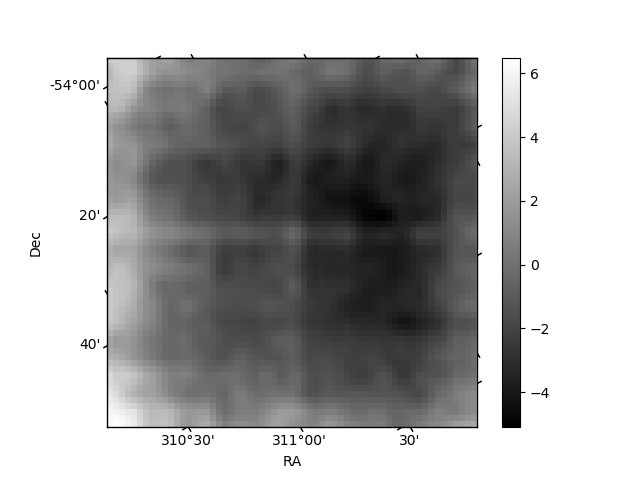
| Quadrant A | 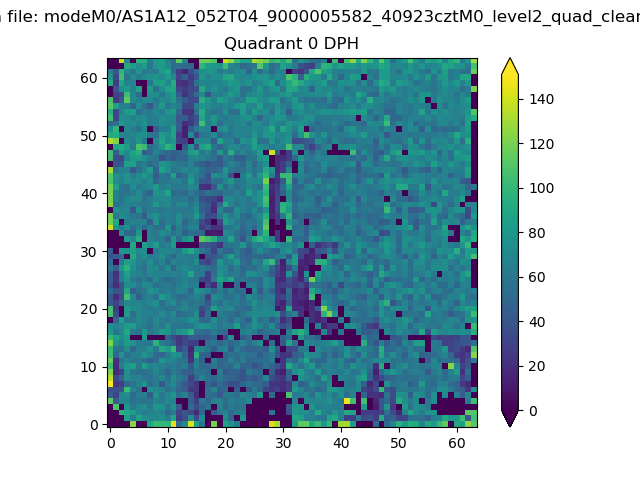 |
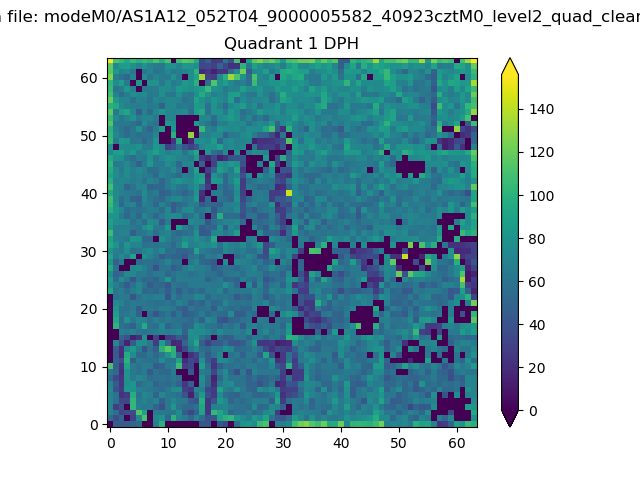 |
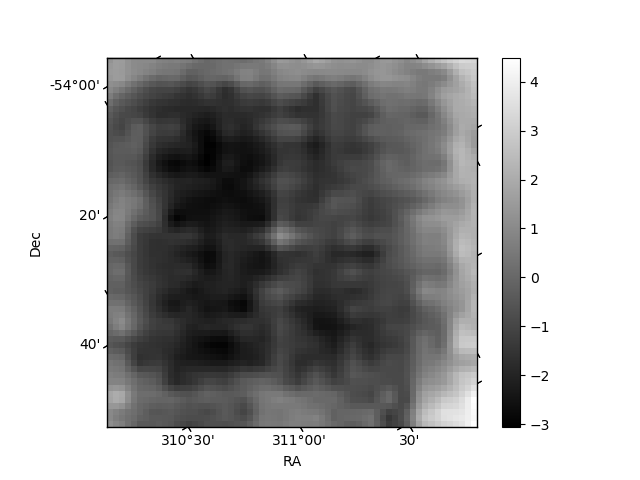
Quadrant B |
|---|---|---|---|
| Quadrant D | 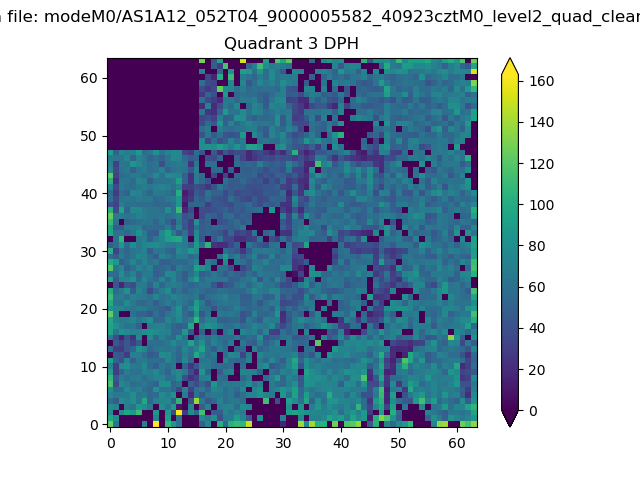 |
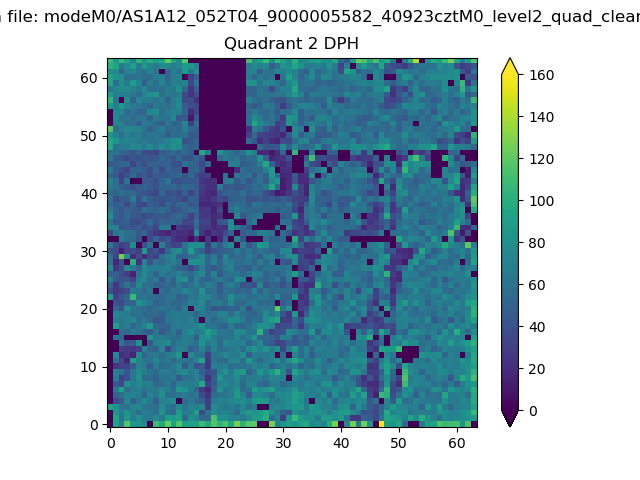 |
Quadrant C |
| Plot type | Count rate plots | Images |
|---|---|---|
| Comparison with Poisson distribution Blue bars denote a histogram of data divided into 1 sec bins. Red curve is a Poisson curve with rate = median count rate of data. |
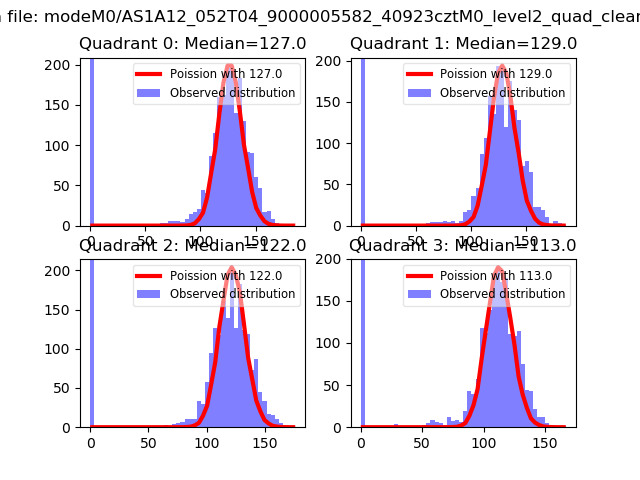 |
 |
| Quadrant-wise count rates Data is divided into 100 sec bins |
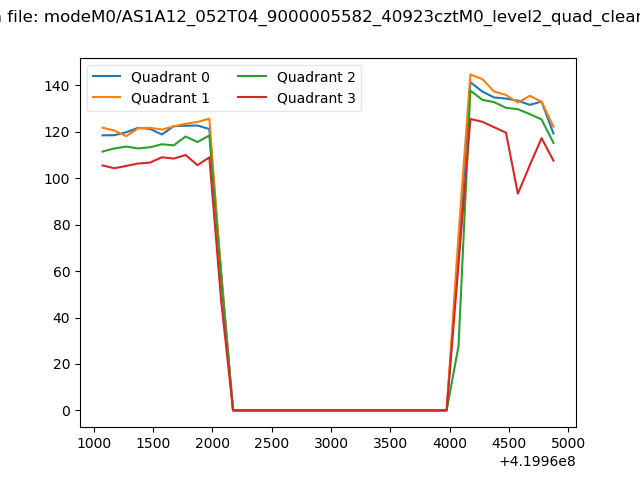 |
|
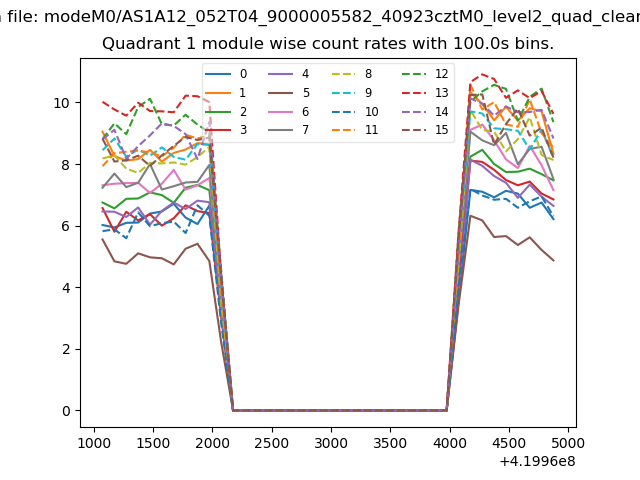
| Module-wise count rates for Quadrant A Data is divided into 100 sec bins |
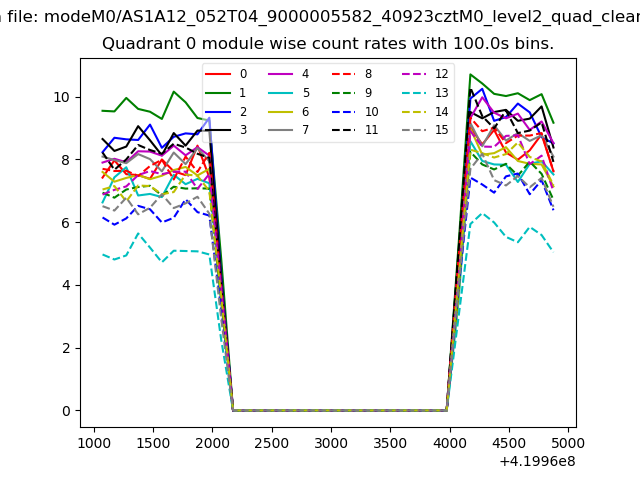 |
 |
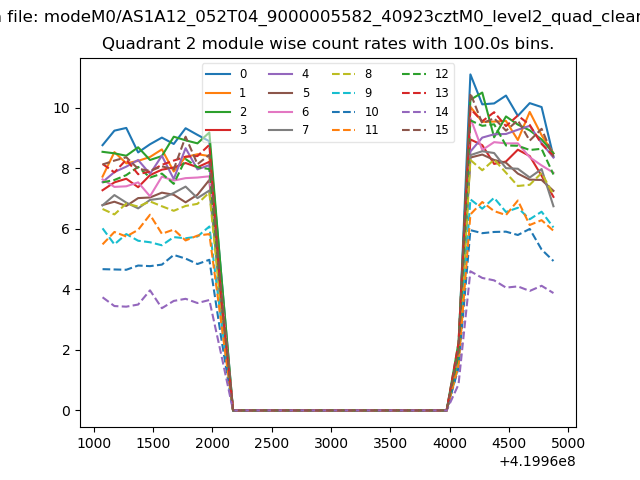
| Module-wise count rates for Quadrant B Data is divided into 100 sec bins |
 |
 |
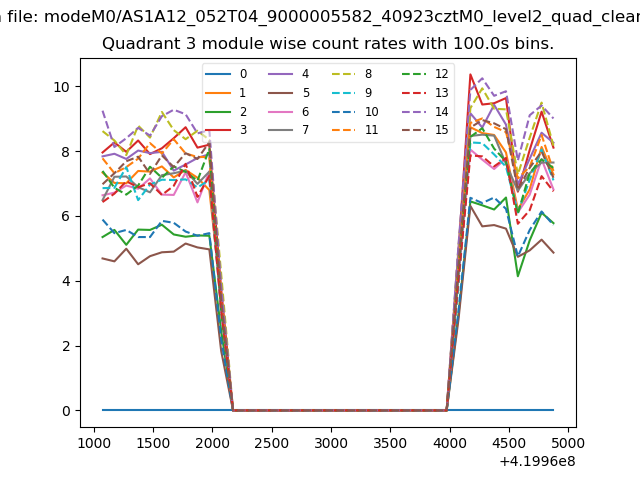
| Module-wise count rates for Quadrant C Data is divided into 100 sec bins |
 |
 |
| Module-wise count rates for Quadrant D Data is divided into 100 sec bins |
 |
 |
| Parameter | Plot |
|---|---|
| CZT HV Monitor | 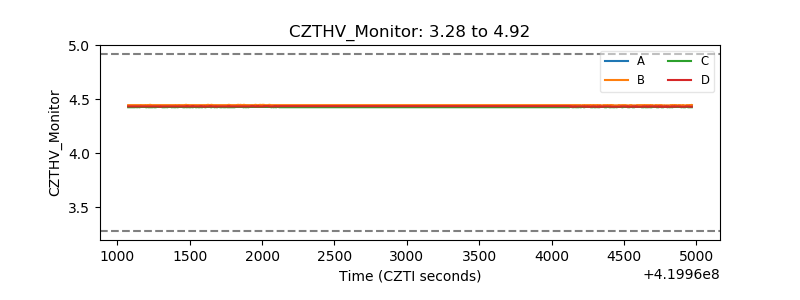 |
| D_VDD | 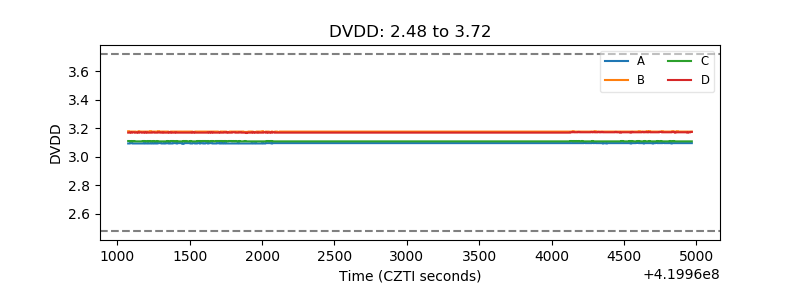 |
| Temperature 1 | 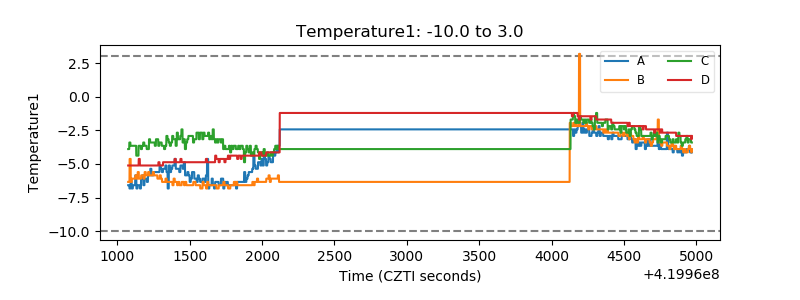 |
| Veto HV Monitor | 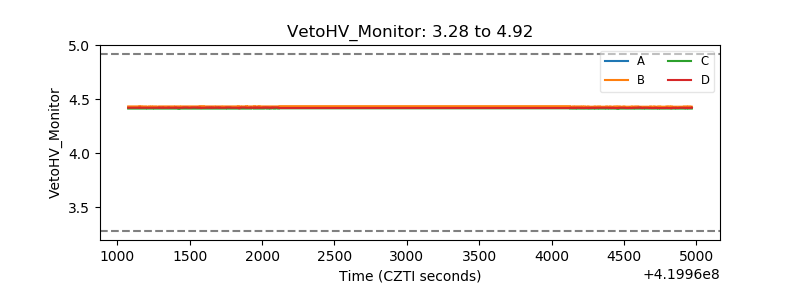 |
| Veto LLD | 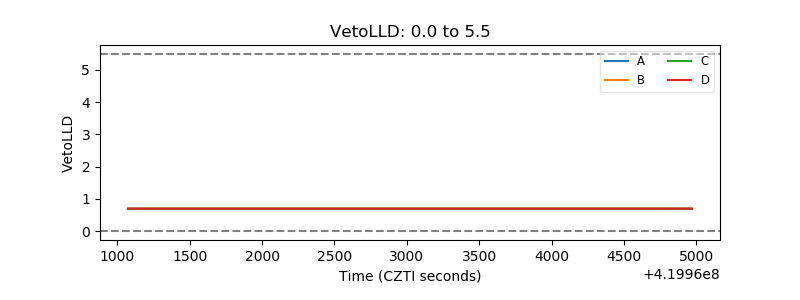 |
| Alpha Counter | 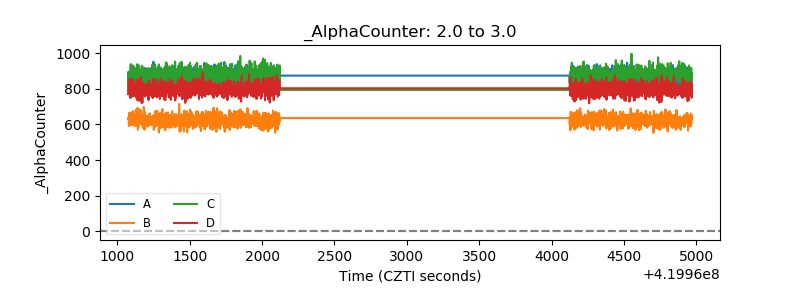 |
| _CPM_Rate |  |
| CZT Counter |  |
| +2.5 Volts monitor | 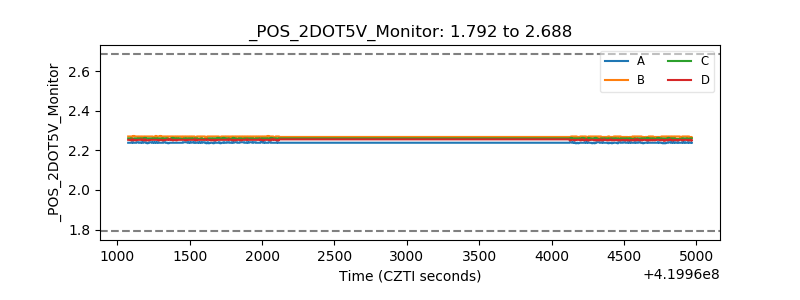 |
| +5 Volts monitor | 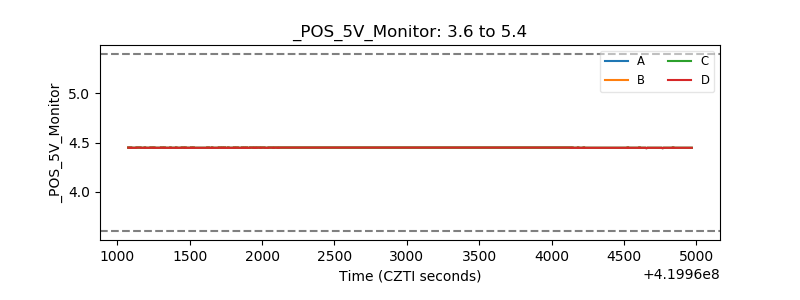 |
| _ROLL_ROT | 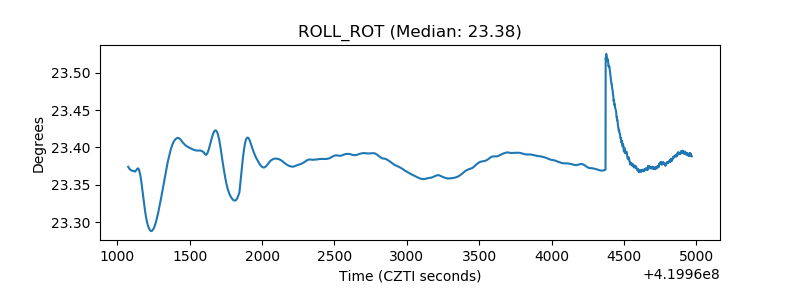 |
| _Roll_DEC | 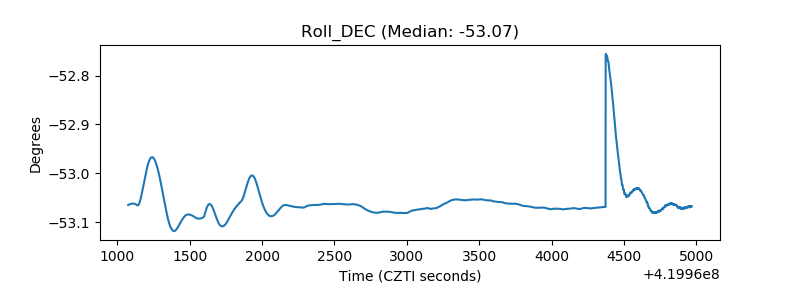 |
| _Roll_RA | 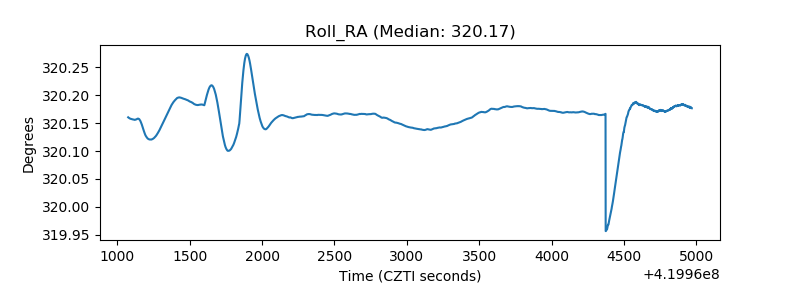 |
| Veto Counter | 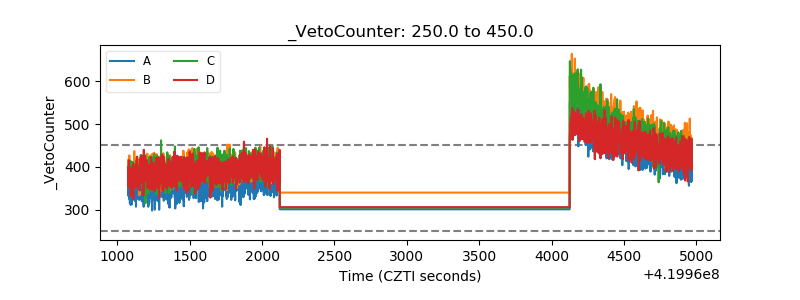 |