| Param | Original file | Final file |
|---|---|---|
| Filename | modeM0/AS1A12_052T04_9000005582_40924cztM0_level2.fits | modeM0/AS1A12_052T04_9000005582_40924cztM0_level2_quad_clean.evt |
| Size (bytes) | 308,770,560 | 90,861,120 |
| Size | 294.5 MB | 86.7 MB |
| Events in quadrant A | 2,779,508 | 627,704 |
| Events in quadrant B | 2,410,171 | 637,508 |
| Events in quadrant C | 2,648,790 | 588,170 |
| Events in quadrant D | 3,202,918 | 549,147 |
| Mode M9 | |||
|---|---|---|---|
| Quadrant | BADHDUFLAG | Total packets | Discarded packets |
| A | 0 | 31 | 0 |
| B | 0 | 31 | 0 |
| C | 0 | 31 | 0 |
| D | 0 | 32 | 0 |
| Mode SS | |||
|---|---|---|---|
| Quadrant | BADHDUFLAG | Total packets | Discarded packets |
| A | 0 | 100 | 0 |
| B | 0 | 100 | 0 |
| C | 0 | 100 | 0 |
| D | 0 | 100 | 0 |
| Mode M0 | |||
|---|---|---|---|
| Quadrant | BADHDUFLAG | Total packets | Discarded packets |
| A | 0 | 11187 | 3 |
| B | 0 | 10333 | 2 |
| C | 0 | 10760 | 2 |
| D | 0 | 12854 | 2 |
| Quadrant | Total seconds | Saturated seconds | Saturation percentage |
|---|---|---|---|
| A | 4982 | 15 | 0.301084% |
| B | 4982 | 21 | 0.421517% |
| C | 4982 | 67 | 1.344841% |
| D | 4982 | 109 | 2.187876% |
Noise dominated data is calculated using 1-second bins in cleaned event files. If a bin has >2000 counts, and if more than 50% of those come from <1% of pixels, then it is considered to be noise-dominated and hence unusable.
| Quadrant | # 1 sec bins | Bins with >0 counts | Bins with >2000 counts | High rate bins dominated by noise | Noise dominated (total time) | Noise dominated (detector-on time) | Marked lightcurve |
|---|---|---|---|---|---|---|---|
| A | 7074 | 4983 | 3 | 3 | 0.04% | 0.06% | 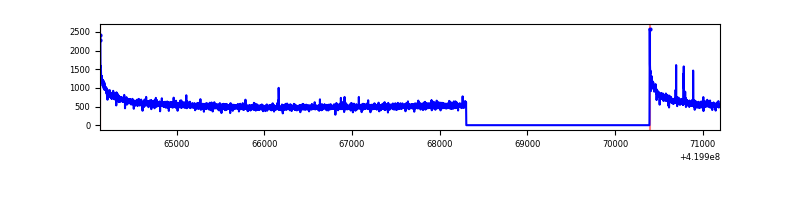 |
| B | 7074 | 4983 | 9 | 9 | 0.13% | 0.18% | 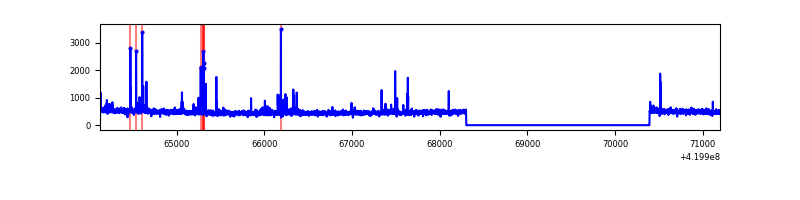 |
| C | 7074 | 4983 | 65 | 65 | 0.92% | 1.30% | 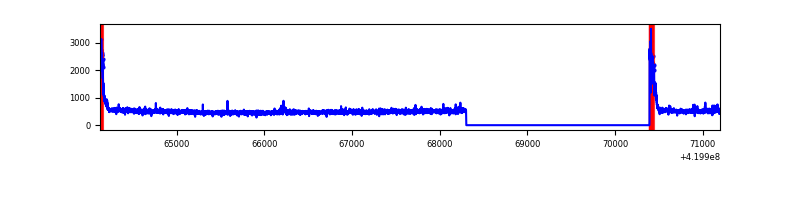 |
| D | 7074 | 4983 | 92 | 92 | 1.30% | 1.85% | 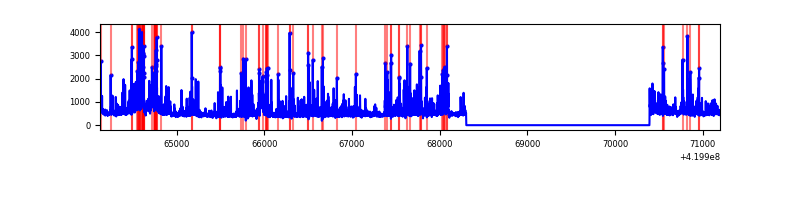 |
Top three noisy pixels from each quadrant. If the there are fewer than three noisy pixels in the level2.evt file, extra rows are filled as -1
| Pixel properties | Quadrant properties | ||||||
|---|---|---|---|---|---|---|---|
| Quadrant | DetID | PixID | Counts | Sigma | Mean | Median | Sigma |
| A | 10 | 83 | 496791 | 4201.61 | 585 | 573 | 118.1 |
| A | 7 | 3 | 12759 | 103.18 | 585 | 573 | 118.1 |
| A | 13 | 254 | 8002 | 62.9 | 585 | 573 | 118.1 |
| B | 5 | 255 | 111671 | 1001.97 | 581 | 567 | 110.9 |
| B | 12 | 111 | 13673 | 118.19 | 581 | 567 | 110.9 |
| B | 11 | 111 | 12571 | 108.26 | 581 | 567 | 110.9 |
| C | 0 | 10 | 214212 | 1654.37 | 560 | 566 | 129.1 |
| C | 15 | 214 | 210830 | 1628.19 | 560 | 566 | 129.1 |
| C | 0 | 239 | 34321 | 261.38 | 560 | 566 | 129.1 |
| D | 1 | 47 | 339483 | 2492.33 | 559 | 544 | 136.0 |
| D | 2 | 249 | 199862 | 1465.65 | 559 | 544 | 136.0 |
| D | 12 | 6 | 178908 | 1311.57 | 559 | 544 | 136.0 |
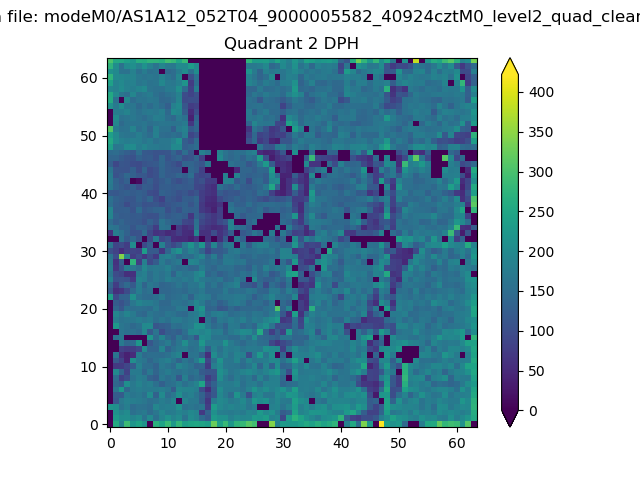
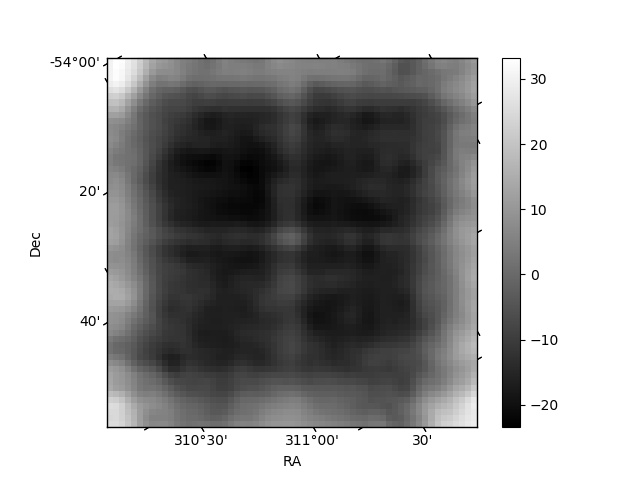
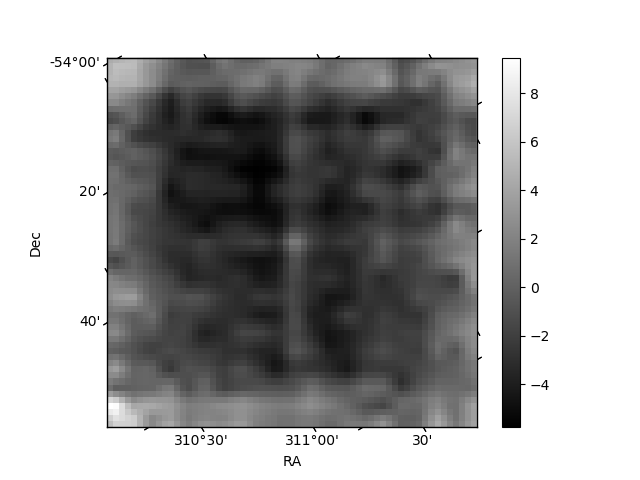
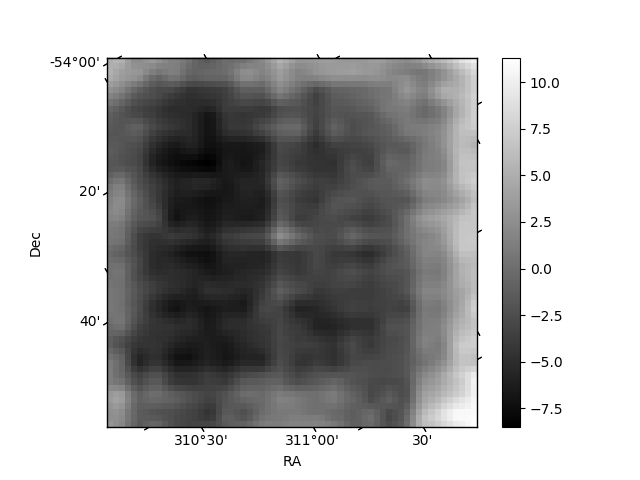
Histogram calculated using DETX and DETY for each event in the final _common_clean file
| Quadrant A | 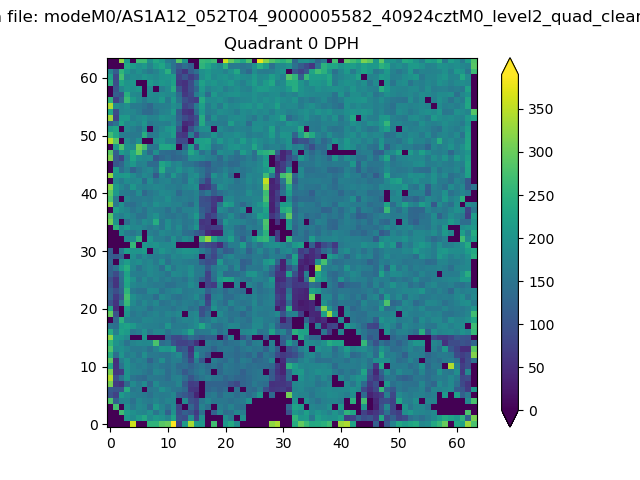 |
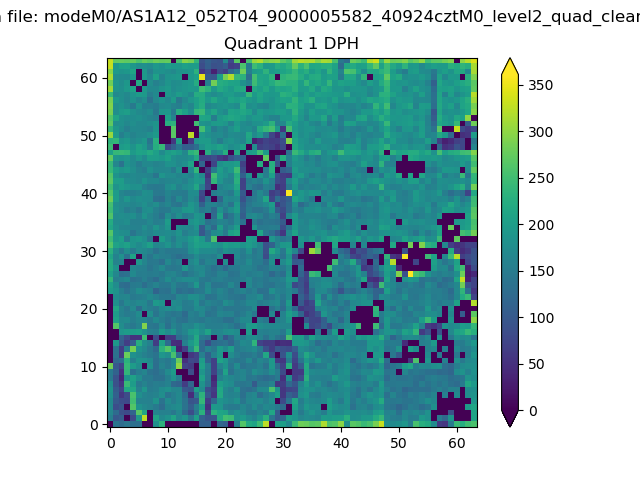 |
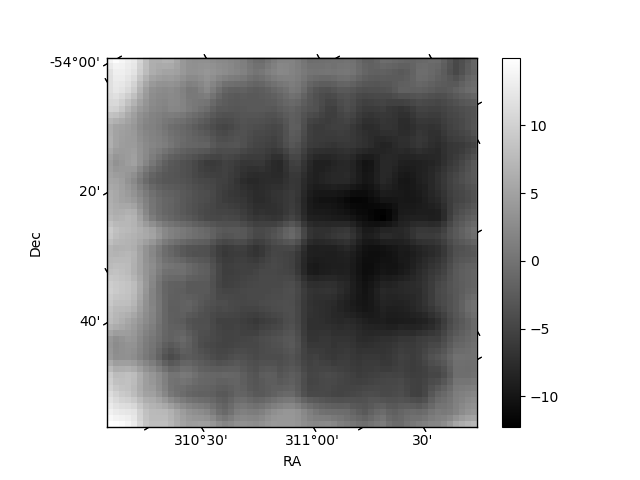
Quadrant B |
|---|---|---|---|
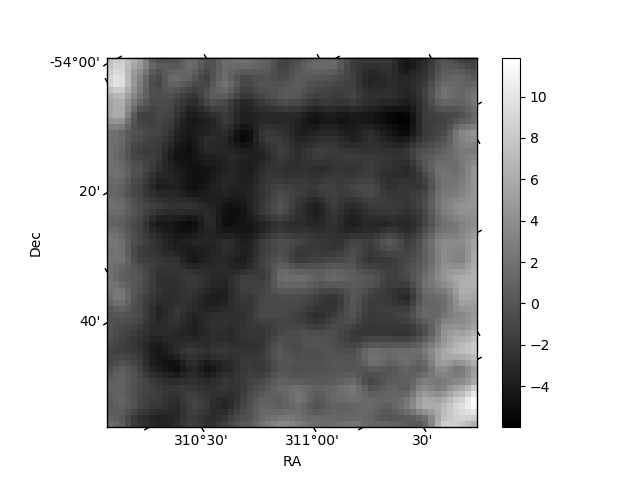
| Quadrant D | 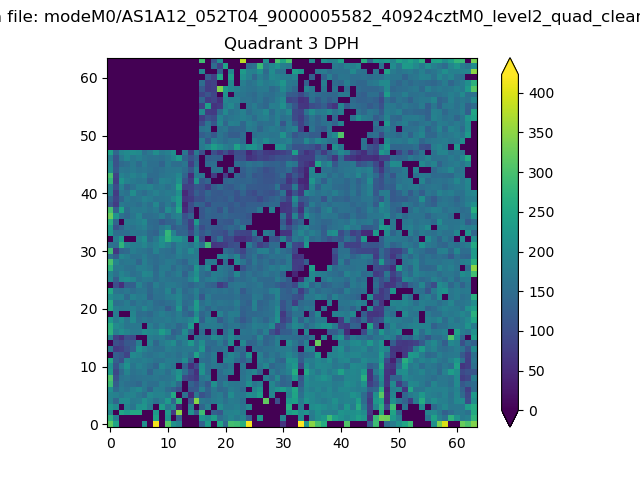 |
 |
Quadrant C |
| Plot type | Count rate plots | Images |
|---|---|---|
| Comparison with Poisson distribution Blue bars denote a histogram of data divided into 1 sec bins. Red curve is a Poisson curve with rate = median count rate of data. |
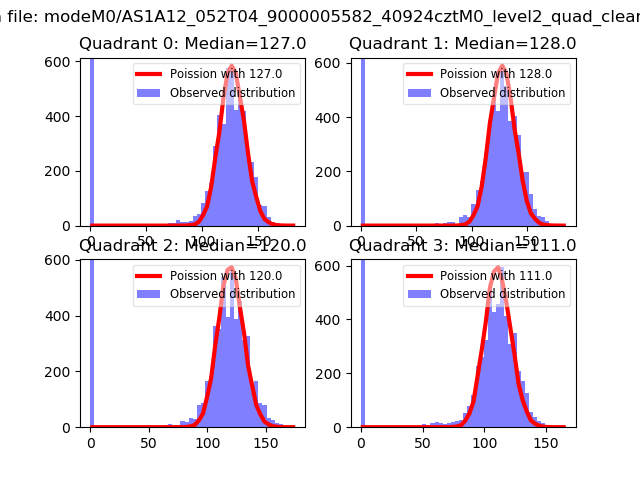 |
 |
| Quadrant-wise count rates Data is divided into 100 sec bins |
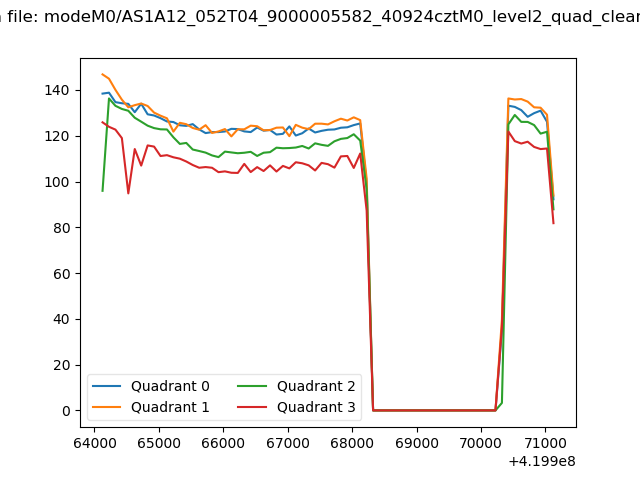 |
|
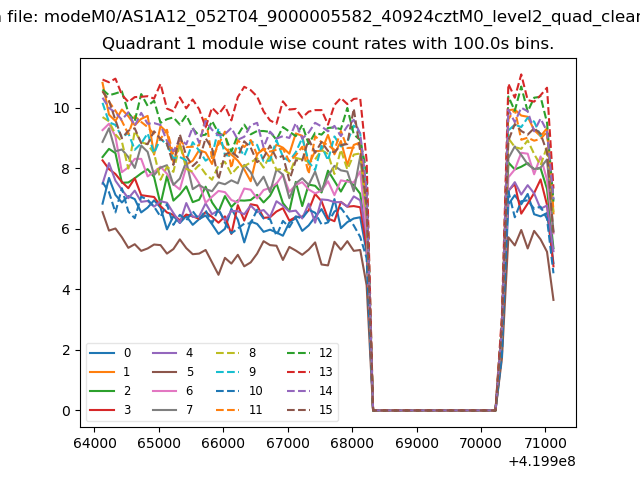
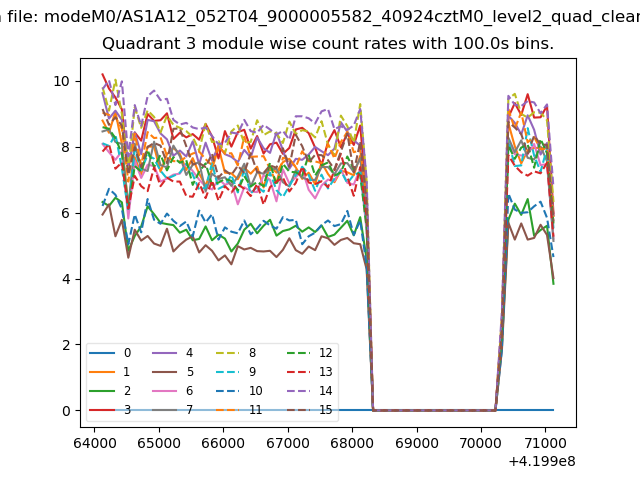
| Module-wise count rates for Quadrant A Data is divided into 100 sec bins |
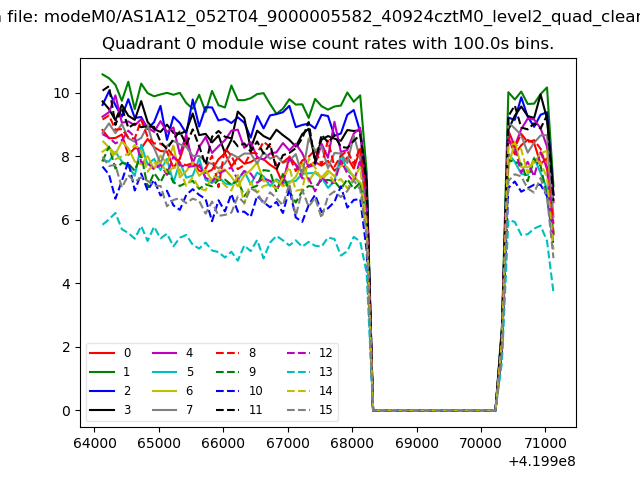 |
 |
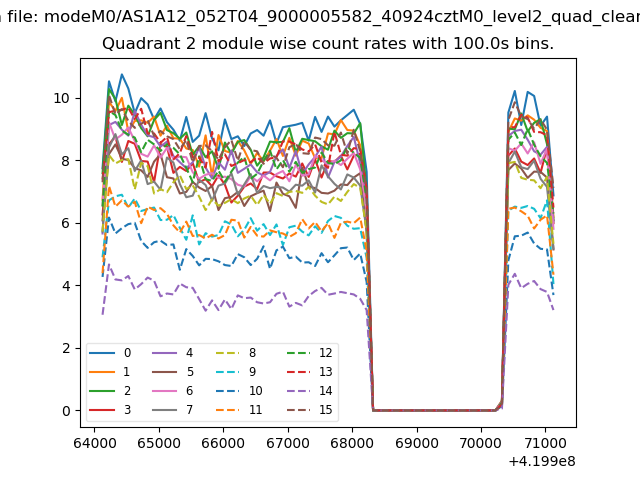
| Module-wise count rates for Quadrant B Data is divided into 100 sec bins |
 |
 |
| Module-wise count rates for Quadrant C Data is divided into 100 sec bins |
 |
 |
| Module-wise count rates for Quadrant D Data is divided into 100 sec bins |
 |
 |
| Parameter | Plot |
|---|---|
| CZT HV Monitor | 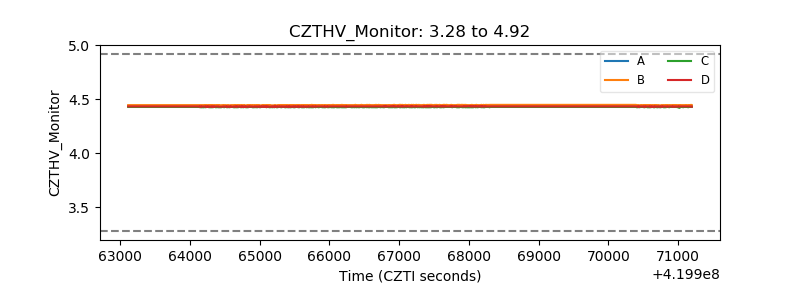 |
| D_VDD | 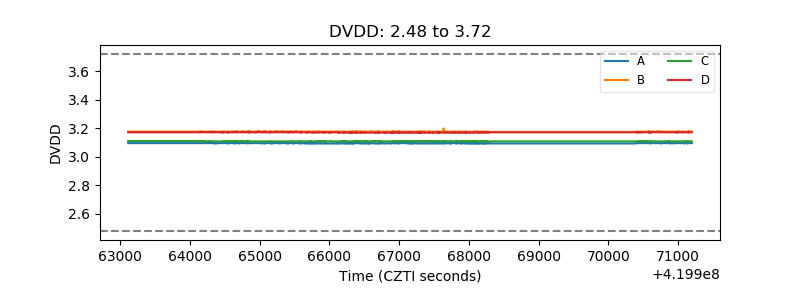 |
| Temperature 1 | 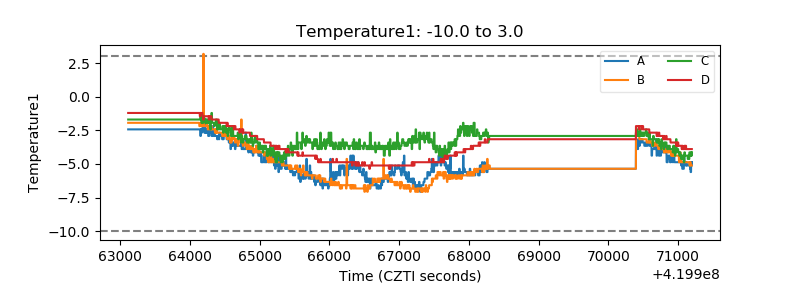 |
| Veto HV Monitor | 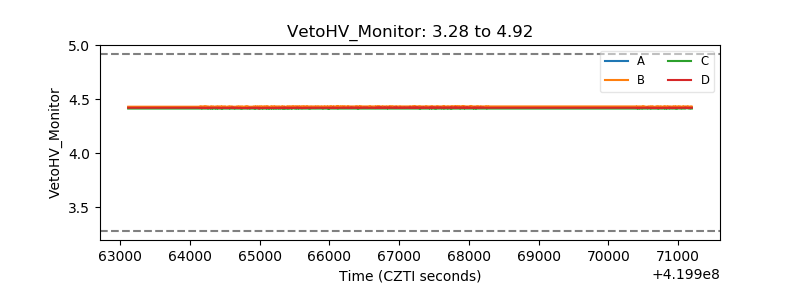 |
| Veto LLD | 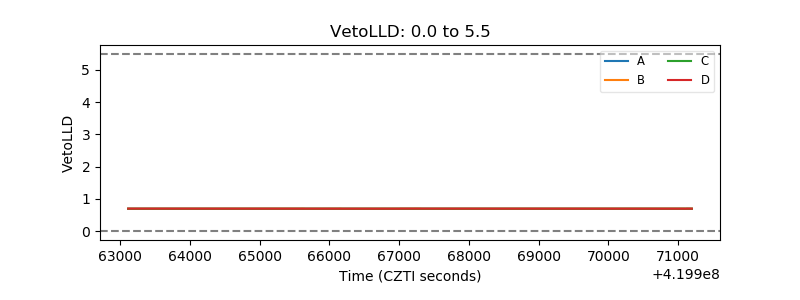 |
| Alpha Counter | 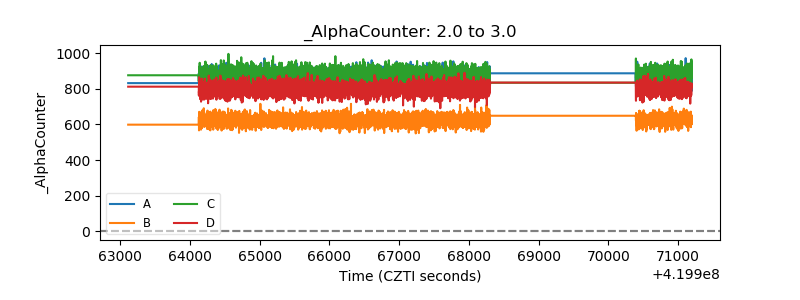 |
| _CPM_Rate | 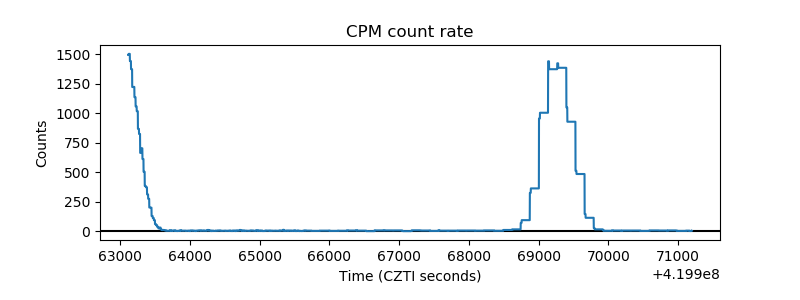 |
| CZT Counter | 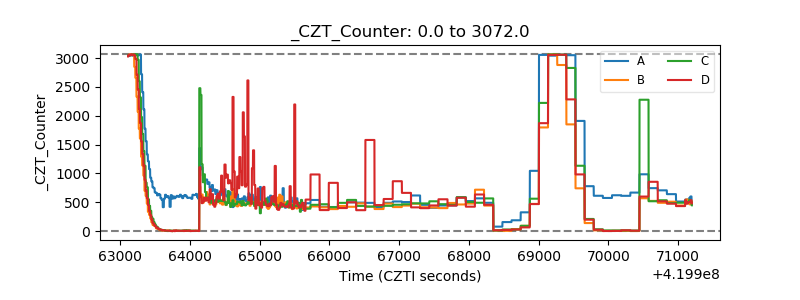 |
| +2.5 Volts monitor | 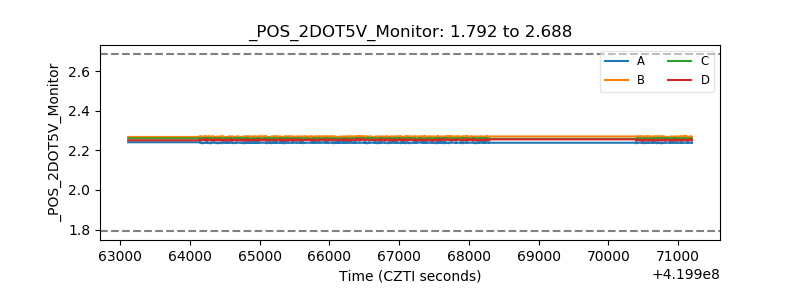 |
| +5 Volts monitor | 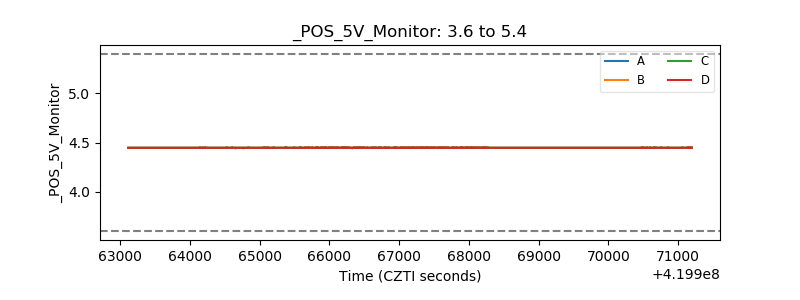 |
| _ROLL_ROT | 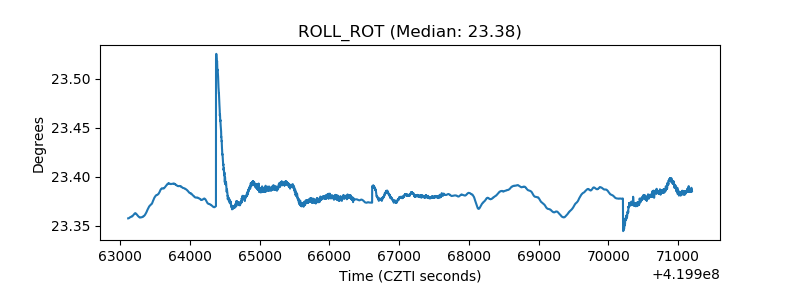 |
| _Roll_DEC | 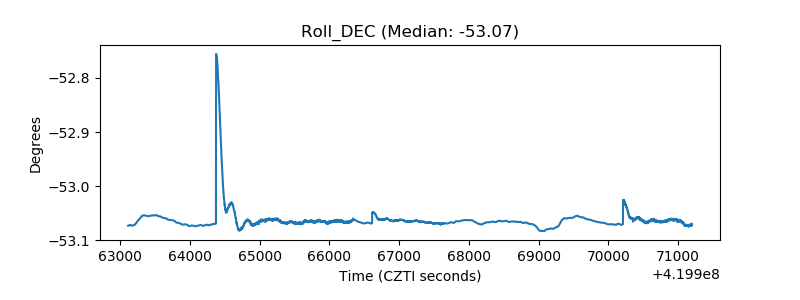 |
| _Roll_RA | 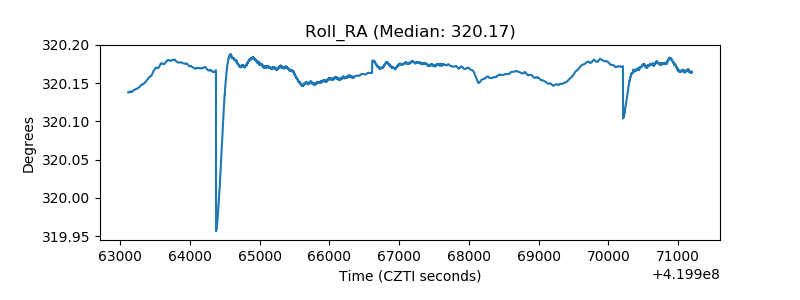 |
| Veto Counter | 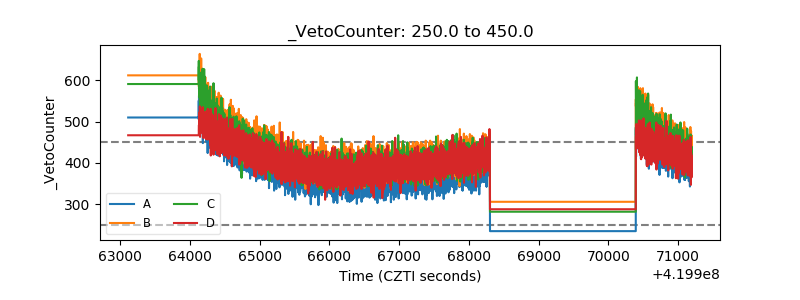 |