| Param | Original file | Final file |
|---|---|---|
| Filename | modeM0/AS1A12_052T04_9000005582_40926cztM0_level2.fits | modeM0/AS1A12_052T04_9000005582_40926cztM0_level2_quad_clean.evt |
| Size (bytes) | 590,788,800 | 67,763,520 |
| Size | 563.4 MB | 64.6 MB |
| Events in quadrant A | 2,615,391 | 587,157 |
| Events in quadrant B | 2,392,781 | 591,861 |
| Events in quadrant C | 13,328,280 | 16,814 |
| Events in quadrant D | 3,147,427 | 509,498 |
| Mode M9 | |||
|---|---|---|---|
| Quadrant | BADHDUFLAG | Total packets | Discarded packets |
| A | 0 | 33 | 0 |
| B | 0 | 33 | 0 |
| C | 0 | 33 | 0 |
| D | 0 | 34 | 0 |
| Mode SS | |||
|---|---|---|---|
| Quadrant | BADHDUFLAG | Total packets | Discarded packets |
| A | 0 | 100 | 0 |
| B | 0 | 100 | 0 |
| C | 0 | 100 | 0 |
| D | 0 | 100 | 0 |
| Mode M0 | |||
|---|---|---|---|
| Quadrant | BADHDUFLAG | Total packets | Discarded packets |
| A | 0 | 10731 | 3 |
| B | 0 | 10549 | 2 |
| C | 0 | 42853 | 2 |
| D | 0 | 12603 | 2 |
| Quadrant | Total seconds | Saturated seconds | Saturation percentage |
|---|---|---|---|
| A | 4945 | 10 | 0.202224% |
| B | 4945 | 43 | 0.869565% |
| C | 4945 | 4834 | 97.755308% |
| D | 4945 | 125 | 2.527806% |
Noise dominated data is calculated using 1-second bins in cleaned event files. If a bin has >2000 counts, and if more than 50% of those come from <1% of pixels, then it is considered to be noise-dominated and hence unusable.
| Quadrant | # 1 sec bins | Bins with >0 counts | Bins with >2000 counts | High rate bins dominated by noise | Noise dominated (total time) | Noise dominated (detector-on time) | Marked lightcurve |
|---|---|---|---|---|---|---|---|
| A | 7039 | 4946 | 4 | 4 | 0.06% | 0.08% | 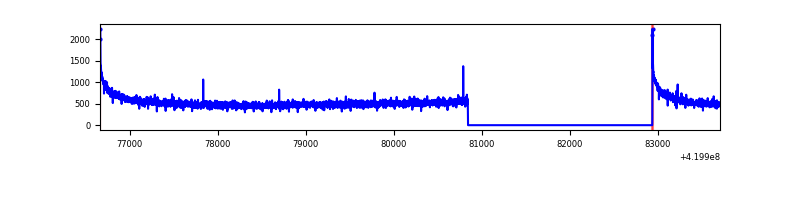 |
| B | 7039 | 4946 | 30 | 30 | 0.43% | 0.61% | 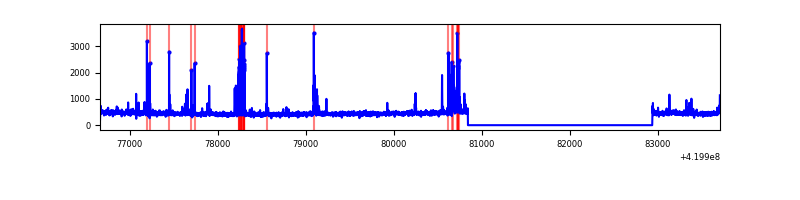 |
| C | 7038 | 4944 | 4620 | 4620 | 65.64% | 93.45% | 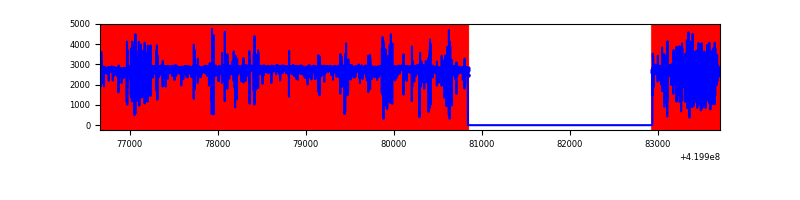 |
| D | 7039 | 4946 | 104 | 104 | 1.48% | 2.10% | 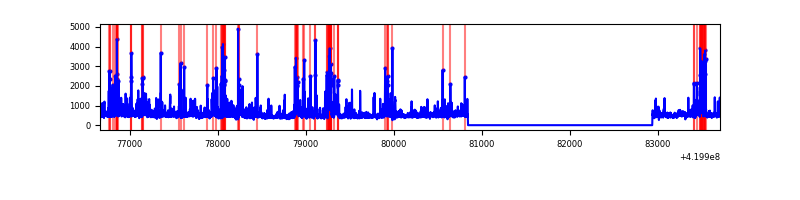 |
Top three noisy pixels from each quadrant. If the there are fewer than three noisy pixels in the level2.evt file, extra rows are filled as -1
| Pixel properties | Quadrant properties | ||||||
|---|---|---|---|---|---|---|---|
| Quadrant | DetID | PixID | Counts | Sigma | Mean | Median | Sigma |
| A | 10 | 83 | 468913 | 4188.12 | 551 | 541 | 111.8 |
| A | 13 | 254 | 6561 | 53.83 | 551 | 541 | 111.8 |
| A | 13 | 6 | 6250 | 51.05 | 551 | 541 | 111.8 |
| B | 5 | 255 | 232960 | 2216.33 | 548 | 533 | 104.9 |
| B | 12 | 111 | 12963 | 118.53 | 548 | 533 | 104.9 |
| B | 11 | 111 | 12288 | 112.09 | 548 | 533 | 104.9 |
| C | 0 | 239 | 12737049 | 415645.37 | 128 | 128 | 30.6 |
| C | 15 | 214 | 56666 | 1845.01 | 128 | 128 | 30.6 |
| C | 0 | 10 | 31752 | 1031.99 | 128 | 128 | 30.6 |
| D | 13 | 249 | 259359 | 1986.72 | 533 | 518 | 130.3 |
| D | 2 | 249 | 212578 | 1627.66 | 533 | 518 | 130.3 |
| D | 12 | 233 | 144272 | 1103.38 | 533 | 518 | 130.3 |
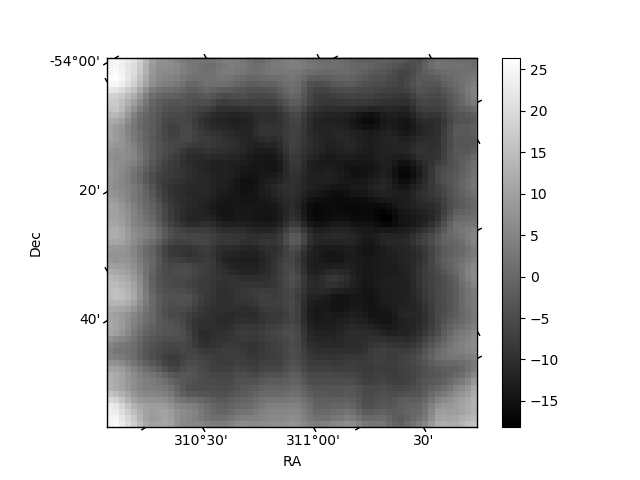
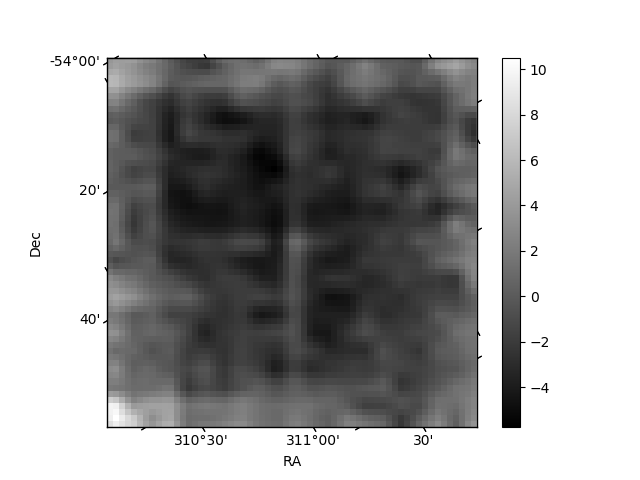
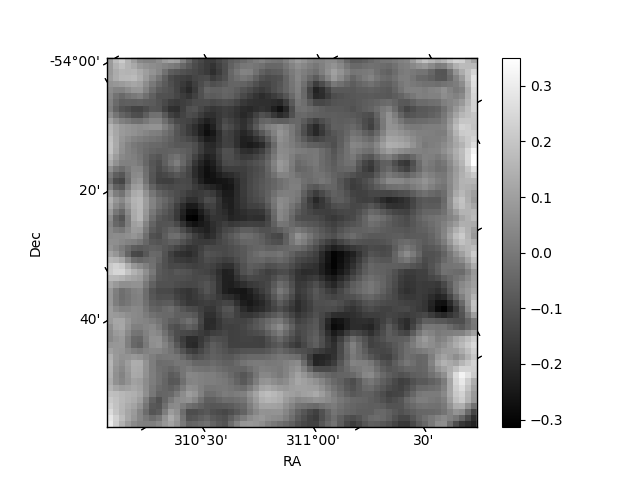
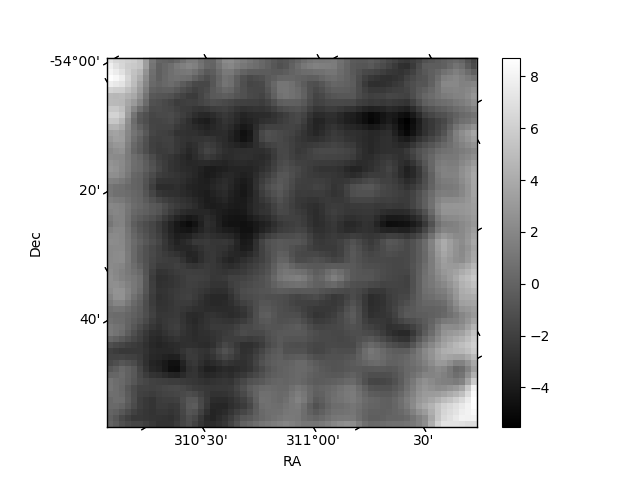
Histogram calculated using DETX and DETY for each event in the final _common_clean file
| Quadrant A | 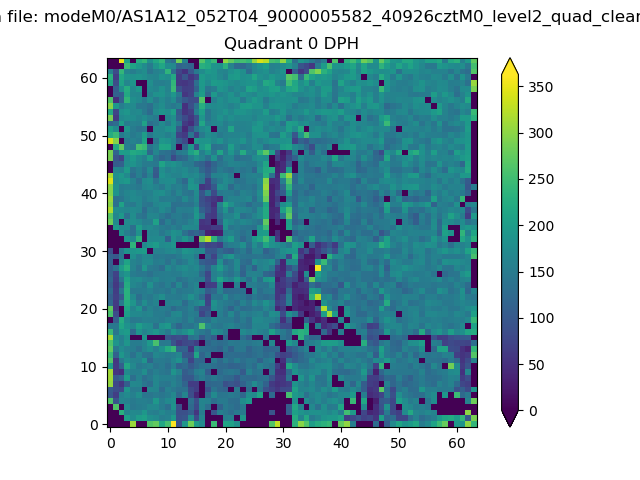 |
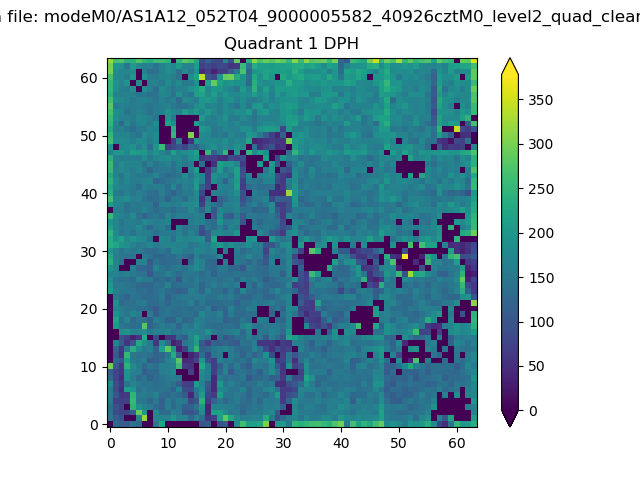 |
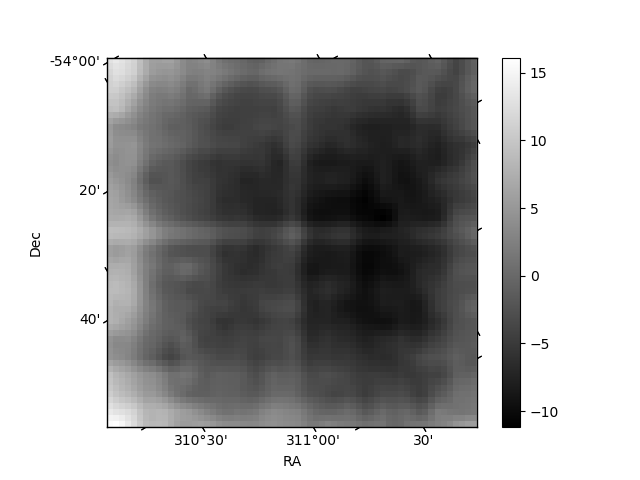
Quadrant B |
|---|---|---|---|
| Quadrant D | 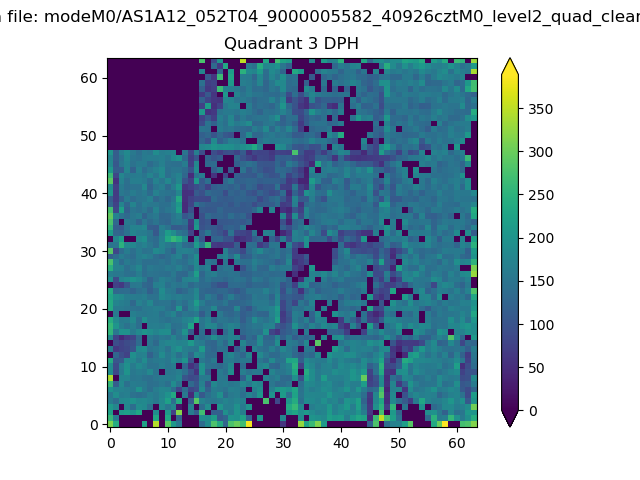 |
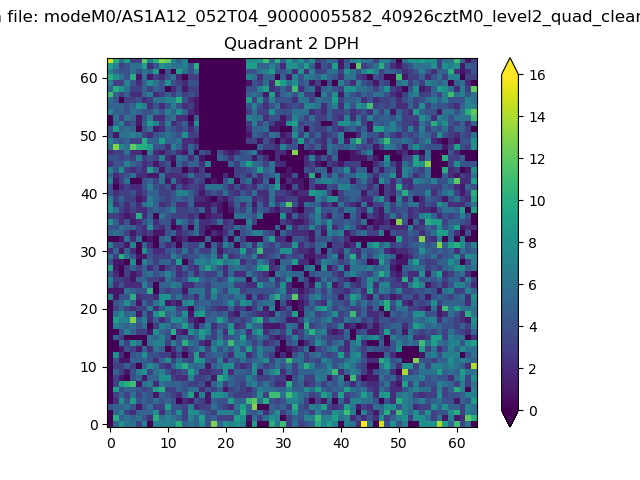 |
Quadrant C |
| Plot type | Count rate plots | Images |
|---|---|---|
| Comparison with Poisson distribution Blue bars denote a histogram of data divided into 1 sec bins. Red curve is a Poisson curve with rate = median count rate of data. |
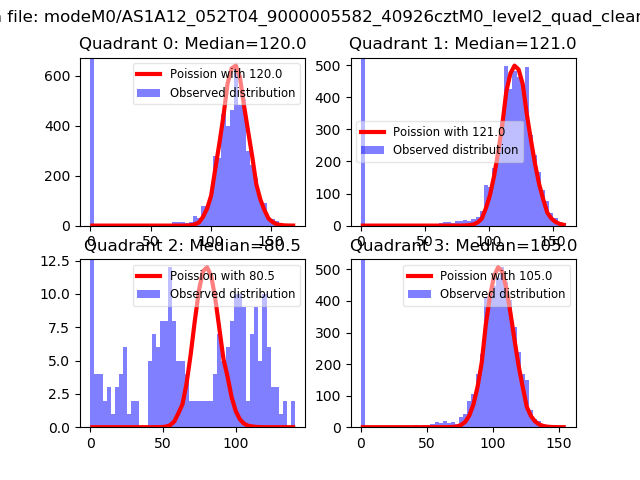 |
 |
| Quadrant-wise count rates Data is divided into 100 sec bins |
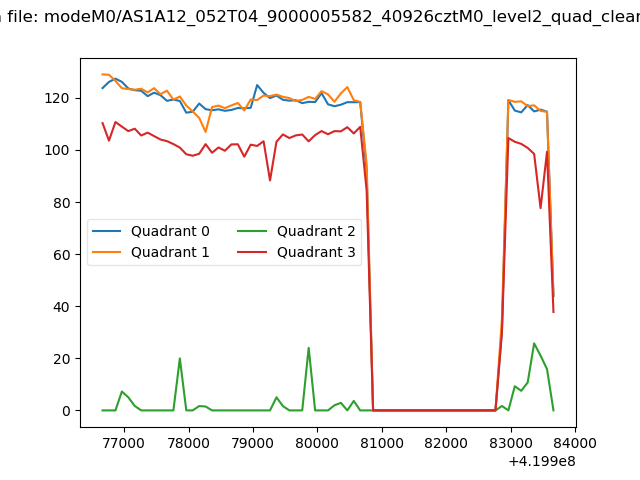 |
|
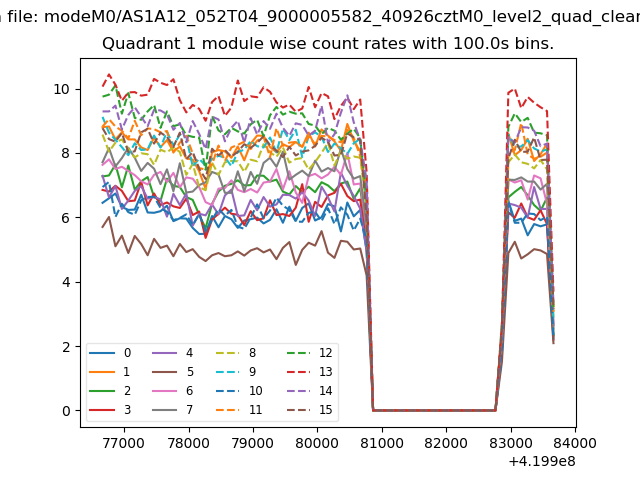
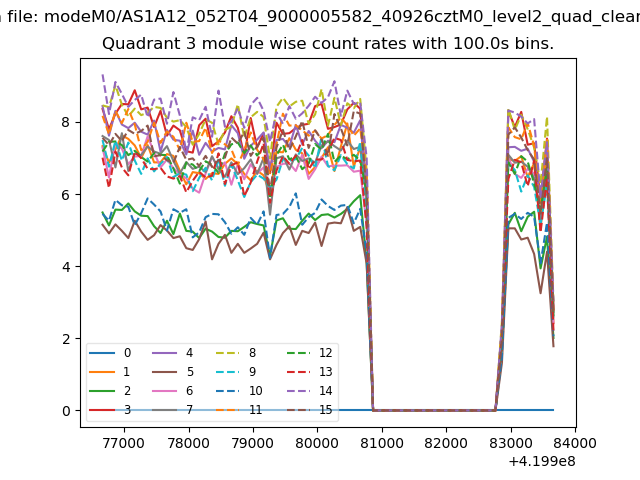
| Module-wise count rates for Quadrant A Data is divided into 100 sec bins |
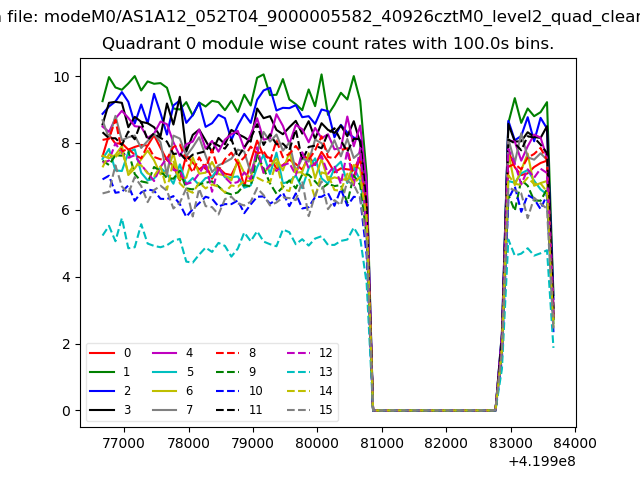 |
 |
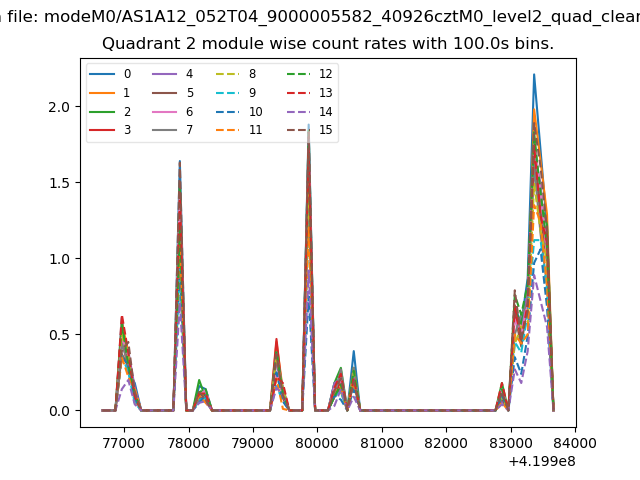
| Module-wise count rates for Quadrant B Data is divided into 100 sec bins |
 |
 |
| Module-wise count rates for Quadrant C Data is divided into 100 sec bins |
 |
 |
| Module-wise count rates for Quadrant D Data is divided into 100 sec bins |
 |
 |
| Parameter | Plot |
|---|---|
| CZT HV Monitor | 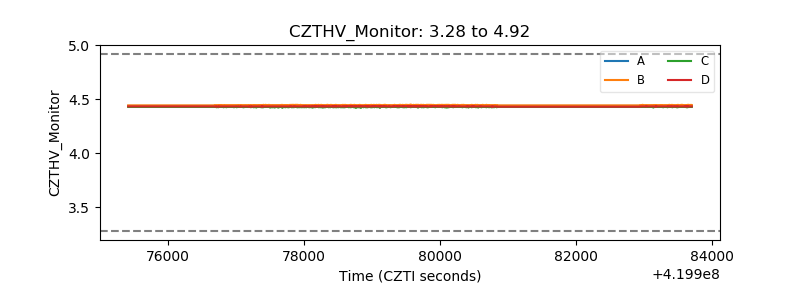 |
| D_VDD | 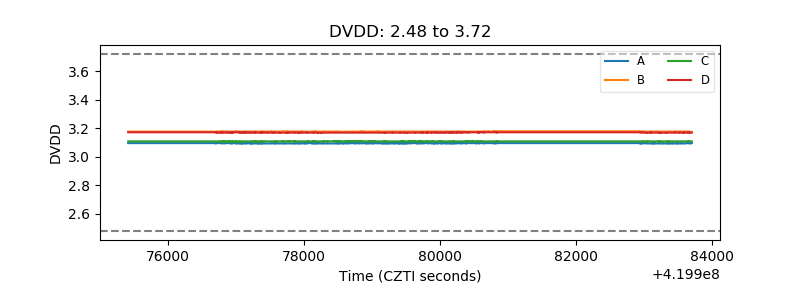 |
| Temperature 1 | 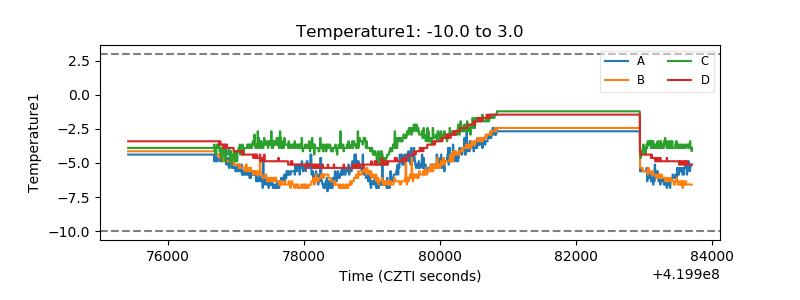 |
| Veto HV Monitor |  |
| Veto LLD | 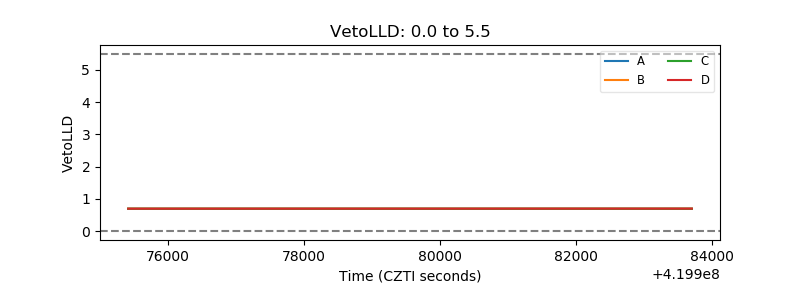 |
| Alpha Counter | 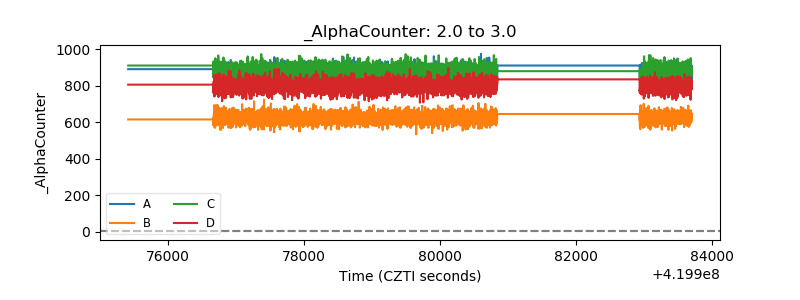 |
| _CPM_Rate |  |
| CZT Counter | 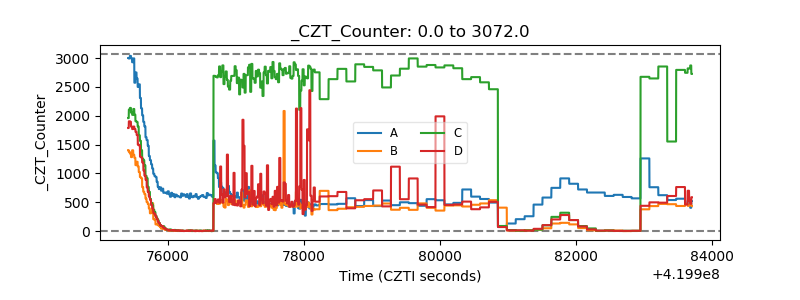 |
| +2.5 Volts monitor | 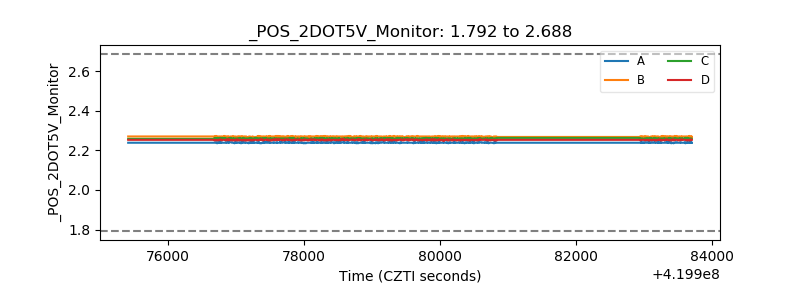 |
| +5 Volts monitor | 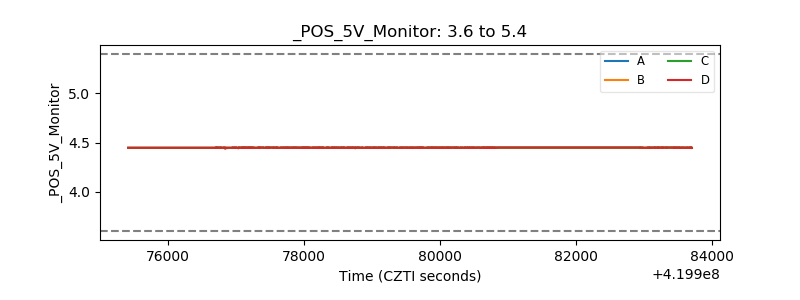 |
| _ROLL_ROT | 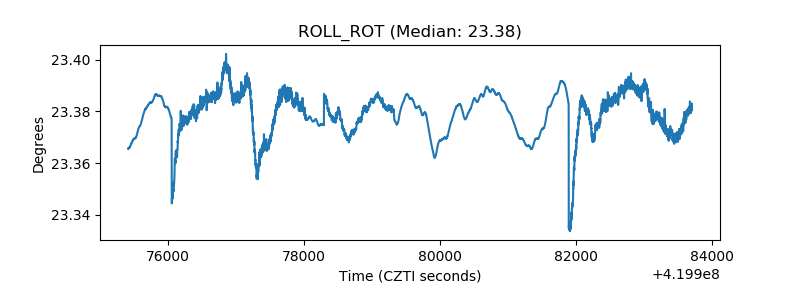 |
| _Roll_DEC | 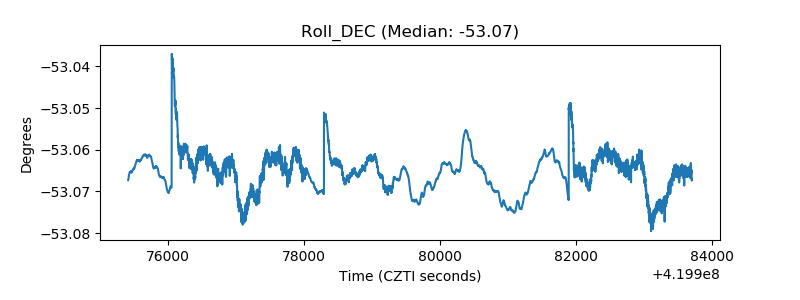 |
| _Roll_RA | 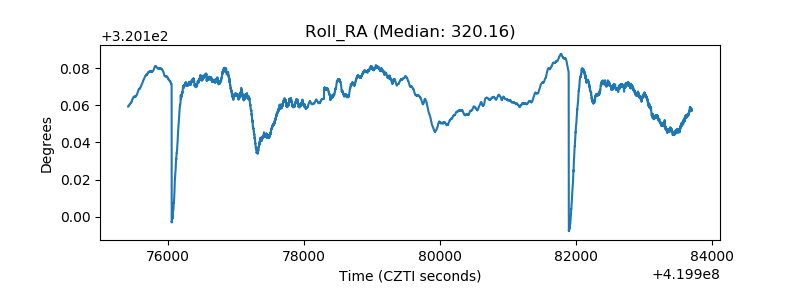 |
| Veto Counter | 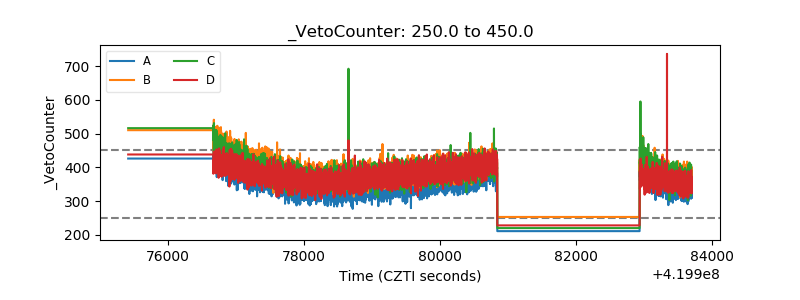 |