| Param | Original file | Final file |
|---|---|---|
| Filename | modeM0/AS1A12_052T04_9000005582_40927cztM0_level2.fits | modeM0/AS1A12_052T04_9000005582_40927cztM0_level2_quad_clean.evt |
| Size (bytes) | 559,445,760 | 78,108,480 |
| Size | 533.5 MB | 74.5 MB |
| Events in quadrant A | 2,739,873 | 624,125 |
| Events in quadrant B | 2,378,959 | 620,546 |
| Events in quadrant C | 11,357,696 | 227,137 |
| Events in quadrant D | 3,823,382 | 524,917 |
| Mode M9 | |||
|---|---|---|---|
| Quadrant | BADHDUFLAG | Total packets | Discarded packets |
| A | 0 | 26 | 0 |
| B | 0 | 26 | 0 |
| C | 0 | 26 | 0 |
| D | 0 | 27 | 0 |
| Mode SS | |||
|---|---|---|---|
| Quadrant | BADHDUFLAG | Total packets | Discarded packets |
| A | 0 | 108 | 0 |
| B | 0 | 108 | 0 |
| C | 0 | 108 | 0 |
| D | 0 | 108 | 0 |
| Mode M0 | |||
|---|---|---|---|
| Quadrant | BADHDUFLAG | Total packets | Discarded packets |
| A | 0 | 11379 | 3 |
| B | 0 | 10910 | 2 |
| C | 0 | 37255 | 2 |
| D | 0 | 14833 | 2 |
| Quadrant | Total seconds | Saturated seconds | Saturation percentage |
|---|---|---|---|
| A | 5259 | 10 | 0.190150% |
| B | 5259 | 28 | 0.532421% |
| C | 5259 | 3476 | 66.096216% |
| D | 5259 | 258 | 4.905876% |
Noise dominated data is calculated using 1-second bins in cleaned event files. If a bin has >2000 counts, and if more than 50% of those come from <1% of pixels, then it is considered to be noise-dominated and hence unusable.
| Quadrant | # 1 sec bins | Bins with >0 counts | Bins with >2000 counts | High rate bins dominated by noise | Noise dominated (total time) | Noise dominated (detector-on time) | Marked lightcurve |
|---|---|---|---|---|---|---|---|
| A | 7112 | 5260 | 3 | 3 | 0.04% | 0.06% | 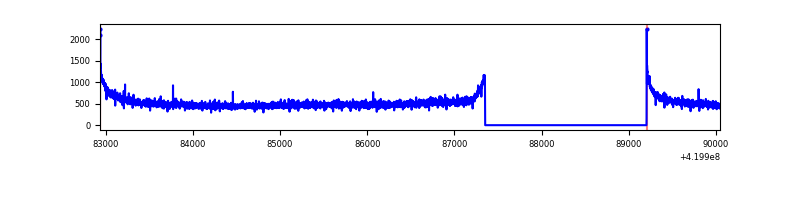 |
| B | 7112 | 5260 | 17 | 17 | 0.24% | 0.32% | 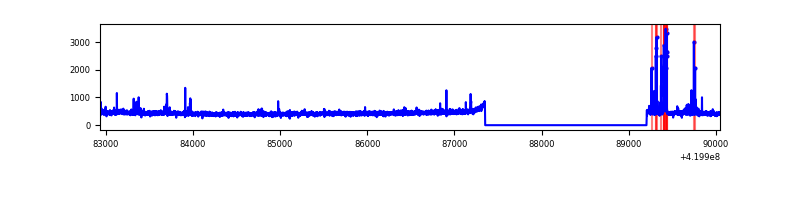 |
| C | 7111 | 5259 | 3171 | 3171 | 44.59% | 60.30% | 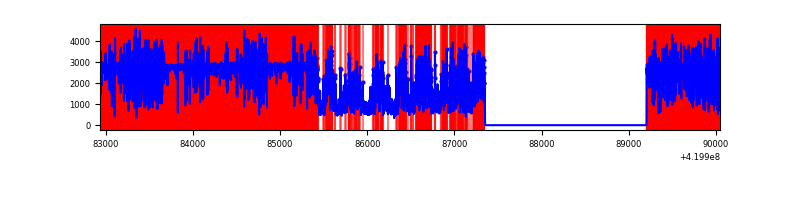 |
| D | 7112 | 5260 | 217 | 217 | 3.05% | 4.13% | 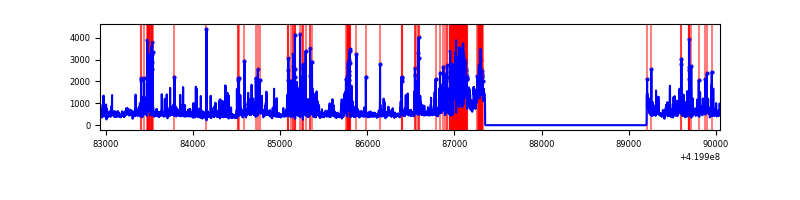 |
Top three noisy pixels from each quadrant. If the there are fewer than three noisy pixels in the level2.evt file, extra rows are filled as -1
| Pixel properties | Quadrant properties | ||||||
|---|---|---|---|---|---|---|---|
| Quadrant | DetID | PixID | Counts | Sigma | Mean | Median | Sigma |
| A | 10 | 83 | 487313 | 4069.61 | 580 | 569 | 119.6 |
| A | 13 | 254 | 7389 | 57.02 | 580 | 569 | 119.6 |
| A | 3 | 137 | 6415 | 48.88 | 580 | 569 | 119.6 |
| B | 5 | 255 | 127549 | 1125.13 | 572 | 554 | 112.9 |
| B | 12 | 111 | 13721 | 116.65 | 572 | 554 | 112.9 |
| B | 11 | 111 | 12655 | 107.21 | 572 | 554 | 112.9 |
| C | 0 | 239 | 9788501 | 120096.4 | 350 | 352 | 81.5 |
| C | 15 | 214 | 141116 | 1727.11 | 350 | 352 | 81.5 |
| C | 0 | 10 | 57582 | 702.19 | 350 | 352 | 81.5 |
| D | 1 | 47 | 505698 | 3683.35 | 556 | 539 | 137.1 |
| D | 12 | 233 | 347436 | 2529.38 | 556 | 539 | 137.1 |
| D | 12 | 79 | 271291 | 1974.18 | 556 | 539 | 137.1 |
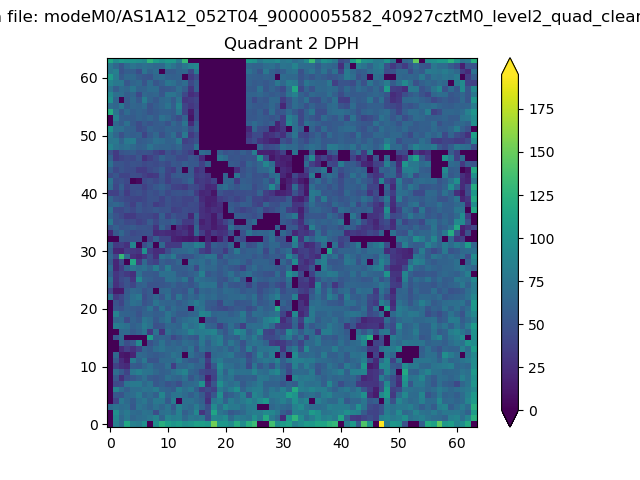
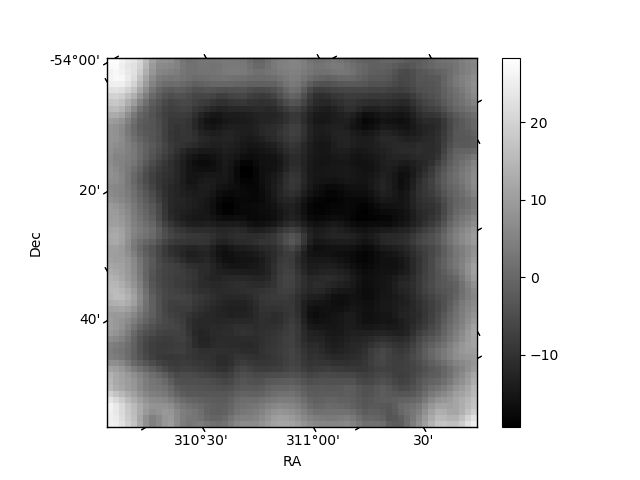
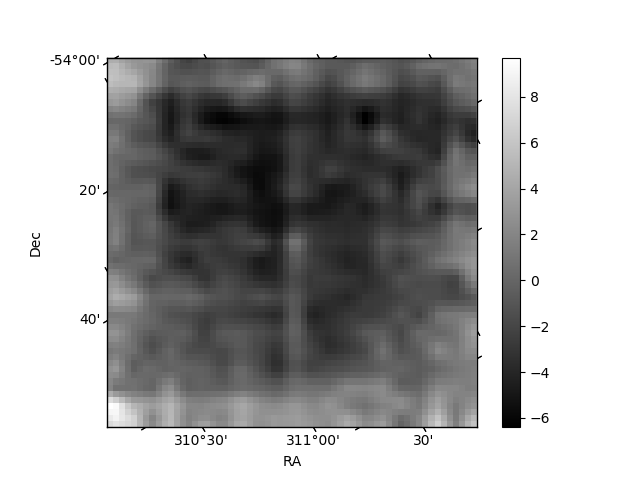
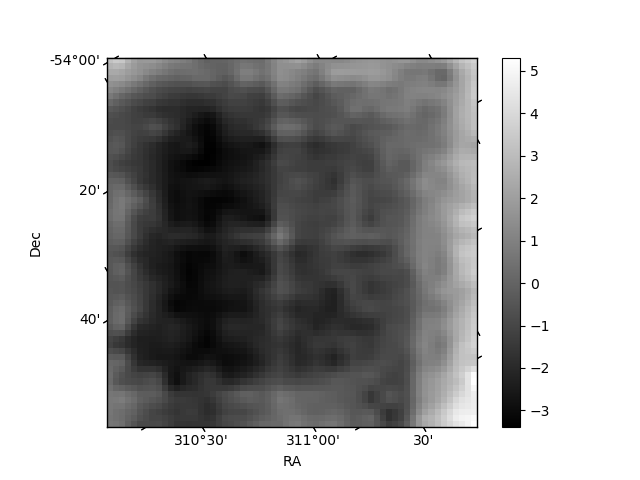
Histogram calculated using DETX and DETY for each event in the final _common_clean file
| Quadrant A | 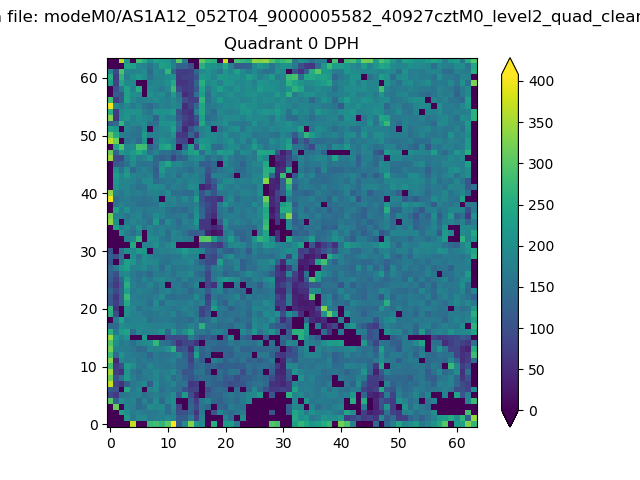 |
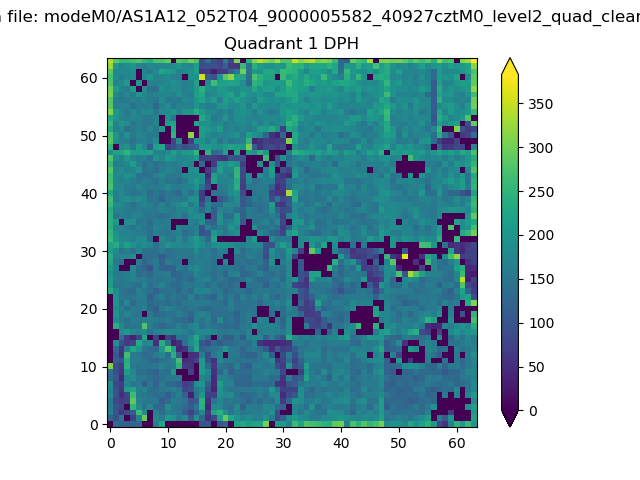 |
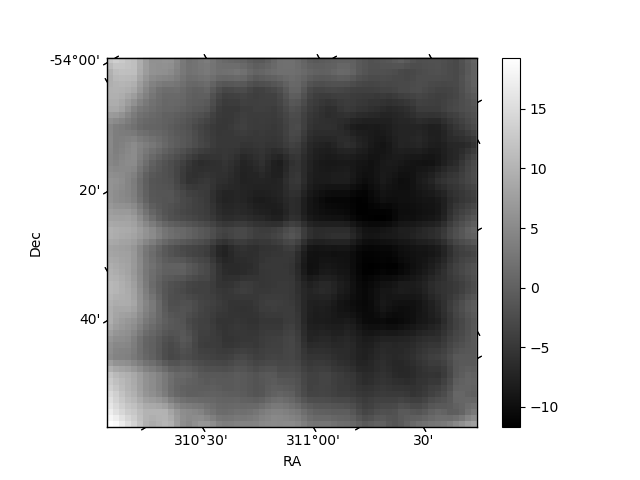
Quadrant B |
|---|---|---|---|
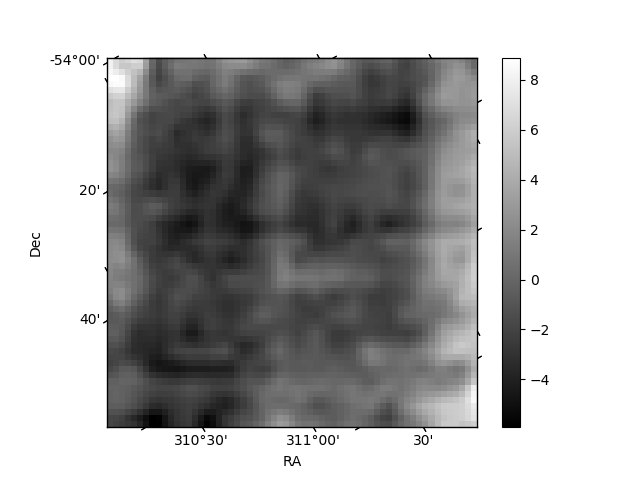
| Quadrant D | 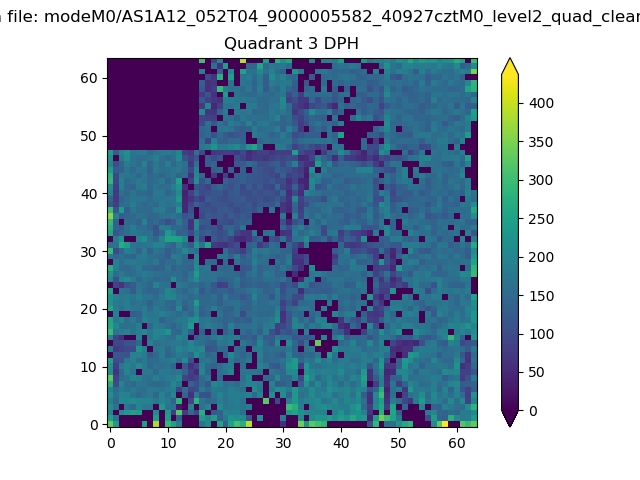 |
 |
Quadrant C |
| Plot type | Count rate plots | Images |
|---|---|---|
| Comparison with Poisson distribution Blue bars denote a histogram of data divided into 1 sec bins. Red curve is a Poisson curve with rate = median count rate of data. |
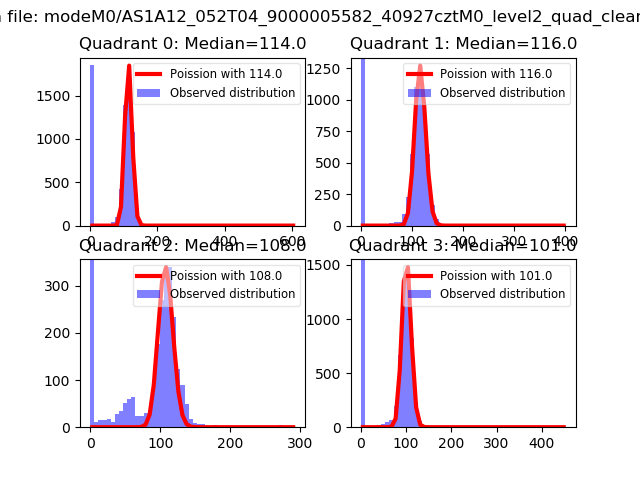 |
 |
| Quadrant-wise count rates Data is divided into 100 sec bins |
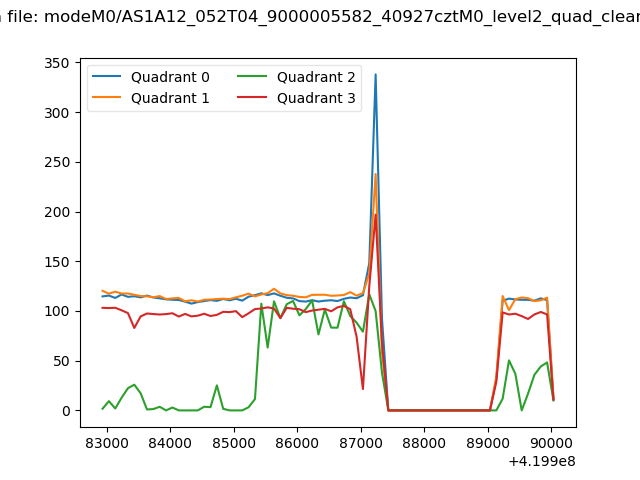 |
|
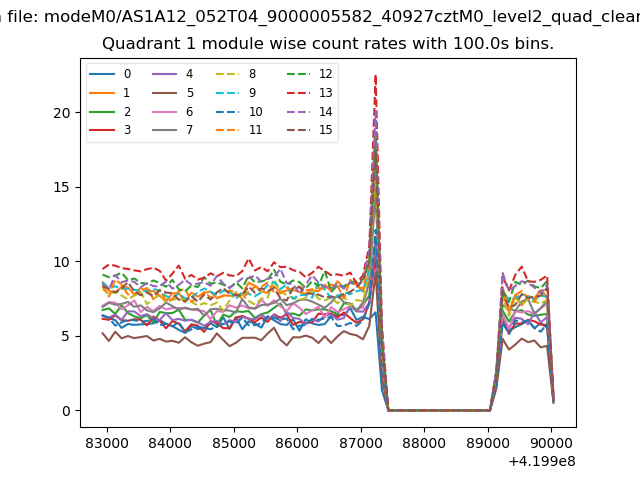
| Module-wise count rates for Quadrant A Data is divided into 100 sec bins |
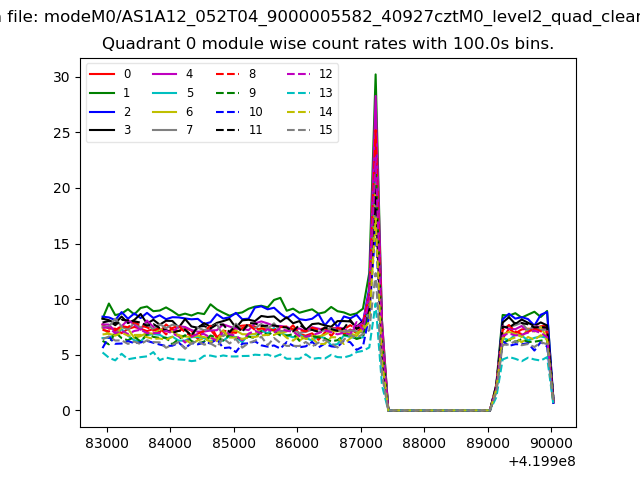 |
 |
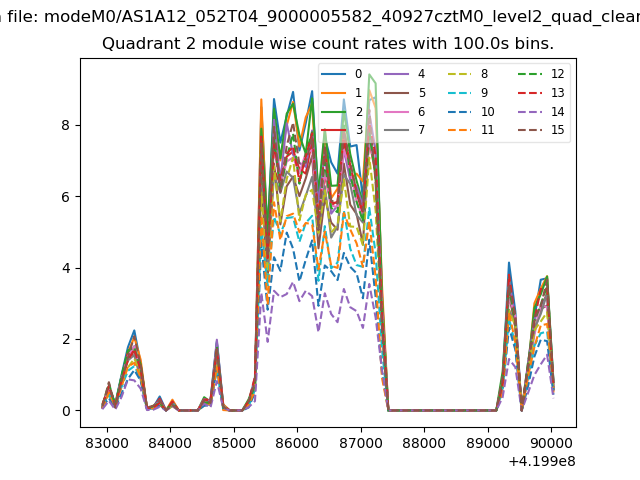
| Module-wise count rates for Quadrant B Data is divided into 100 sec bins |
 |
 |
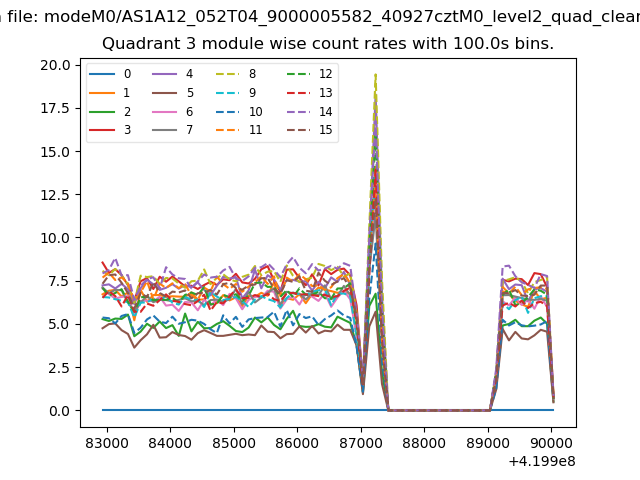
| Module-wise count rates for Quadrant C Data is divided into 100 sec bins |
 |
 |
| Module-wise count rates for Quadrant D Data is divided into 100 sec bins |
 |
 |
| Parameter | Plot |
|---|---|
| CZT HV Monitor | 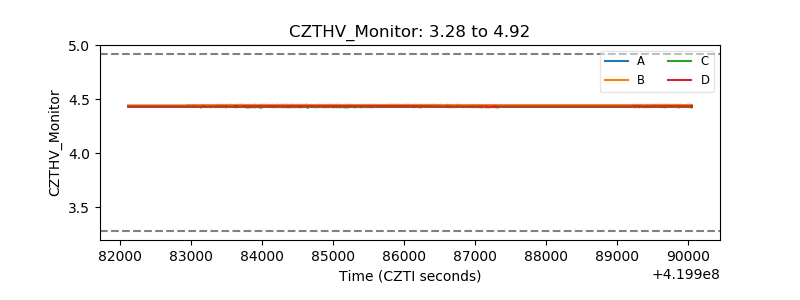 |
| D_VDD | 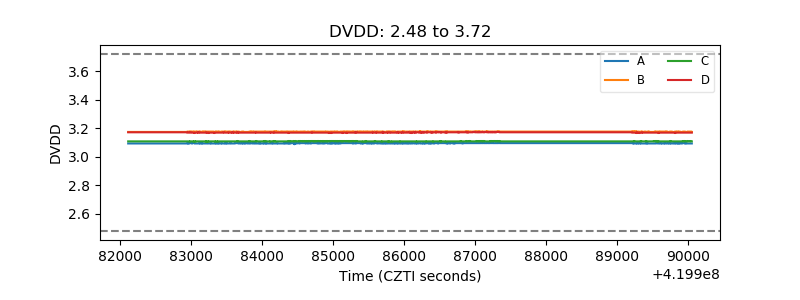 |
| Temperature 1 | 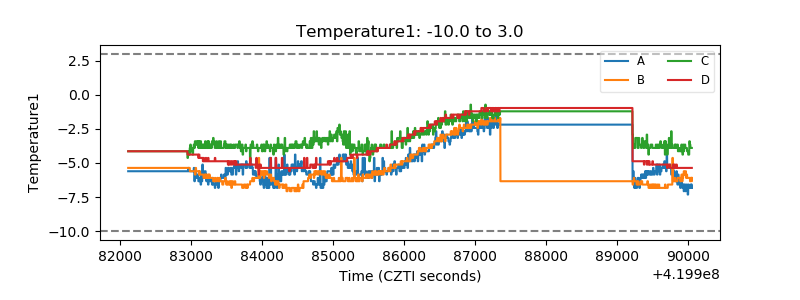 |
| Veto HV Monitor | 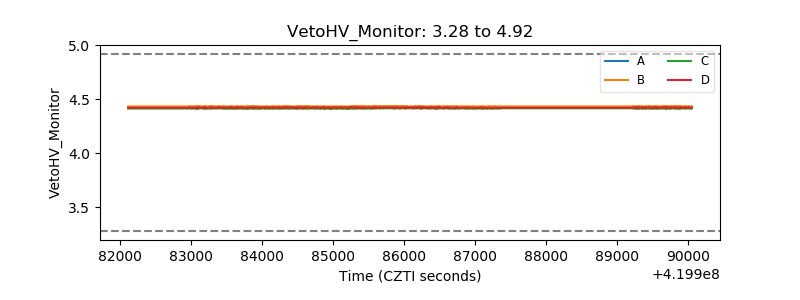 |
| Veto LLD | 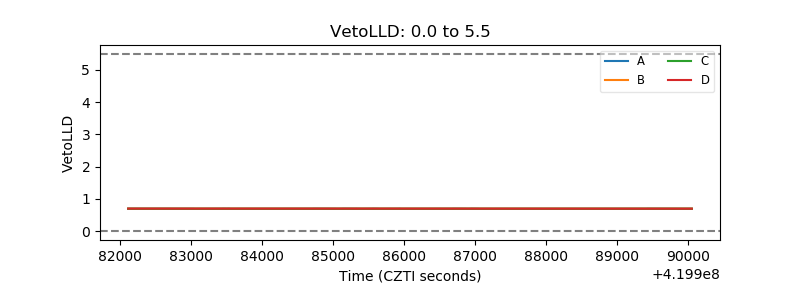 |
| Alpha Counter |  |
| _CPM_Rate | 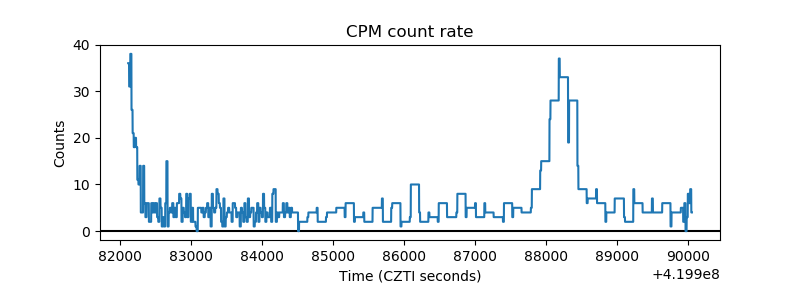 |
| CZT Counter | 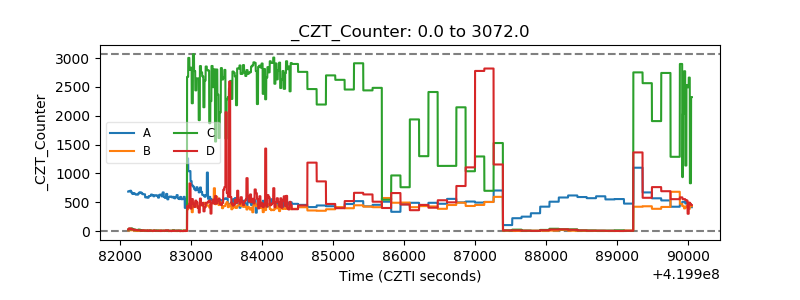 |
| +2.5 Volts monitor |  |
| +5 Volts monitor | 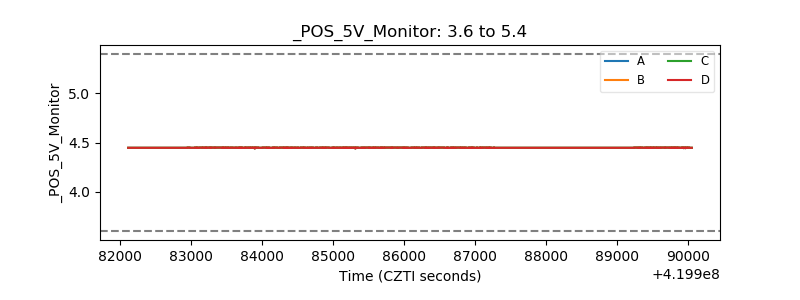 |
| _ROLL_ROT | 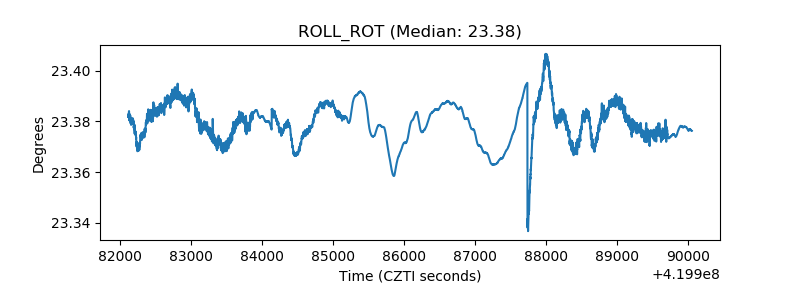 |
| _Roll_DEC | 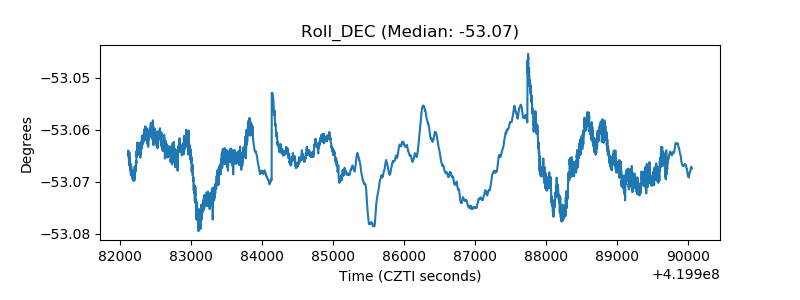 |
| _Roll_RA | 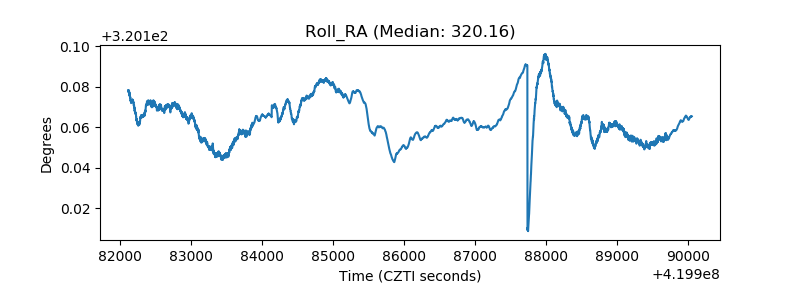 |
| Veto Counter | 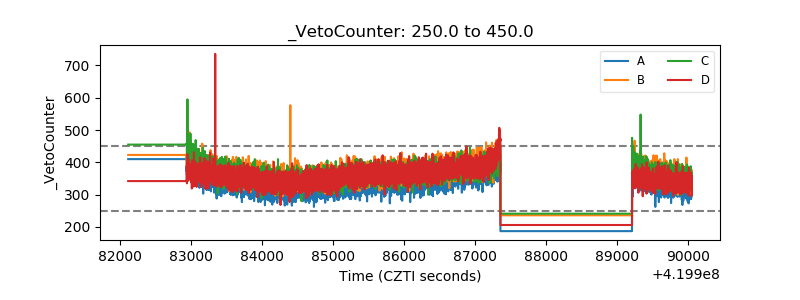 |