| Param | Original file | Final file |
|---|---|---|
| Filename | modeM0/AS1A12_052T04_9000005582_40928cztM0_level2.fits | modeM0/AS1A12_052T04_9000005582_40928cztM0_level2_quad_clean.evt |
| Size (bytes) | 607,910,400 | 80,015,040 |
| Size | 579.7 MB | 76.3 MB |
| Events in quadrant A | 2,908,871 | 642,804 |
| Events in quadrant B | 2,691,552 | 640,168 |
| Events in quadrant C | 12,731,832 | 186,158 |
| Events in quadrant D | 3,732,958 | 559,381 |
| Mode M9 | |||
|---|---|---|---|
| Quadrant | BADHDUFLAG | Total packets | Discarded packets |
| A | 0 | 30 | 0 |
| B | 0 | 30 | 0 |
| C | 0 | 30 | 0 |
| D | 0 | 31 | 0 |
| Mode SS | |||
|---|---|---|---|
| Quadrant | BADHDUFLAG | Total packets | Discarded packets |
| A | 0 | 116 | 0 |
| B | 0 | 116 | 0 |
| C | 0 | 116 | 0 |
| D | 0 | 116 | 0 |
| Mode M0 | |||
|---|---|---|---|
| Quadrant | BADHDUFLAG | Total packets | Discarded packets |
| A | 0 | 12239 | 3 |
| B | 0 | 12093 | 2 |
| C | 0 | 41626 | 2 |
| D | 0 | 14951 | 2 |
| Quadrant | Total seconds | Saturated seconds | Saturation percentage |
|---|---|---|---|
| A | 5629 | 13 | 0.230947% |
| B | 5629 | 61 | 1.083674% |
| C | 5629 | 4091 | 72.677207% |
| D | 5629 | 168 | 2.984544% |
Noise dominated data is calculated using 1-second bins in cleaned event files. If a bin has >2000 counts, and if more than 50% of those come from <1% of pixels, then it is considered to be noise-dominated and hence unusable.
| Quadrant | # 1 sec bins | Bins with >0 counts | Bins with >2000 counts | High rate bins dominated by noise | Noise dominated (total time) | Noise dominated (detector-on time) | Marked lightcurve |
|---|---|---|---|---|---|---|---|
| A | 7151 | 5630 | 4 | 4 | 0.06% | 0.07% | 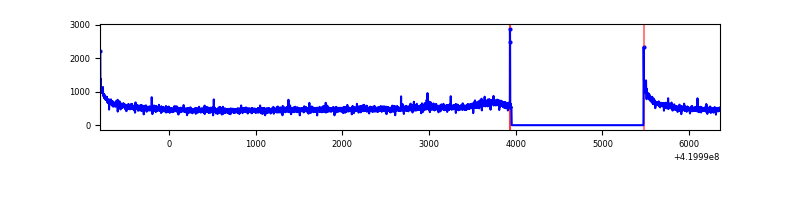 |
| B | 7151 | 5630 | 38 | 38 | 0.53% | 0.67% | 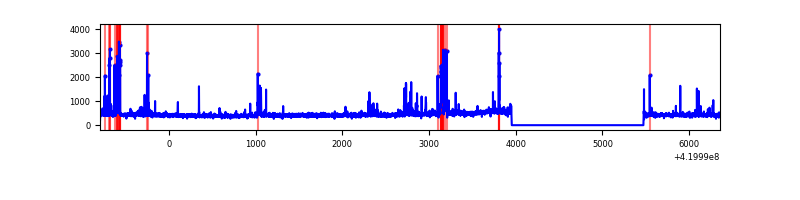 |
| C | 7150 | 5629 | 3691 | 3691 | 51.62% | 65.57% | 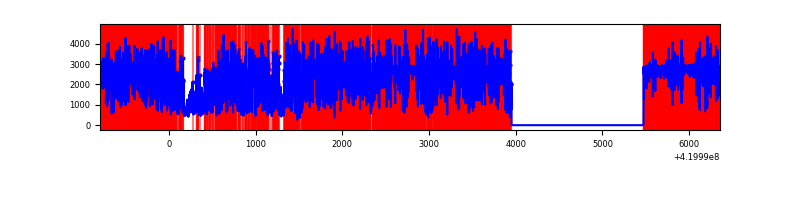 |
| D | 7151 | 5630 | 145 | 145 | 2.03% | 2.58% | 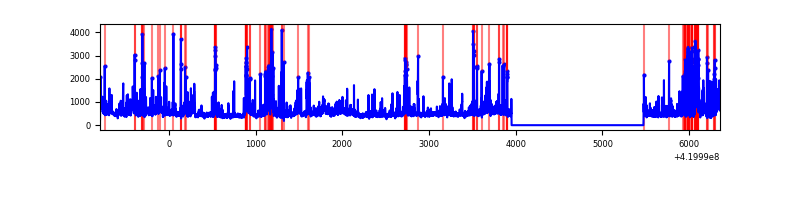 |
Top three noisy pixels from each quadrant. If the there are fewer than three noisy pixels in the level2.evt file, extra rows are filled as -1
| Pixel properties | Quadrant properties | ||||||
|---|---|---|---|---|---|---|---|
| Quadrant | DetID | PixID | Counts | Sigma | Mean | Median | Sigma |
| A | 10 | 83 | 516133 | 4130.15 | 615 | 605 | 124.8 |
| A | 13 | 254 | 8129 | 60.28 | 615 | 605 | 124.8 |
| A | 13 | 248 | 6780 | 49.47 | 615 | 605 | 124.8 |
| B | 5 | 255 | 273406 | 2312.64 | 605 | 589 | 118.0 |
| B | 0 | 186 | 19292 | 158.54 | 605 | 589 | 118.0 |
| B | 12 | 111 | 14603 | 118.79 | 605 | 589 | 118.0 |
| C | 0 | 239 | 11154140 | 135442.25 | 349 | 351 | 82.4 |
| C | 15 | 214 | 146967 | 1780.38 | 349 | 351 | 82.4 |
| C | 0 | 10 | 66624 | 804.76 | 349 | 351 | 82.4 |
| D | 12 | 233 | 358658 | 2444.92 | 595 | 577 | 146.5 |
| D | 13 | 249 | 345127 | 2352.53 | 595 | 577 | 146.5 |
| D | 1 | 47 | 229929 | 1565.98 | 595 | 577 | 146.5 |
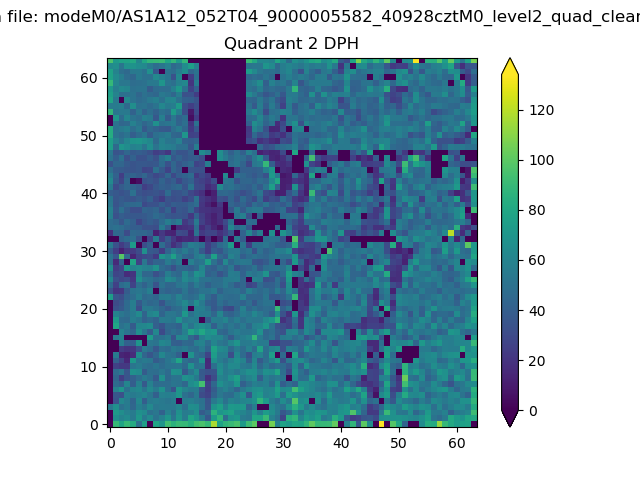
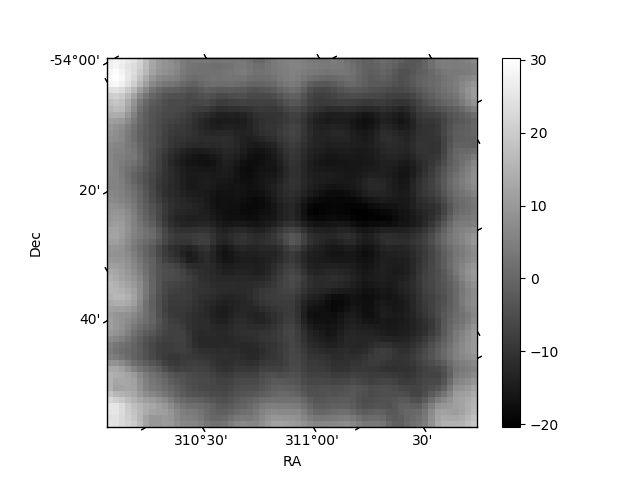
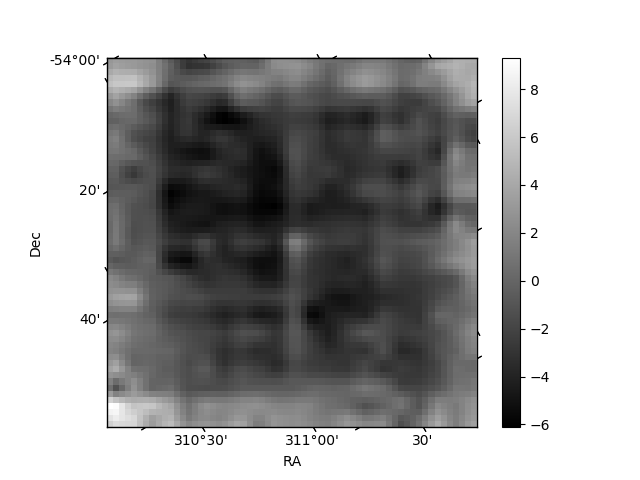
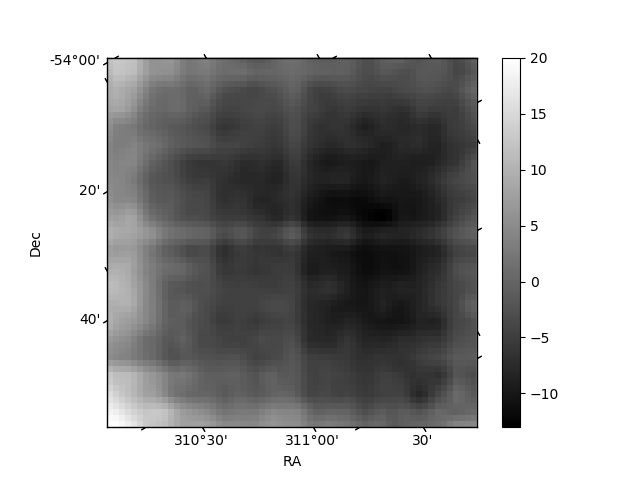
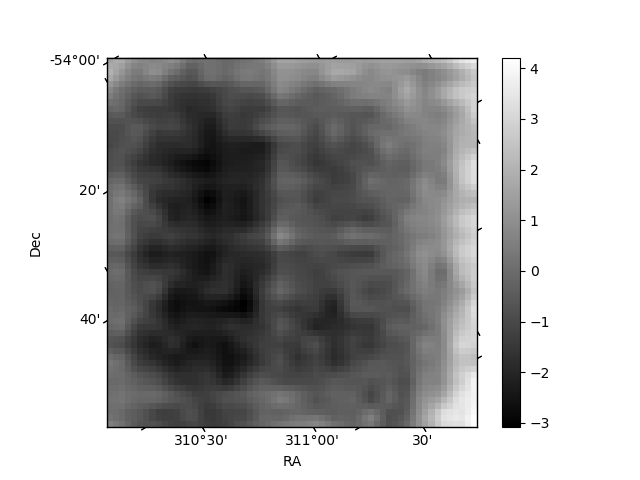
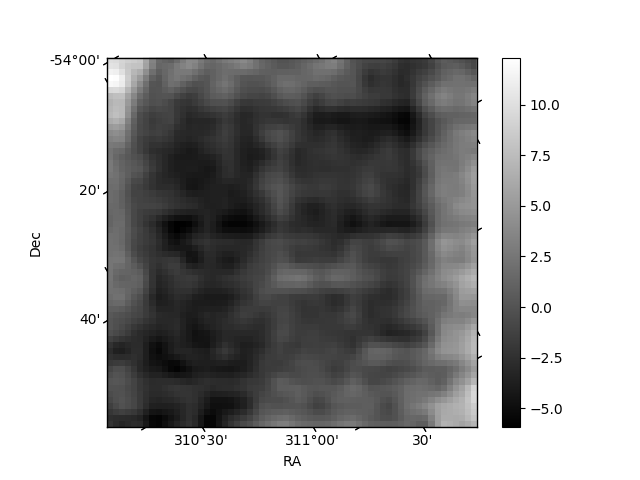
Histogram calculated using DETX and DETY for each event in the final _common_clean file
| Quadrant A | 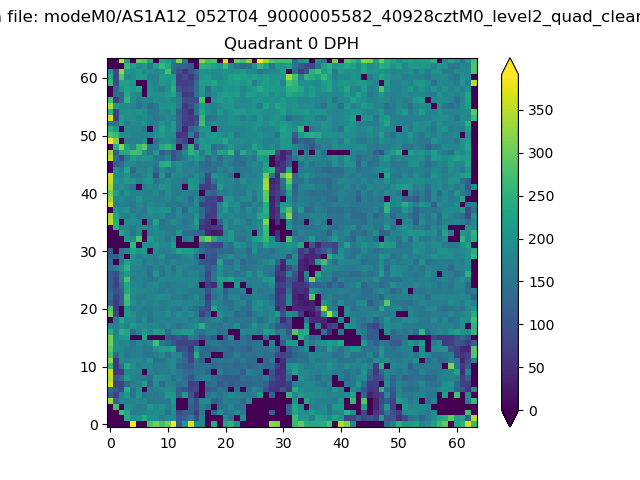 |
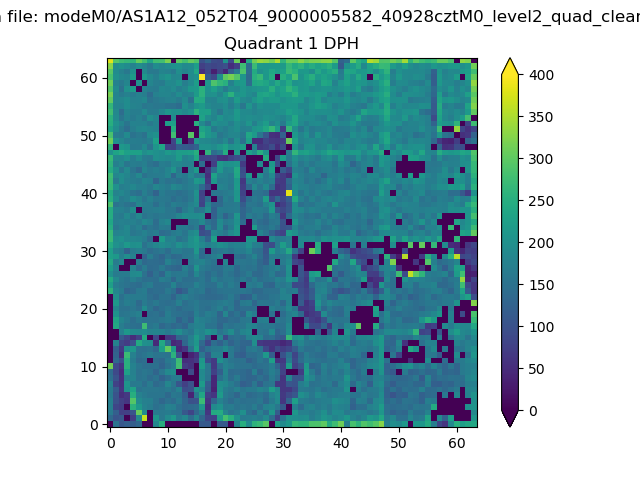 |
Quadrant B |
|---|---|---|---|
| Quadrant D | 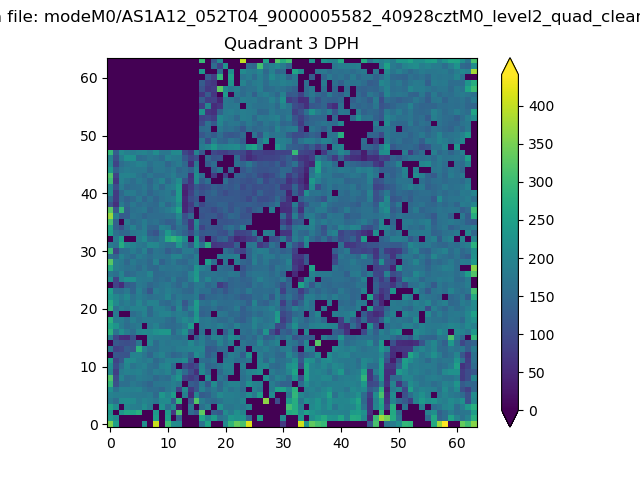 |
 |
Quadrant C |
| Plot type | Count rate plots | Images |
|---|---|---|
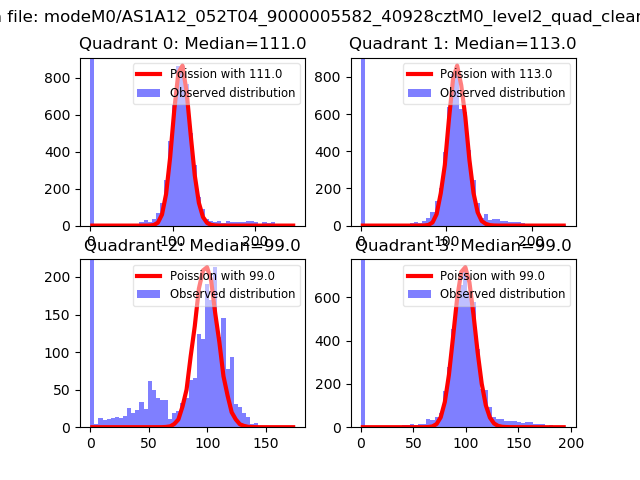
| Comparison with Poisson distribution Blue bars denote a histogram of data divided into 1 sec bins. Red curve is a Poisson curve with rate = median count rate of data. |
 |
 |
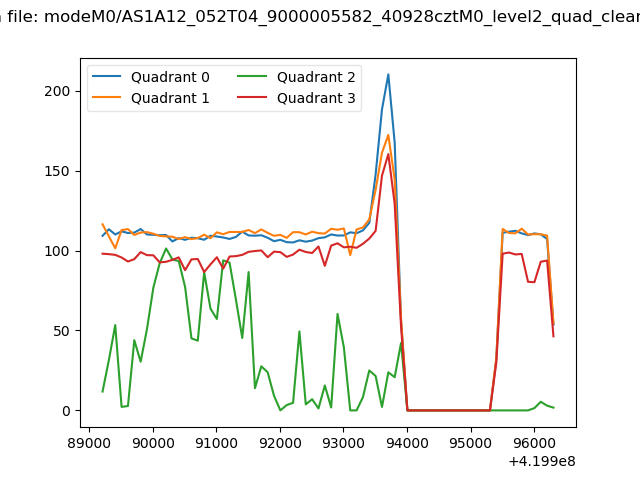
| Quadrant-wise count rates Data is divided into 100 sec bins |
 |
|
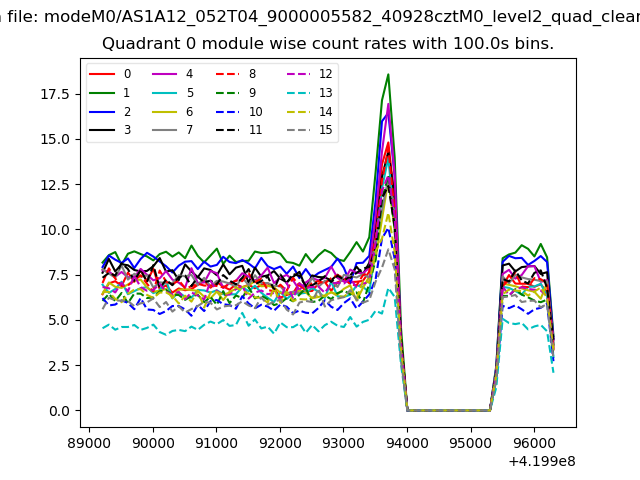
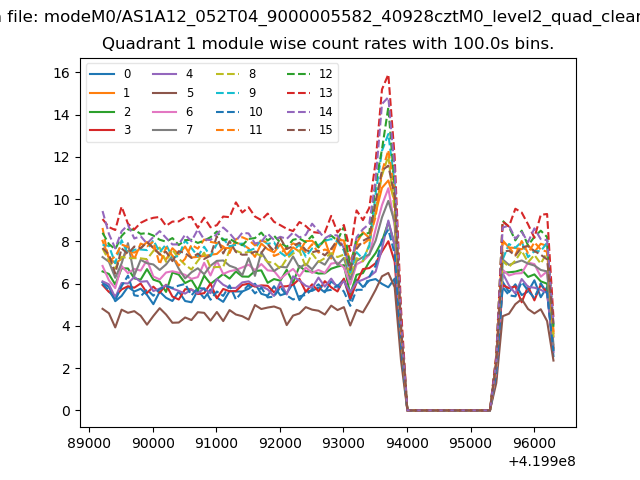
| Module-wise count rates for Quadrant A Data is divided into 100 sec bins |
 |
 |
| Module-wise count rates for Quadrant B Data is divided into 100 sec bins |
 |
 |
| Module-wise count rates for Quadrant C Data is divided into 100 sec bins |
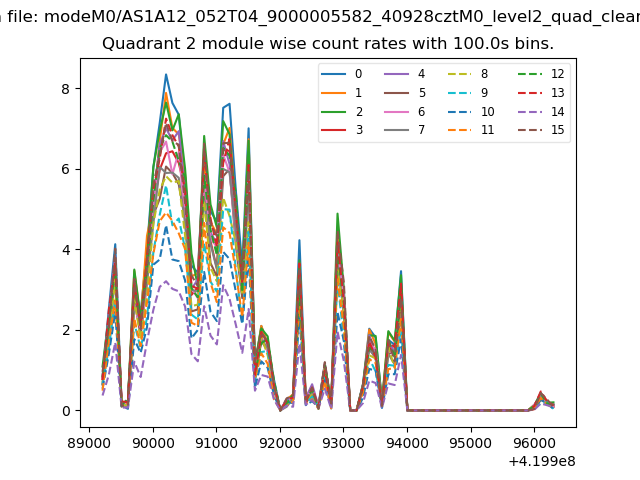 |
 |
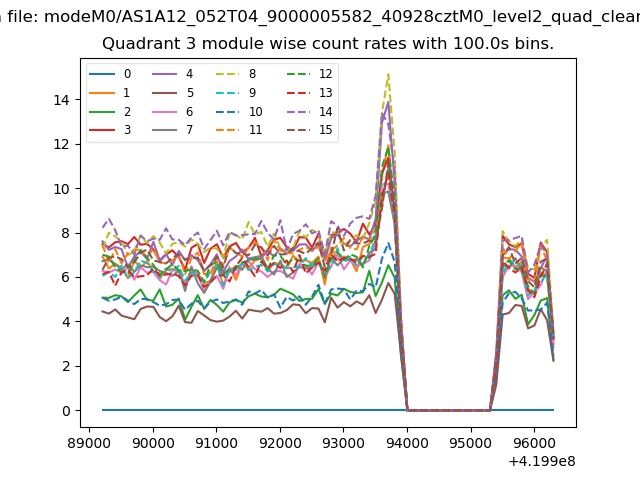
| Module-wise count rates for Quadrant D Data is divided into 100 sec bins |
 |
 |
| Parameter | Plot |
|---|---|
| CZT HV Monitor | 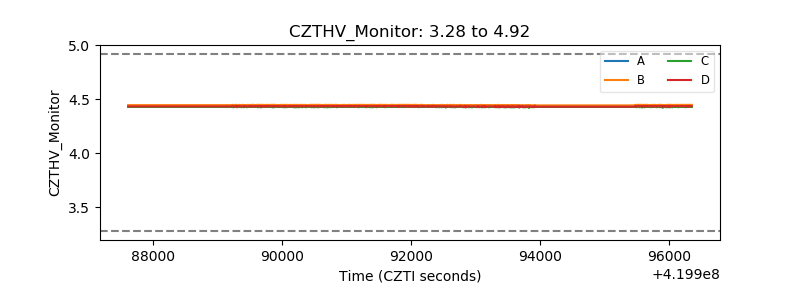 |
| D_VDD | 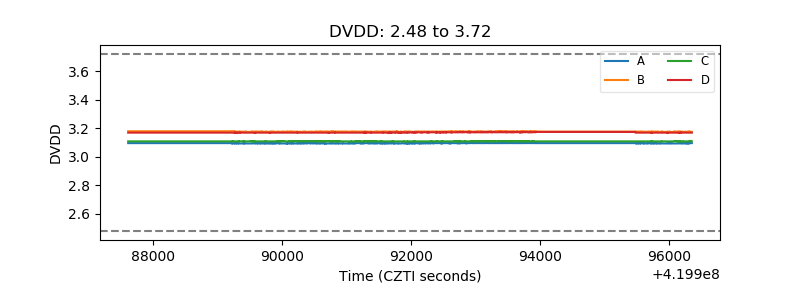 |
| Temperature 1 | 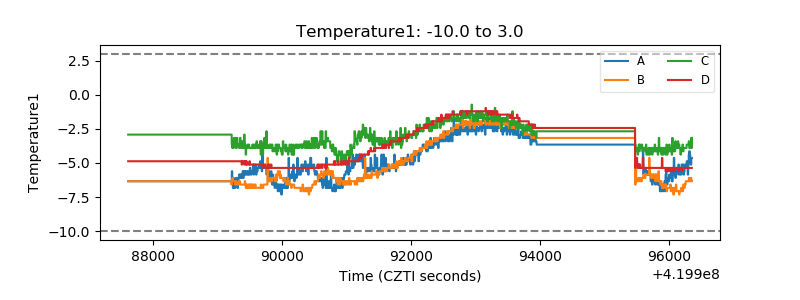 |
| Veto HV Monitor |  |
| Veto LLD | 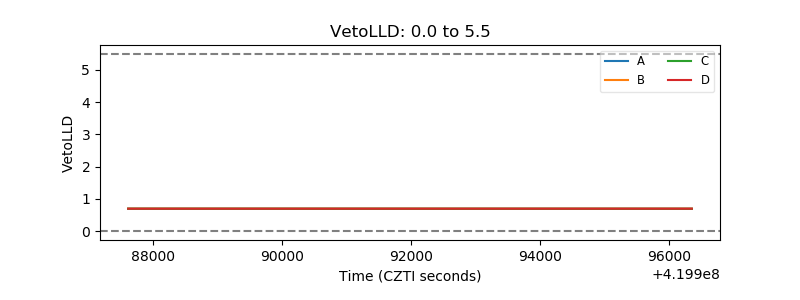 |
| Alpha Counter | 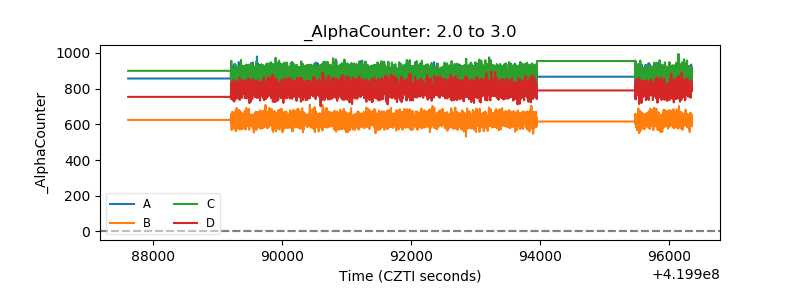 |
| _CPM_Rate | 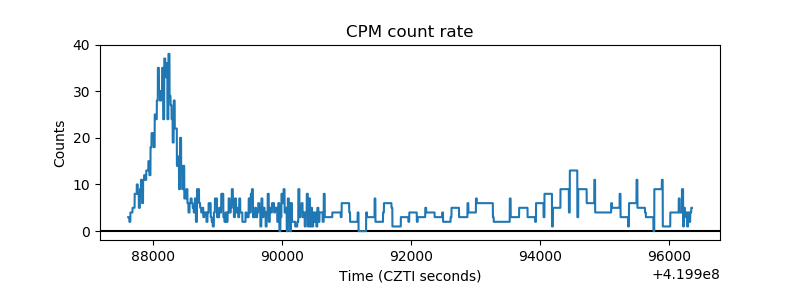 |
| CZT Counter | 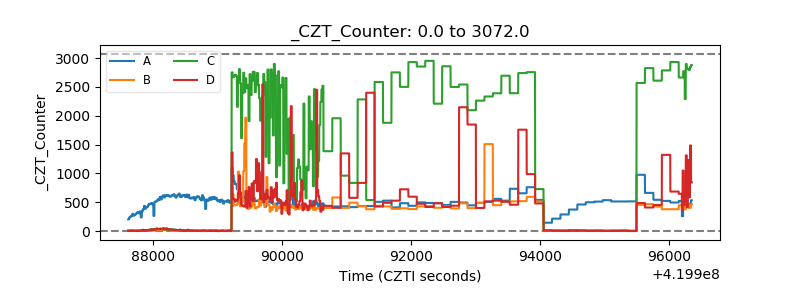 |
| +2.5 Volts monitor | 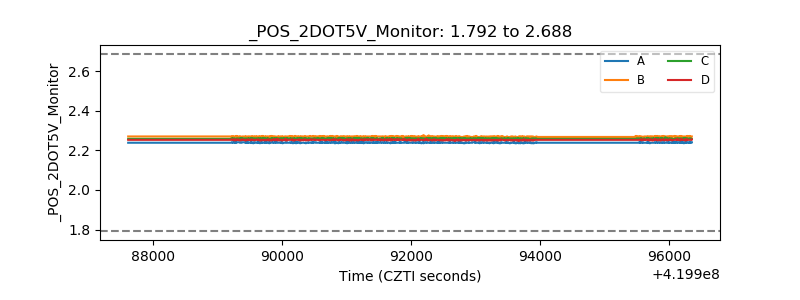 |
| +5 Volts monitor | 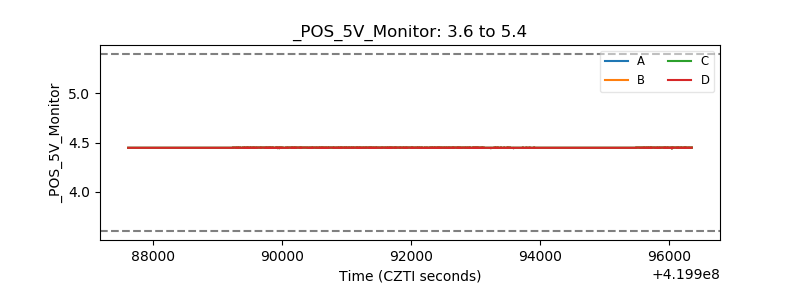 |
| _ROLL_ROT | 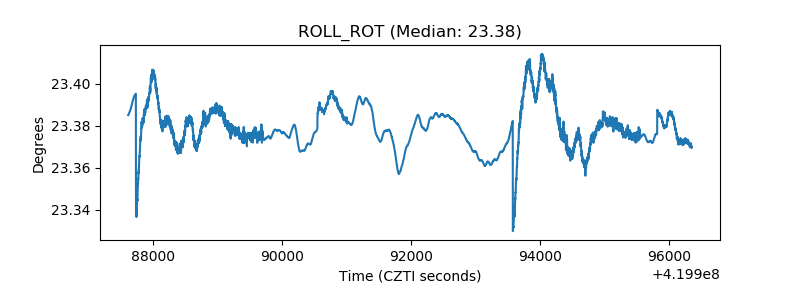 |
| _Roll_DEC | 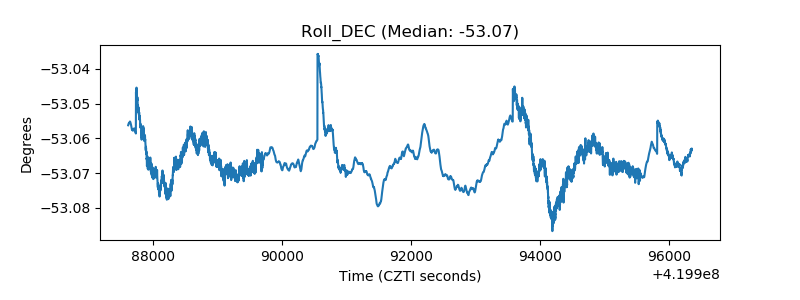 |
| _Roll_RA | 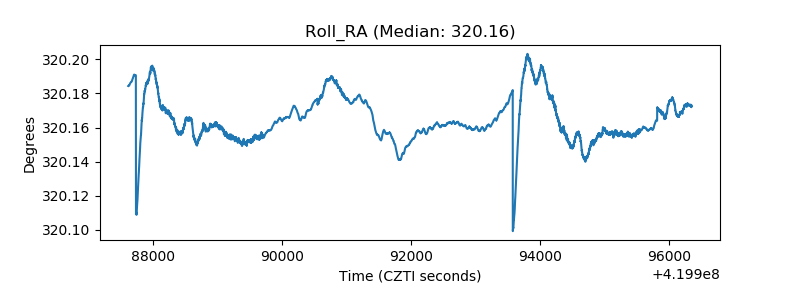 |
| Veto Counter | 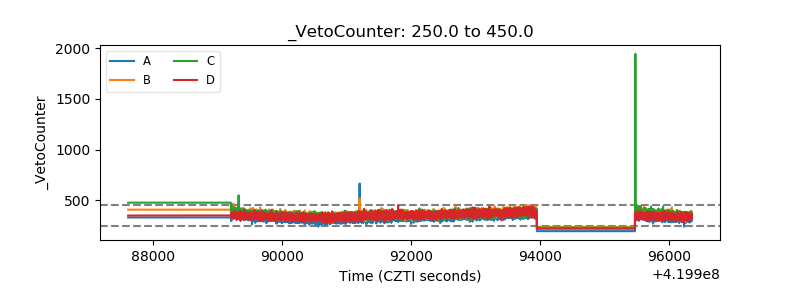 |