| Param | Original file | Final file |
|---|---|---|
| Filename | modeM0/AS1A12_052T04_9000005582_40929cztM0_level2.fits | modeM0/AS1A12_052T04_9000005582_40929cztM0_level2_quad_clean.evt |
| Size (bytes) | 704,928,960 | 76,276,800 |
| Size | 672.3 MB | 72.7 MB |
| Events in quadrant A | 3,039,489 | 638,620 |
| Events in quadrant B | 2,670,829 | 650,269 |
| Events in quadrant C | 15,346,299 | 57,643 |
| Events in quadrant D | 4,578,423 | 550,716 |
| Mode M9 | |||
|---|---|---|---|
| Quadrant | BADHDUFLAG | Total packets | Discarded packets |
| A | 0 | 26 | 0 |
| B | 0 | 26 | 0 |
| C | 0 | 26 | 0 |
| D | 0 | 27 | 0 |
| Mode SS | |||
|---|---|---|---|
| Quadrant | BADHDUFLAG | Total packets | Discarded packets |
| A | 0 | 118 | 0 |
| B | 0 | 118 | 0 |
| C | 0 | 118 | 0 |
| D | 0 | 118 | 0 |
| Mode M0 | |||
|---|---|---|---|
| Quadrant | BADHDUFLAG | Total packets | Discarded packets |
| A | 0 | 12620 | 3 |
| B | 0 | 12253 | 2 |
| C | 0 | 49480 | 2 |
| D | 0 | 17789 | 2 |
| Quadrant | Total seconds | Saturated seconds | Saturation percentage |
|---|---|---|---|
| A | 5905 | 16 | 0.270957% |
| B | 5905 | 30 | 0.508044% |
| C | 5905 | 5481 | 92.819644% |
| D | 5905 | 400 | 6.773920% |
Noise dominated data is calculated using 1-second bins in cleaned event files. If a bin has >2000 counts, and if more than 50% of those come from <1% of pixels, then it is considered to be noise-dominated and hence unusable.
| Quadrant | # 1 sec bins | Bins with >0 counts | Bins with >2000 counts | High rate bins dominated by noise | Noise dominated (total time) | Noise dominated (detector-on time) | Marked lightcurve |
|---|---|---|---|---|---|---|---|
| A | 7219 | 5906 | 6 | 6 | 0.08% | 0.10% | 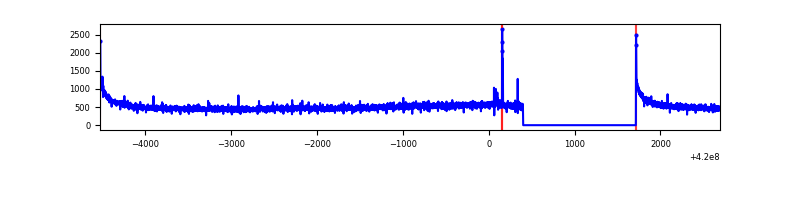 |
| B | 7219 | 5906 | 12 | 12 | 0.17% | 0.20% | 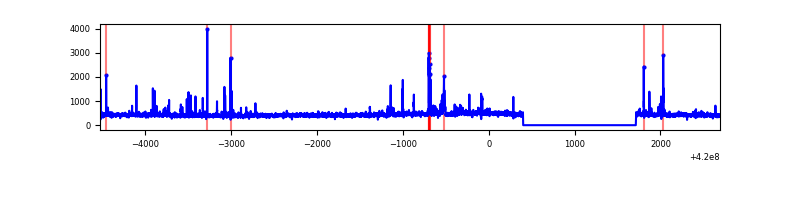 |
| C | 7218 | 5904 | 5125 | 5125 | 71.00% | 86.81% | 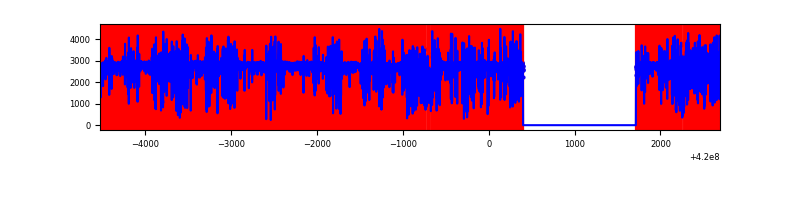 |
| D | 7219 | 5906 | 354 | 354 | 4.90% | 5.99% | 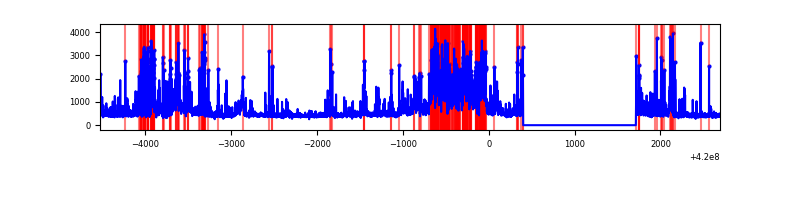 |
Top three noisy pixels from each quadrant. If the there are fewer than three noisy pixels in the level2.evt file, extra rows are filled as -1
| Pixel properties | Quadrant properties | ||||||
|---|---|---|---|---|---|---|---|
| Quadrant | DetID | PixID | Counts | Sigma | Mean | Median | Sigma |
| A | 10 | 83 | 546688 | 4206.06 | 638 | 624 | 129.8 |
| A | 13 | 248 | 20647 | 154.23 | 638 | 624 | 129.8 |
| A | 13 | 254 | 8236 | 58.63 | 638 | 624 | 129.8 |
| B | 5 | 255 | 80849 | 644.88 | 633 | 615 | 124.4 |
| B | 0 | 186 | 51232 | 406.83 | 633 | 615 | 124.4 |
| B | 15 | 85 | 37640 | 297.59 | 633 | 615 | 124.4 |
| C | 0 | 239 | 14266497 | 253619.5 | 236 | 237 | 56.3 |
| C | 15 | 214 | 100914 | 1789.79 | 236 | 237 | 56.3 |
| C | 0 | 10 | 50133 | 887.03 | 236 | 237 | 56.3 |
| D | 12 | 233 | 1258996 | 8424.13 | 612 | 595 | 149.4 |
| D | 13 | 249 | 434165 | 2902.45 | 612 | 595 | 149.4 |
| D | 12 | 6 | 264450 | 1766.33 | 612 | 595 | 149.4 |
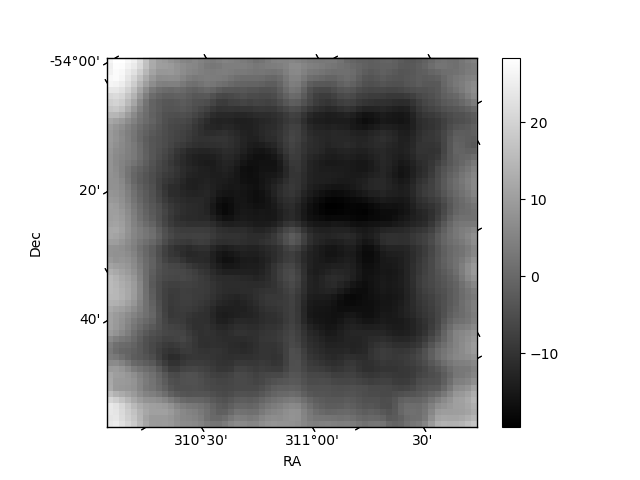
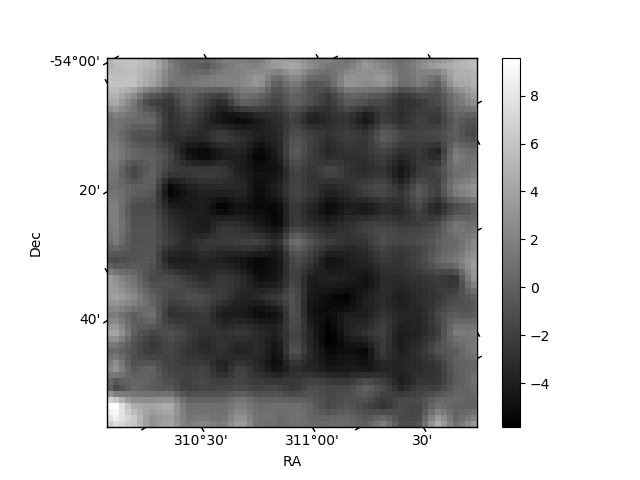
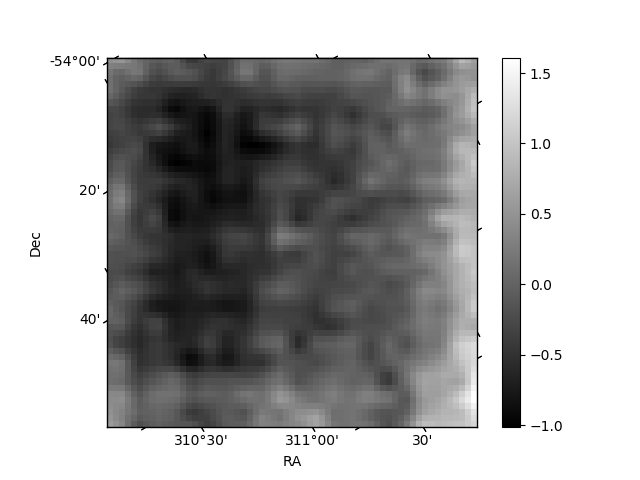
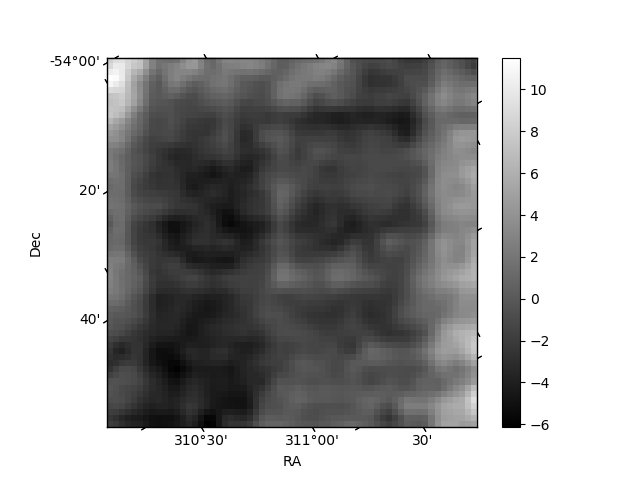
Histogram calculated using DETX and DETY for each event in the final _common_clean file
| Quadrant A | 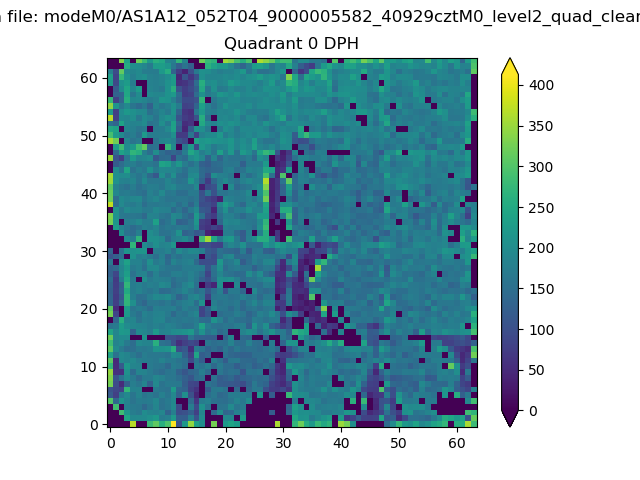 |
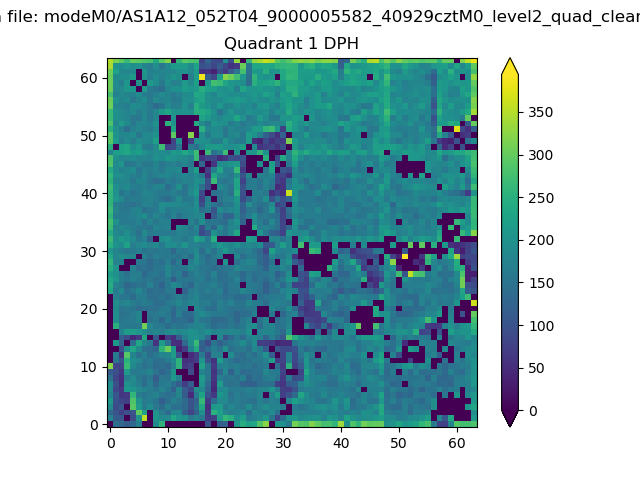 |
Quadrant B |
|---|---|---|---|
| Quadrant D | 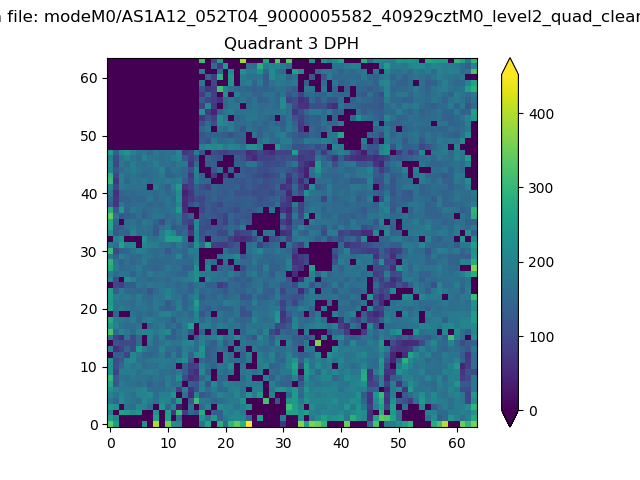 |
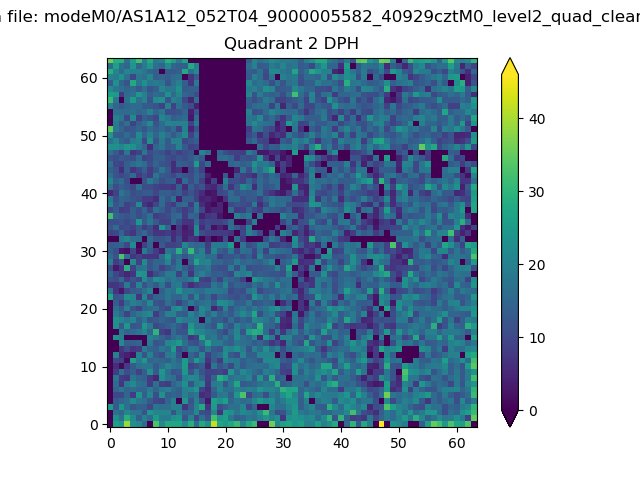 |
Quadrant C |
| Plot type | Count rate plots | Images |
|---|---|---|
| Comparison with Poisson distribution Blue bars denote a histogram of data divided into 1 sec bins. Red curve is a Poisson curve with rate = median count rate of data. |
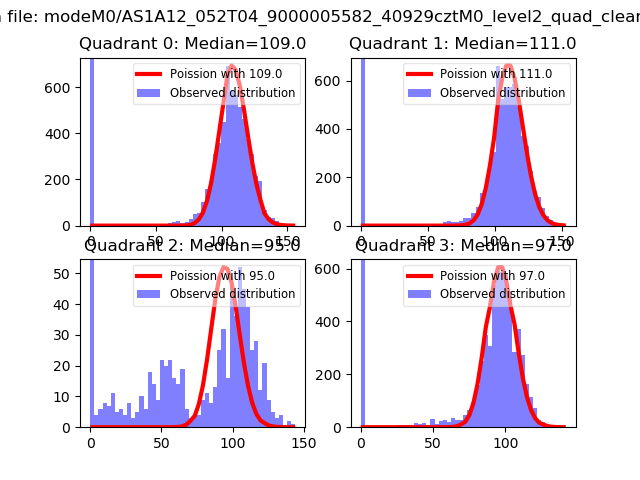 |
 |
| Quadrant-wise count rates Data is divided into 100 sec bins |
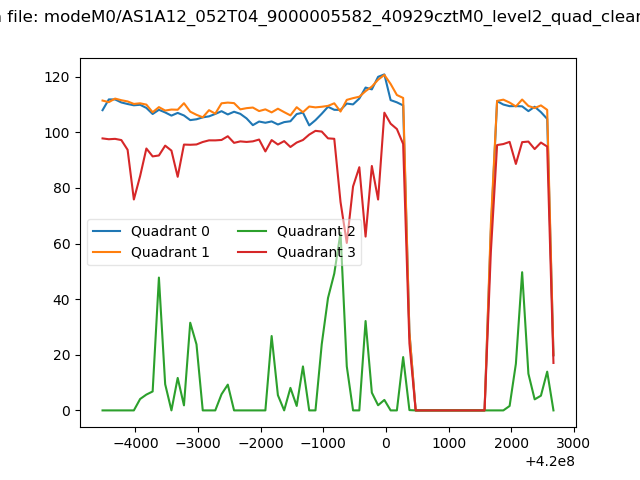 |
|
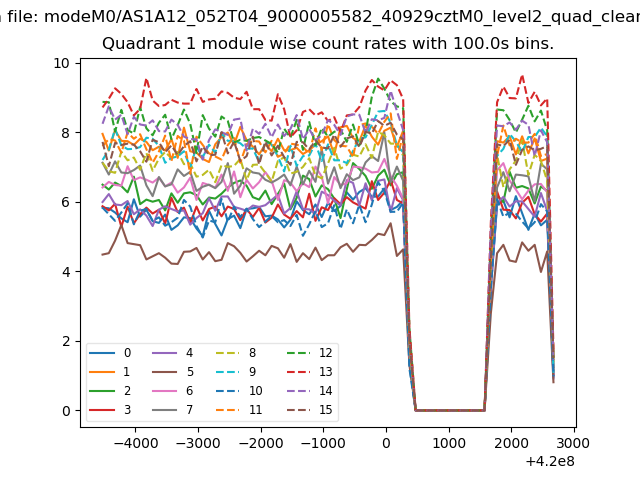
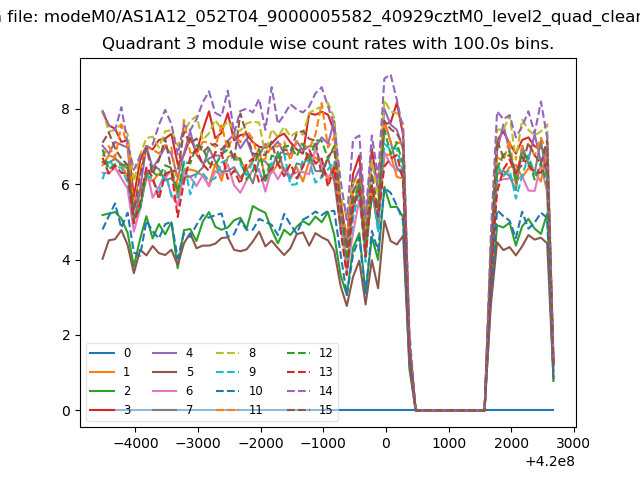
| Module-wise count rates for Quadrant A Data is divided into 100 sec bins |
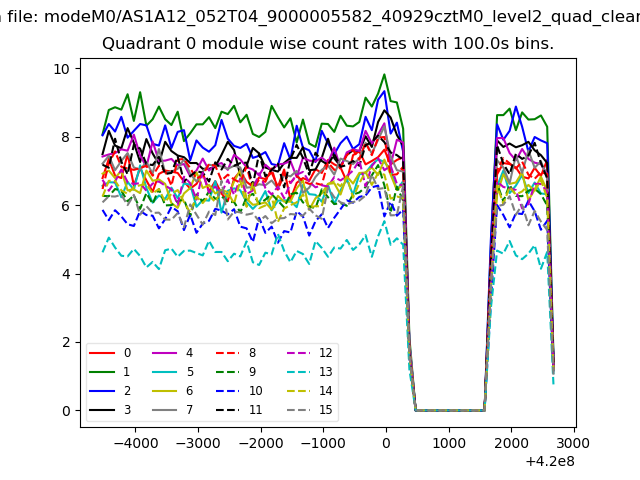 |
 |
| Module-wise count rates for Quadrant B Data is divided into 100 sec bins |
 |
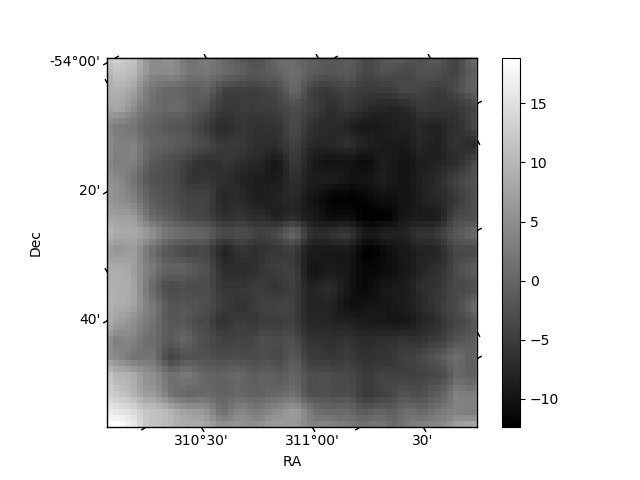 |
| Module-wise count rates for Quadrant C Data is divided into 100 sec bins |
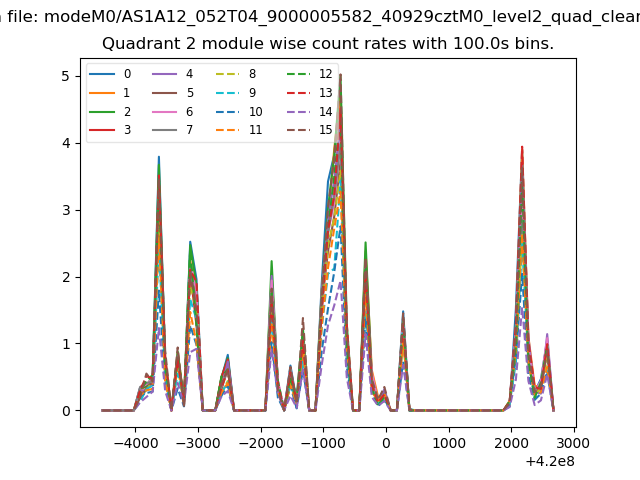 |
 |
| Module-wise count rates for Quadrant D Data is divided into 100 sec bins |
 |
 |
| Parameter | Plot |
|---|---|
| CZT HV Monitor | 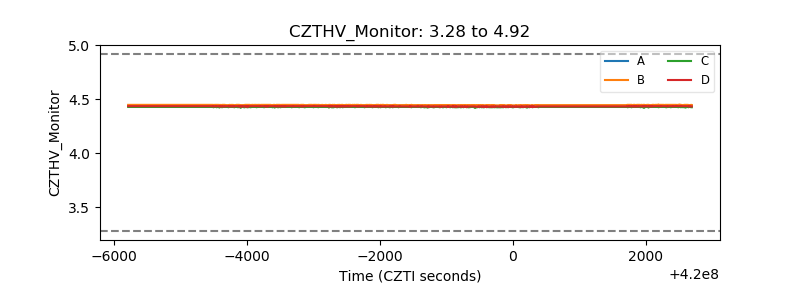 |
| D_VDD | 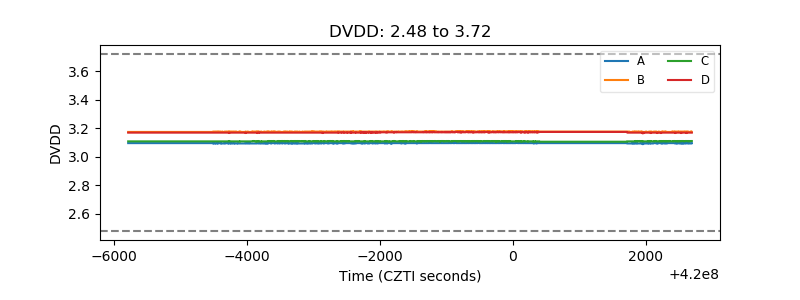 |
| Temperature 1 | 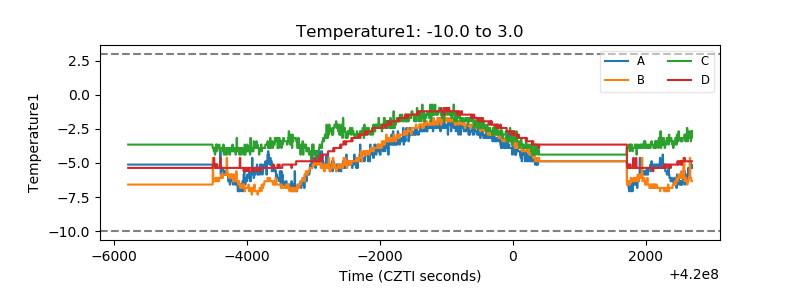 |
| Veto HV Monitor | 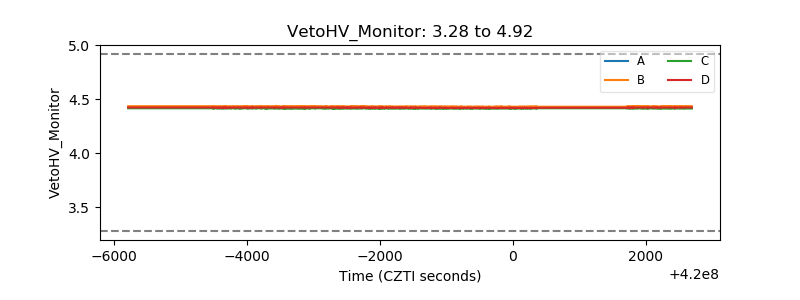 |
| Veto LLD |  |
| Alpha Counter | 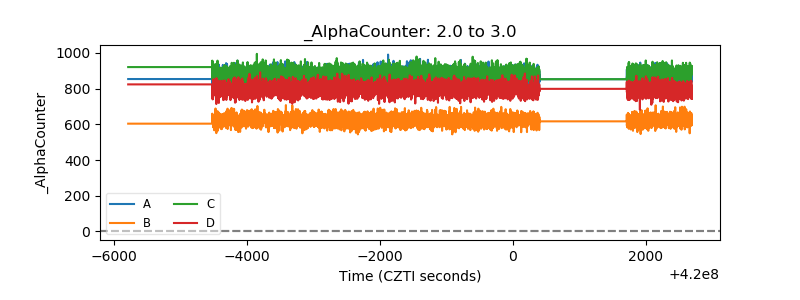 |
| _CPM_Rate |  |
| CZT Counter | 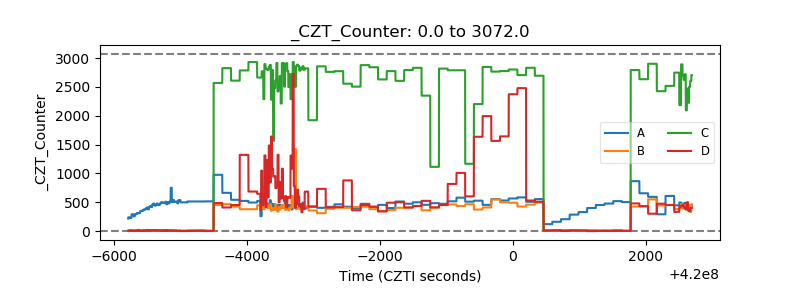 |
| +2.5 Volts monitor | 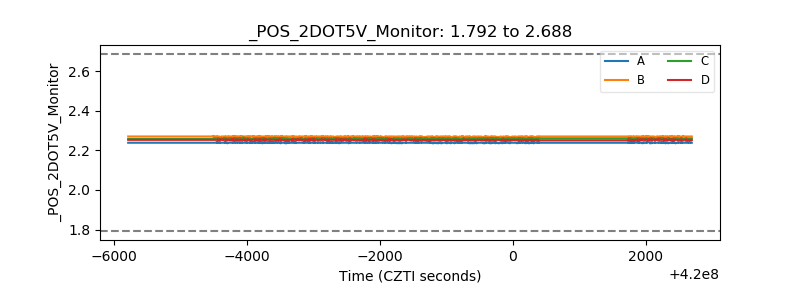 |
| +5 Volts monitor | 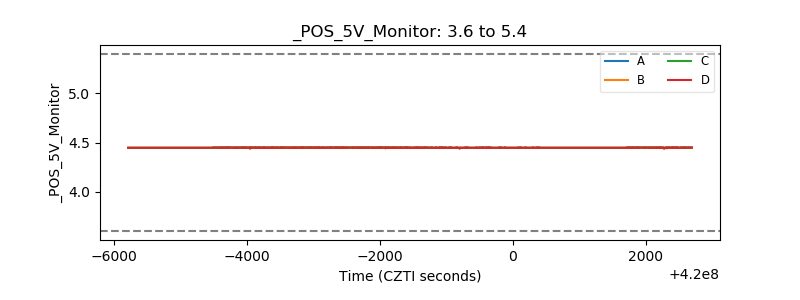 |
| _ROLL_ROT | 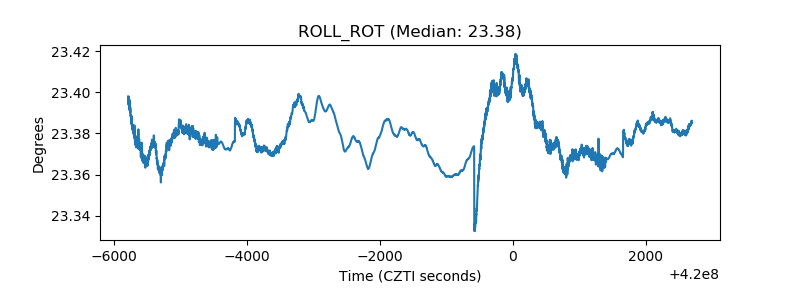 |
| _Roll_DEC | 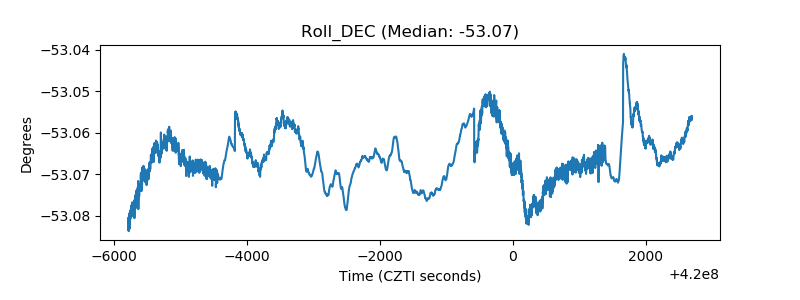 |
| _Roll_RA | 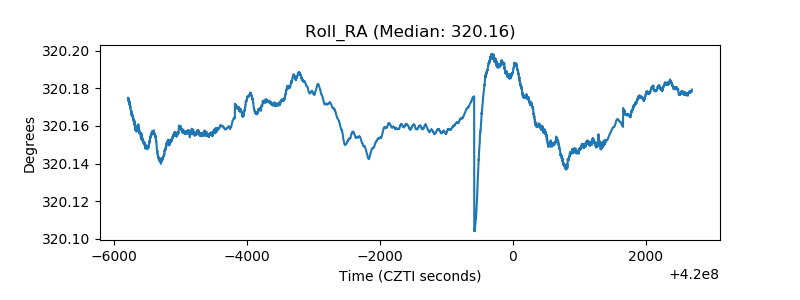 |
| Veto Counter | 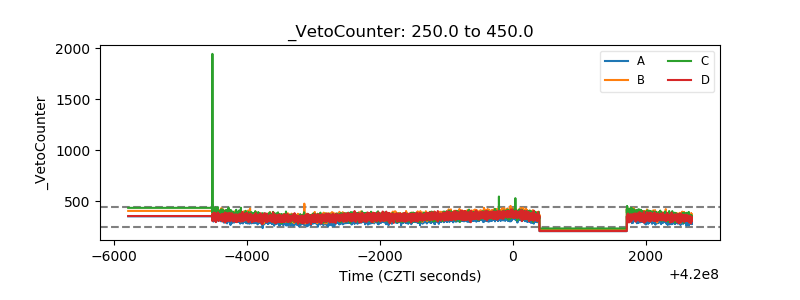 |