| Param | Original file | Final file |
|---|---|---|
| Filename | modeM0/AS1A12_052T04_9000005582_40934cztM0_level2.fits | modeM0/AS1A12_052T04_9000005582_40934cztM0_level2_quad_clean.evt |
| Size (bytes) | 304,323,840 | 89,314,560 |
| Size | 290.2 MB | 85.2 MB |
| Events in quadrant A | 2,749,010 | 598,356 |
| Events in quadrant B | 2,381,916 | 604,091 |
| Events in quadrant C | 2,544,925 | 583,842 |
| Events in quadrant D | 3,162,332 | 534,922 |
| Mode M9 | |||
|---|---|---|---|
| Quadrant | BADHDUFLAG | Total packets | Discarded packets |
| A | 0 | 17 | 0 |
| B | 0 | 17 | 0 |
| C | 0 | 17 | 0 |
| D | 0 | 17 | 0 |
| Mode SS | |||
|---|---|---|---|
| Quadrant | BADHDUFLAG | Total packets | Discarded packets |
| A | 0 | 112 | 0 |
| B | 0 | 112 | 0 |
| C | 0 | 112 | 0 |
| D | 0 | 112 | 0 |
| Mode M0 | |||
|---|---|---|---|
| Quadrant | BADHDUFLAG | Total packets | Discarded packets |
| A | 0 | 11495 | 2 |
| B | 0 | 11124 | 1 |
| C | 0 | 11167 | 1 |
| D | 0 | 13362 | 1 |
| Quadrant | Total seconds | Saturated seconds | Saturation percentage |
|---|---|---|---|
| A | 5475 | 7 | 0.127854% |
| B | 5475 | 16 | 0.292237% |
| C | 5475 | 12 | 0.219178% |
| D | 5475 | 102 | 1.863014% |
Noise dominated data is calculated using 1-second bins in cleaned event files. If a bin has >2000 counts, and if more than 50% of those come from <1% of pixels, then it is considered to be noise-dominated and hence unusable.
| Quadrant | # 1 sec bins | Bins with >0 counts | Bins with >2000 counts | High rate bins dominated by noise | Noise dominated (total time) | Noise dominated (detector-on time) | Marked lightcurve |
|---|---|---|---|---|---|---|---|
| A | 7178 | 5476 | 1 | 1 | 0.01% | 0.02% | 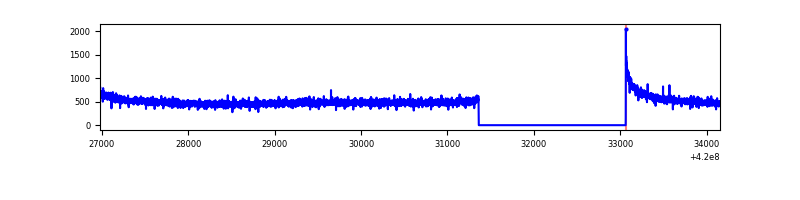 |
| B | 7178 | 5476 | 4 | 4 | 0.06% | 0.07% | 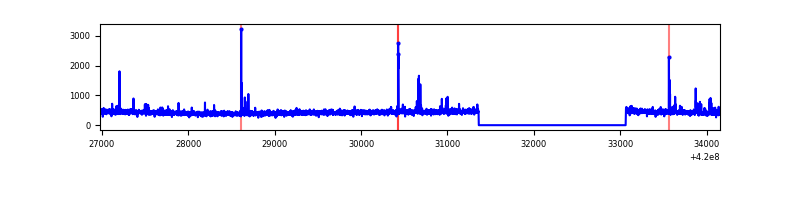 |
| C | 7178 | 5476 | 9 | 9 | 0.13% | 0.16% | 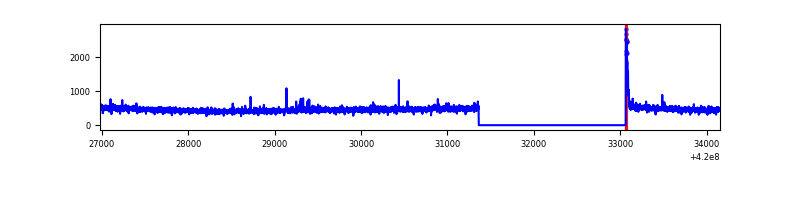 |
| D | 7178 | 5476 | 89 | 89 | 1.24% | 1.63% | 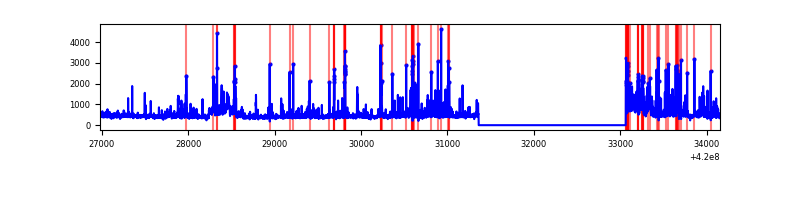 |
Top three noisy pixels from each quadrant. If the there are fewer than three noisy pixels in the level2.evt file, extra rows are filled as -1
| Pixel properties | Quadrant properties | ||||||
|---|---|---|---|---|---|---|---|
| Quadrant | DetID | PixID | Counts | Sigma | Mean | Median | Sigma |
| A | 10 | 83 | 450358 | 3692.3 | 593 | 580 | 121.8 |
| A | 13 | 254 | 8092 | 61.67 | 593 | 580 | 121.8 |
| A | 3 | 137 | 6569 | 49.16 | 593 | 580 | 121.8 |
| B | 5 | 255 | 80721 | 706.63 | 583 | 567 | 113.4 |
| B | 12 | 111 | 14322 | 121.26 | 583 | 567 | 113.4 |
| B | 11 | 111 | 13444 | 113.52 | 583 | 567 | 113.4 |
| C | 15 | 214 | 234642 | 1756.49 | 574 | 578 | 133.3 |
| C | 0 | 10 | 47331 | 350.85 | 574 | 578 | 133.3 |
| C | 12 | 249 | 15963 | 115.45 | 574 | 578 | 133.3 |
| D | 12 | 233 | 278049 | 1940.4 | 576 | 558 | 143.0 |
| D | 2 | 249 | 199187 | 1388.95 | 576 | 558 | 143.0 |
| D | 13 | 249 | 168556 | 1174.75 | 576 | 558 | 143.0 |
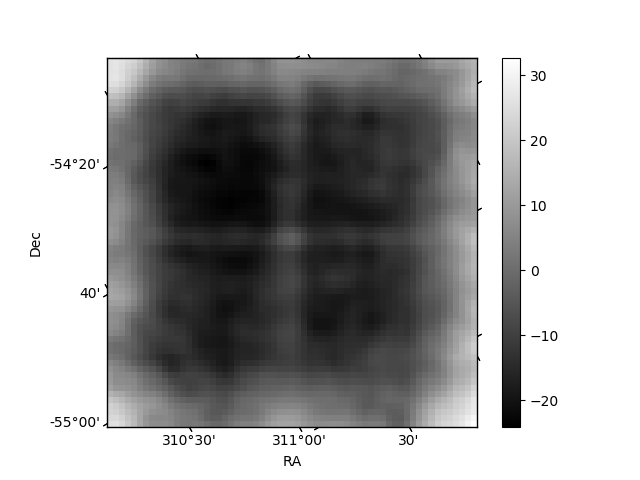
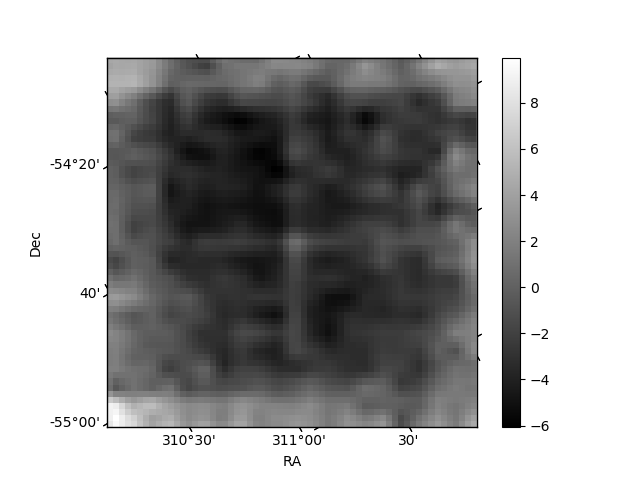
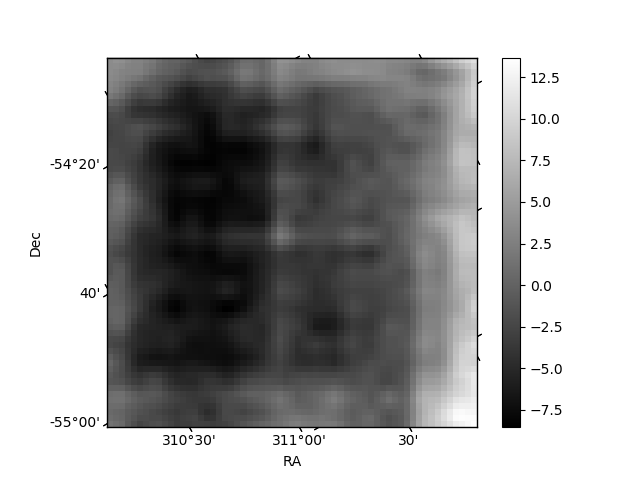
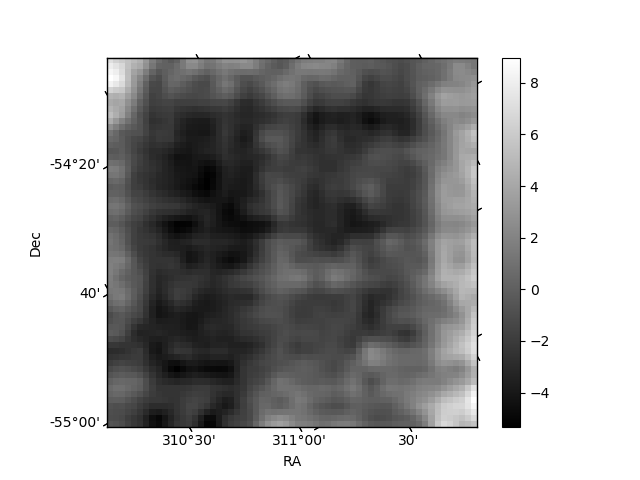
Histogram calculated using DETX and DETY for each event in the final _common_clean file
| Quadrant A | 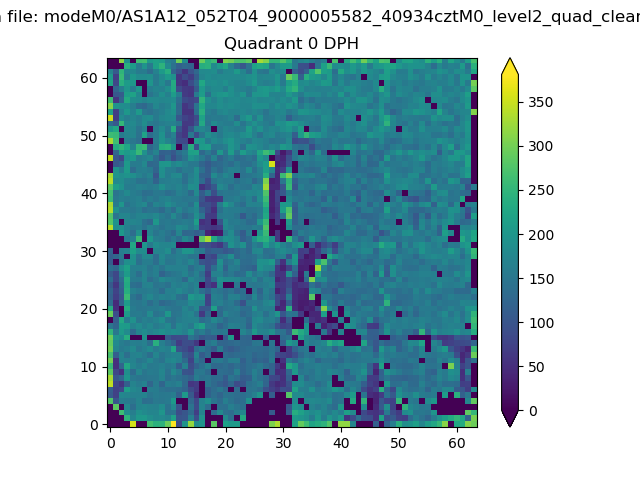 |
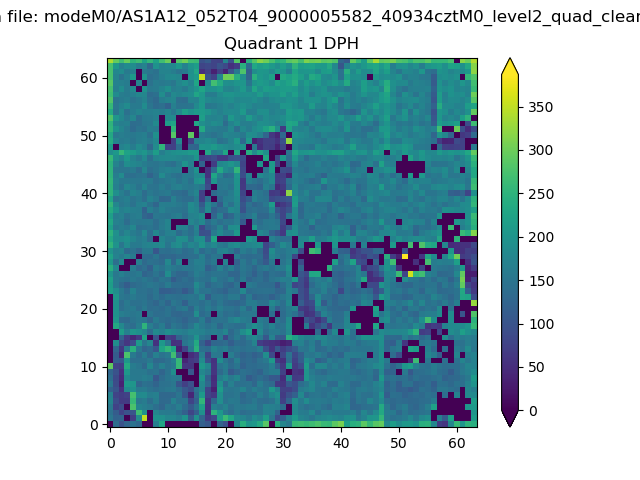 |
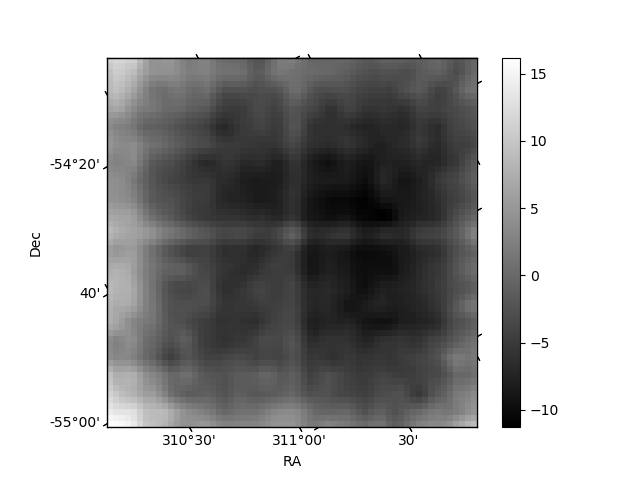
Quadrant B |
|---|---|---|---|
| Quadrant D | 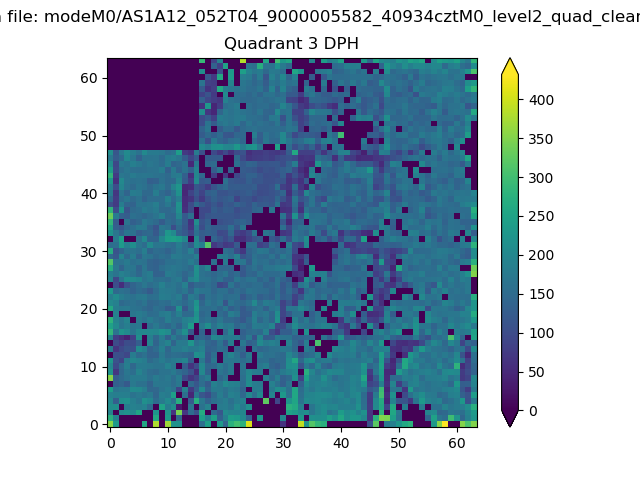 |
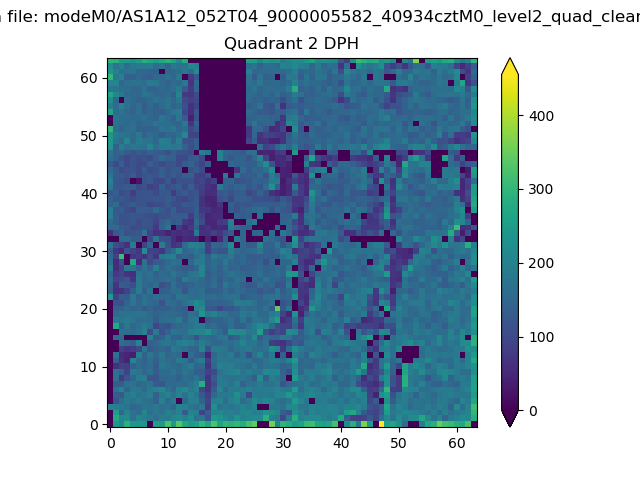 |
Quadrant C |
| Plot type | Count rate plots | Images |
|---|---|---|
| Comparison with Poisson distribution Blue bars denote a histogram of data divided into 1 sec bins. Red curve is a Poisson curve with rate = median count rate of data. |
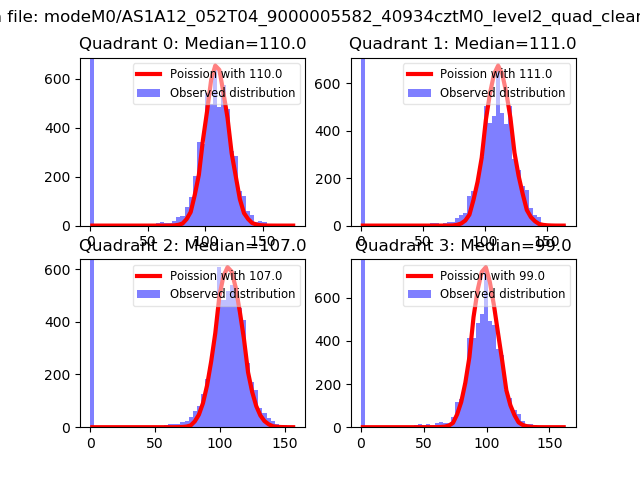 |
 |
| Quadrant-wise count rates Data is divided into 100 sec bins |
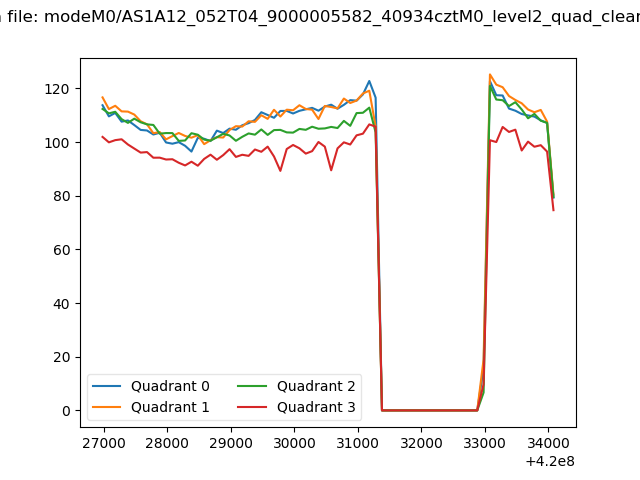 |
|
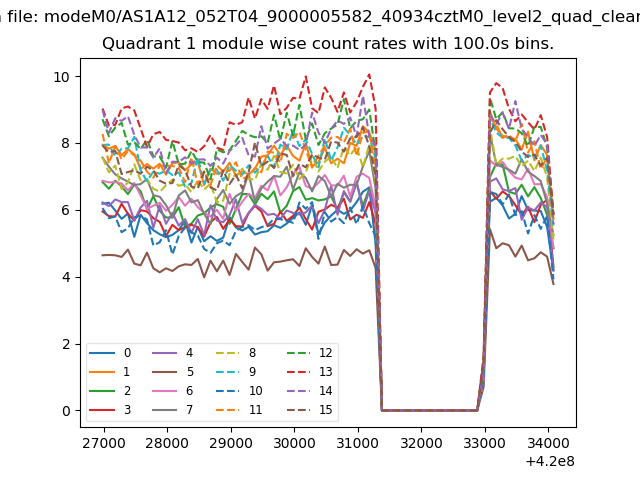
| Module-wise count rates for Quadrant A Data is divided into 100 sec bins |
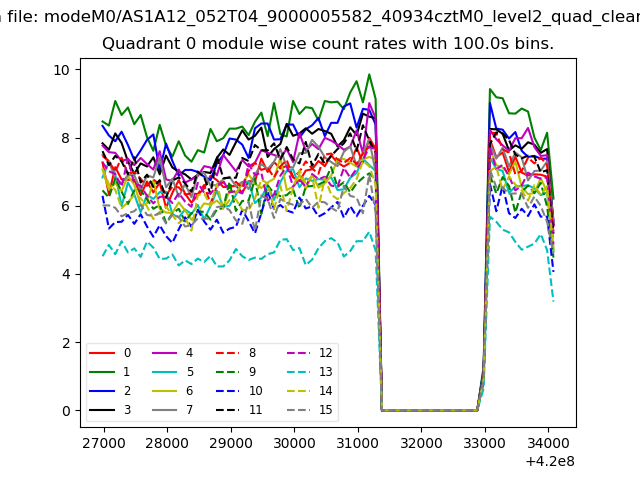 |
 |
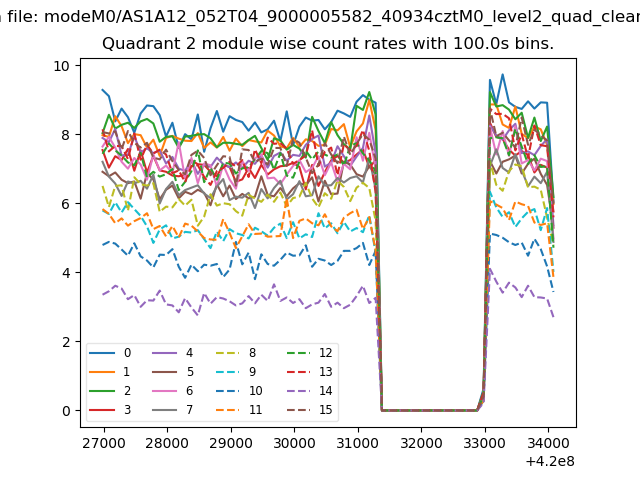
| Module-wise count rates for Quadrant B Data is divided into 100 sec bins |
 |
 |
| Module-wise count rates for Quadrant C Data is divided into 100 sec bins |
 |
 |
| Module-wise count rates for Quadrant D Data is divided into 100 sec bins |
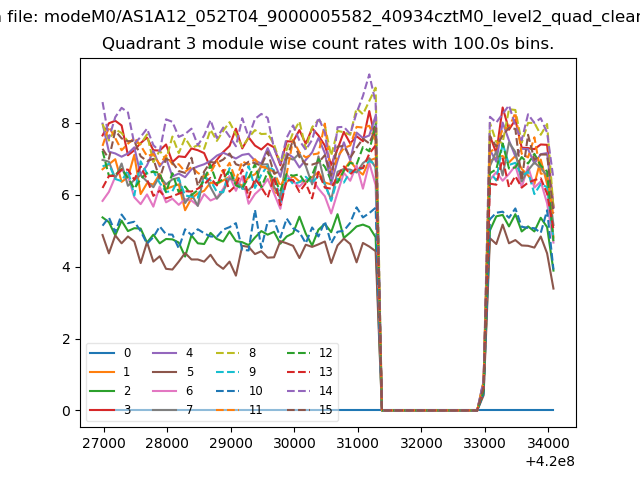 |
 |
| Parameter | Plot |
|---|---|
| CZT HV Monitor | 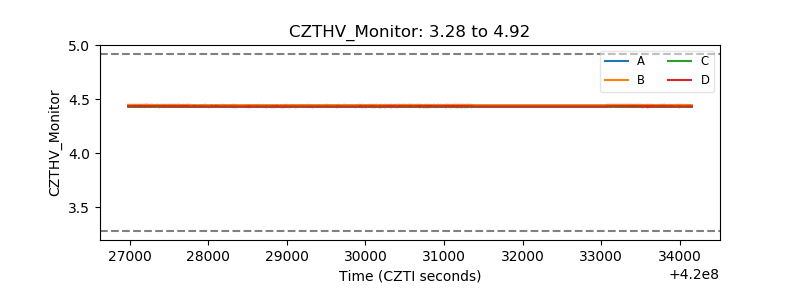 |
| D_VDD | 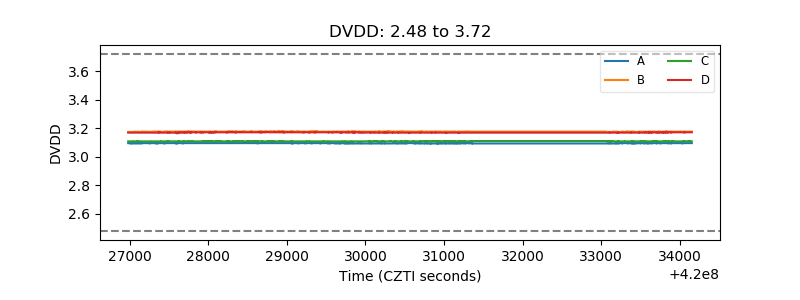 |
| Temperature 1 | 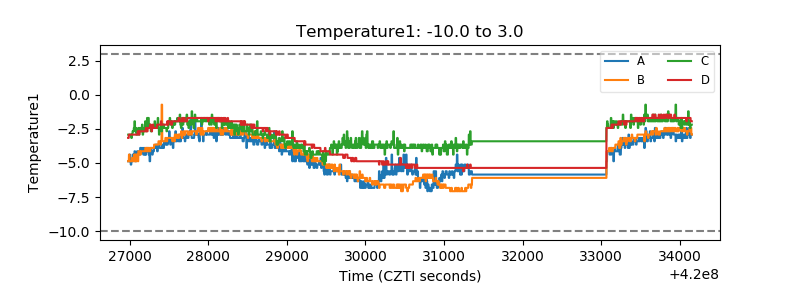 |
| Veto HV Monitor | 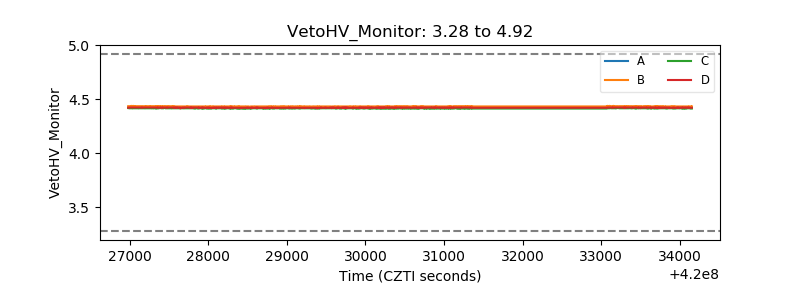 |
| Veto LLD | 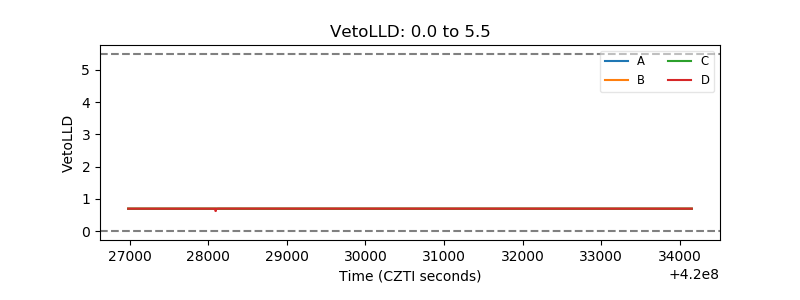 |
| Alpha Counter | 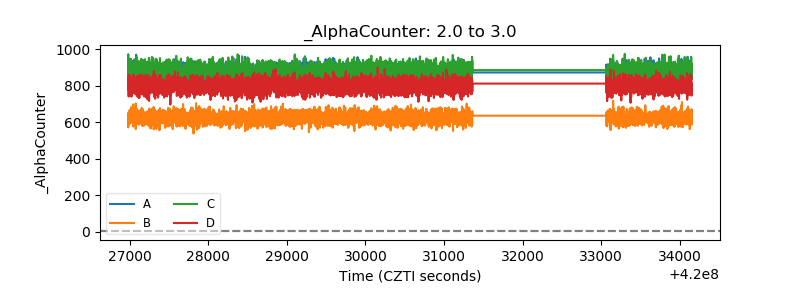 |
| _CPM_Rate | 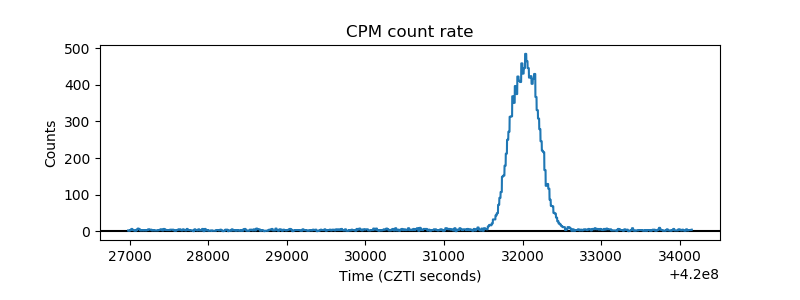 |
| CZT Counter | 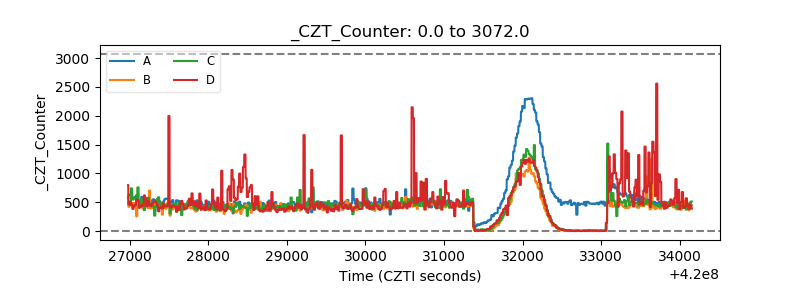 |
| +2.5 Volts monitor | 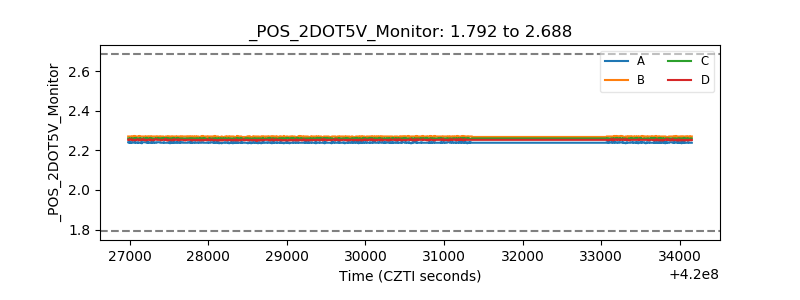 |
| +5 Volts monitor | 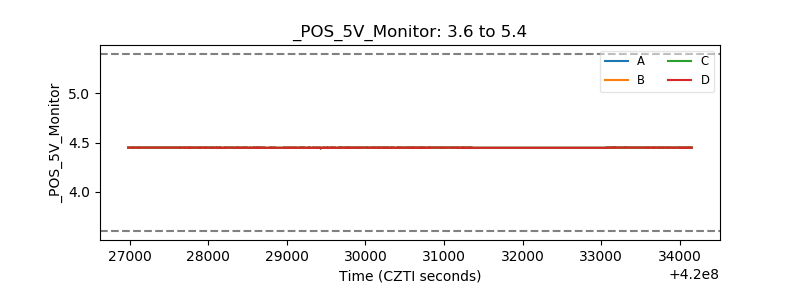 |
| _ROLL_ROT | 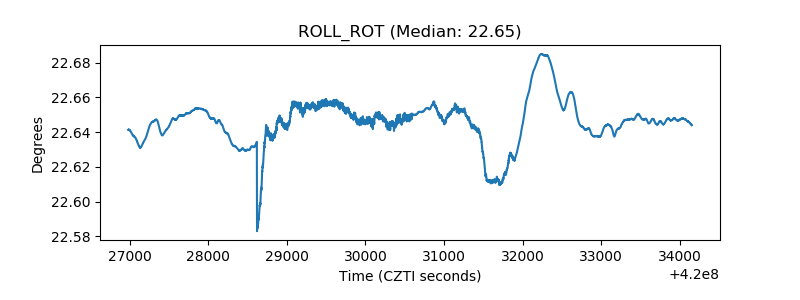 |
| _Roll_DEC | 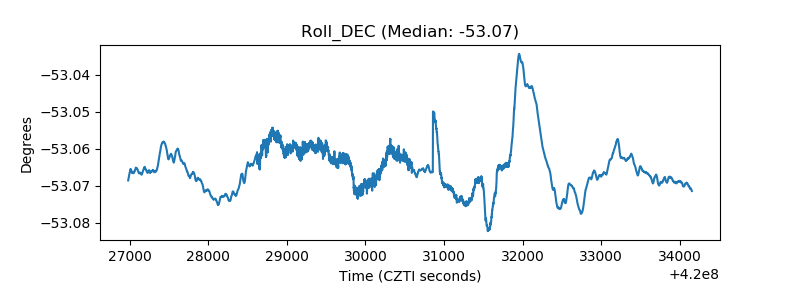 |
| _Roll_RA | 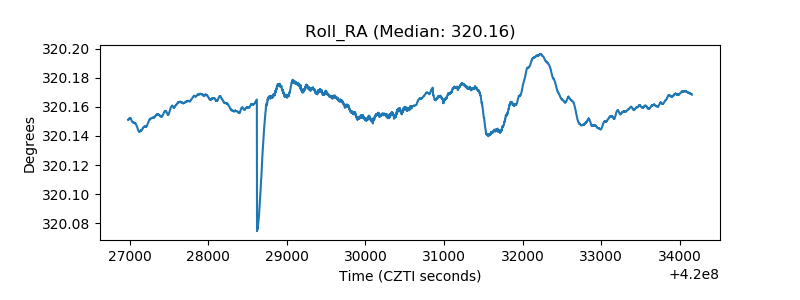 |
| Veto Counter | 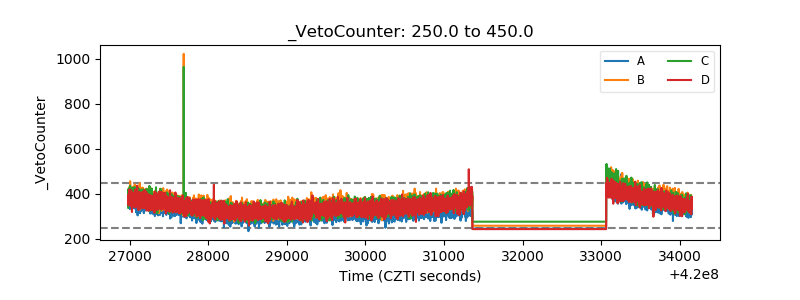 |