| Param | Original file | Final file |
|---|---|---|
| Filename | modeM0/AS1A12_052T04_9000005582_40936cztM0_level2.fits | modeM0/AS1A12_052T04_9000005582_40936cztM0_level2_quad_clean.evt |
| Size (bytes) | 345,548,160 | 90,331,200 |
| Size | 329.5 MB | 86.1 MB |
| Events in quadrant A | 2,859,329 | 614,845 |
| Events in quadrant B | 2,558,498 | 623,414 |
| Events in quadrant C | 2,815,710 | 591,635 |
| Events in quadrant D | 4,132,367 | 523,058 |
| Mode M9 | |||
|---|---|---|---|
| Quadrant | BADHDUFLAG | Total packets | Discarded packets |
| A | 0 | 23 | 0 |
| B | 0 | 23 | 0 |
| C | 0 | 23 | 0 |
| D | 0 | 24 | 0 |
| Mode SS | |||
|---|---|---|---|
| Quadrant | BADHDUFLAG | Total packets | Discarded packets |
| A | 0 | 112 | 0 |
| B | 0 | 112 | 0 |
| C | 0 | 112 | 0 |
| D | 0 | 112 | 0 |
| Mode M0 | |||
|---|---|---|---|
| Quadrant | BADHDUFLAG | Total packets | Discarded packets |
| A | 0 | 11839 | 3 |
| B | 0 | 11451 | 2 |
| C | 0 | 11896 | 2 |
| D | 0 | 16127 | 2 |
| Quadrant | Total seconds | Saturated seconds | Saturation percentage |
|---|---|---|---|
| A | 5457 | 12 | 0.219901% |
| B | 5457 | 36 | 0.659703% |
| C | 5457 | 74 | 1.356056% |
| D | 5457 | 411 | 7.531611% |
Noise dominated data is calculated using 1-second bins in cleaned event files. If a bin has >2000 counts, and if more than 50% of those come from <1% of pixels, then it is considered to be noise-dominated and hence unusable.
| Quadrant | # 1 sec bins | Bins with >0 counts | Bins with >2000 counts | High rate bins dominated by noise | Noise dominated (total time) | Noise dominated (detector-on time) | Marked lightcurve |
|---|---|---|---|---|---|---|---|
| A | 7280 | 5458 | 2 | 2 | 0.03% | 0.04% | 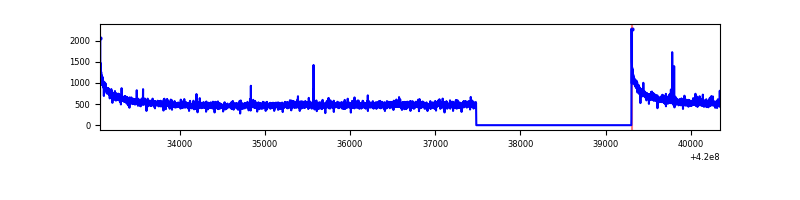 |
| B | 7280 | 5458 | 20 | 20 | 0.27% | 0.37% | 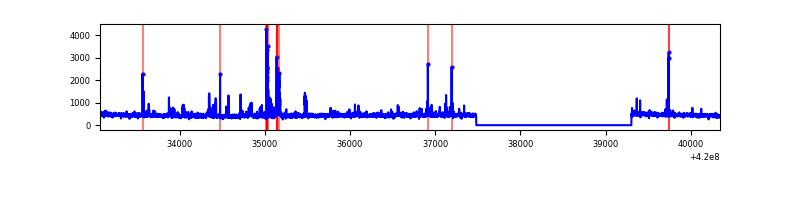 |
| C | 7280 | 5458 | 63 | 63 | 0.87% | 1.15% | 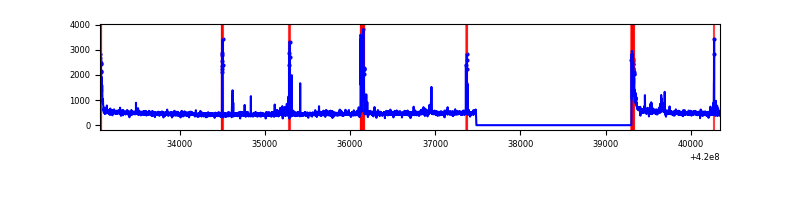 |
| D | 7280 | 5458 | 362 | 362 | 4.97% | 6.63% | 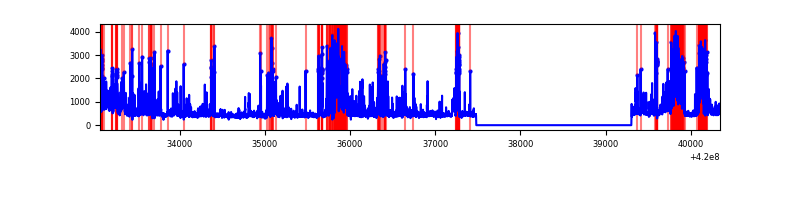 |
Top three noisy pixels from each quadrant. If the there are fewer than three noisy pixels in the level2.evt file, extra rows are filled as -1
| Pixel properties | Quadrant properties | ||||||
|---|---|---|---|---|---|---|---|
| Quadrant | DetID | PixID | Counts | Sigma | Mean | Median | Sigma |
| A | 10 | 83 | 506963 | 4155.49 | 601 | 588 | 121.9 |
| A | 2 | 79 | 15465 | 122.09 | 601 | 588 | 121.9 |
| A | 7 | 3 | 8595 | 65.71 | 601 | 588 | 121.9 |
| B | 5 | 255 | 220098 | 1916.23 | 592 | 576 | 114.6 |
| B | 15 | 35 | 15672 | 131.77 | 592 | 576 | 114.6 |
| B | 12 | 111 | 14364 | 120.36 | 592 | 576 | 114.6 |
| C | 15 | 214 | 238374 | 1765.46 | 578 | 582 | 134.7 |
| C | 14 | 254 | 153651 | 1136.44 | 578 | 582 | 134.7 |
| C | 0 | 10 | 127223 | 940.23 | 578 | 582 | 134.7 |
| D | 12 | 233 | 624610 | 4491.2 | 567 | 549 | 139.0 |
| D | 2 | 249 | 541617 | 3893.92 | 567 | 549 | 139.0 |
| D | 13 | 249 | 407655 | 2929.83 | 567 | 549 | 139.0 |
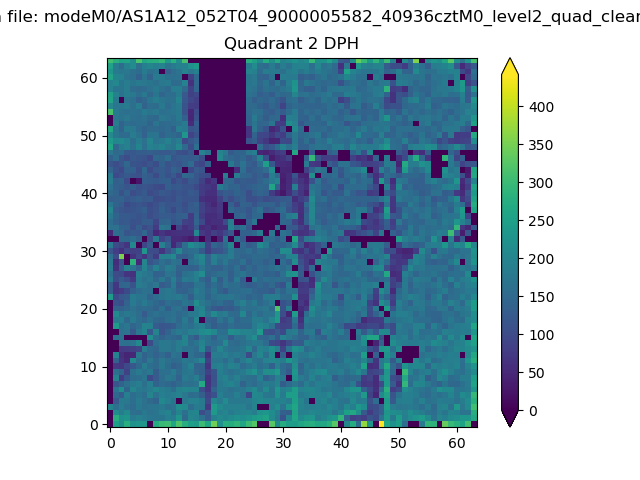
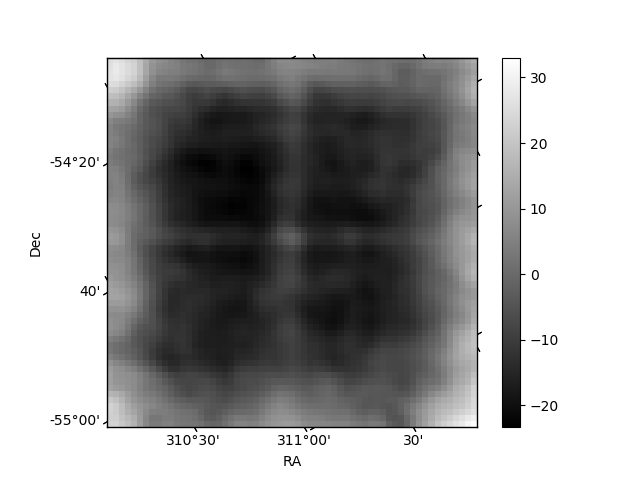
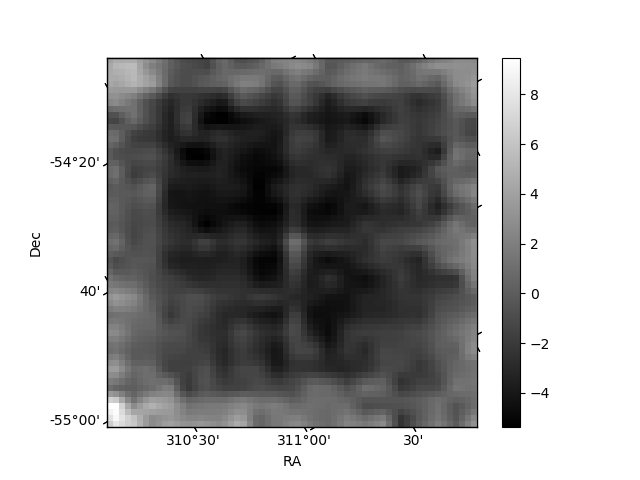
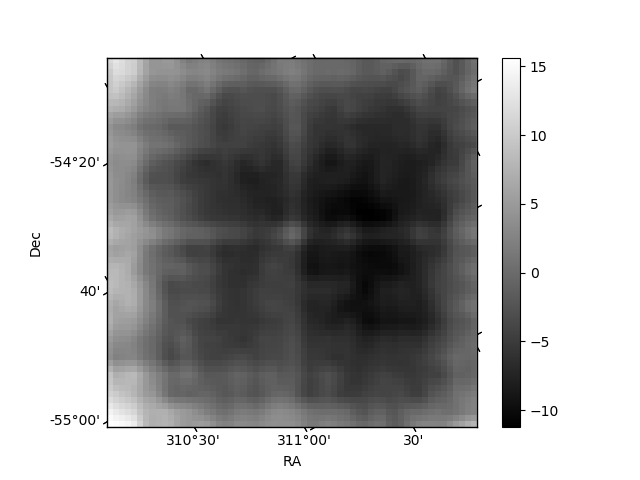
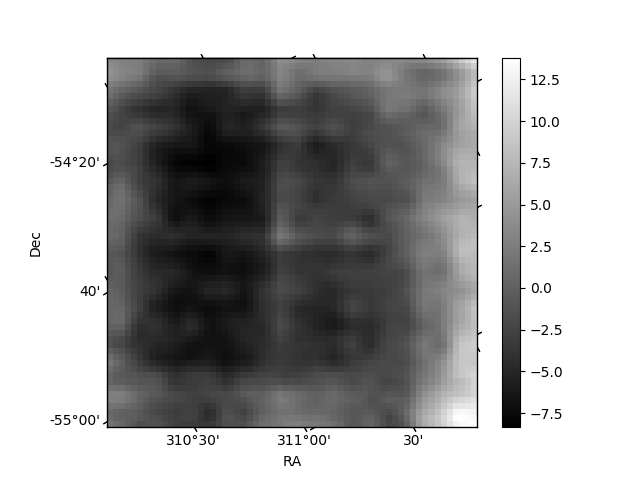
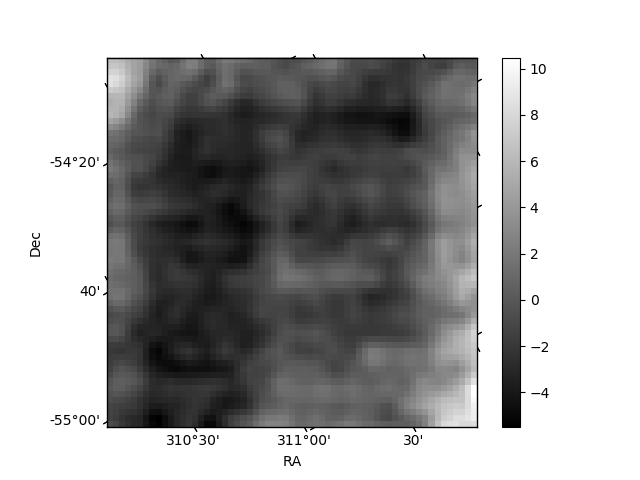
Histogram calculated using DETX and DETY for each event in the final _common_clean file
| Quadrant A | 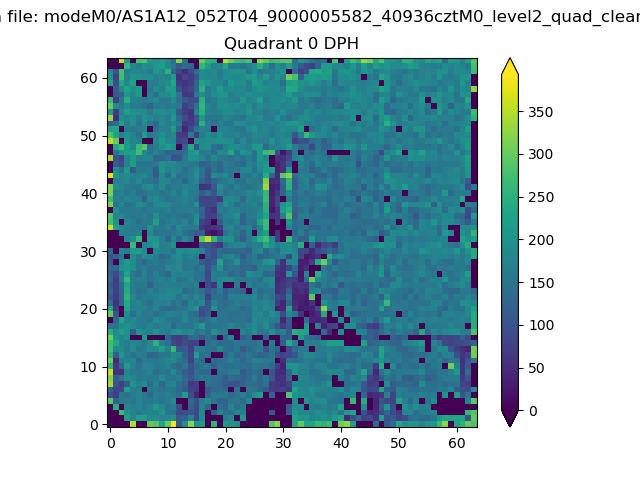 |
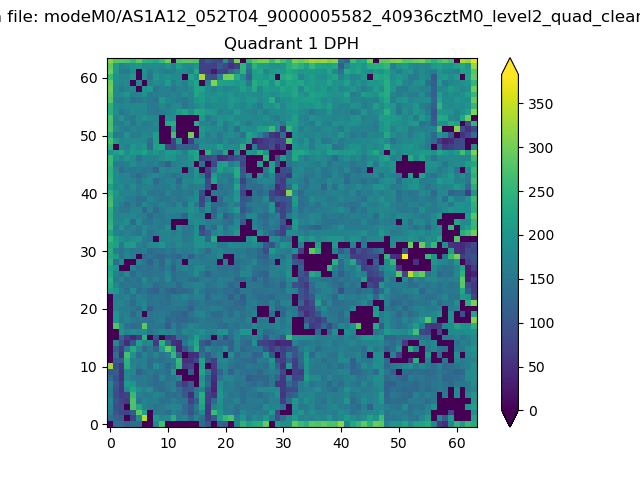 |
Quadrant B |
|---|---|---|---|
| Quadrant D | 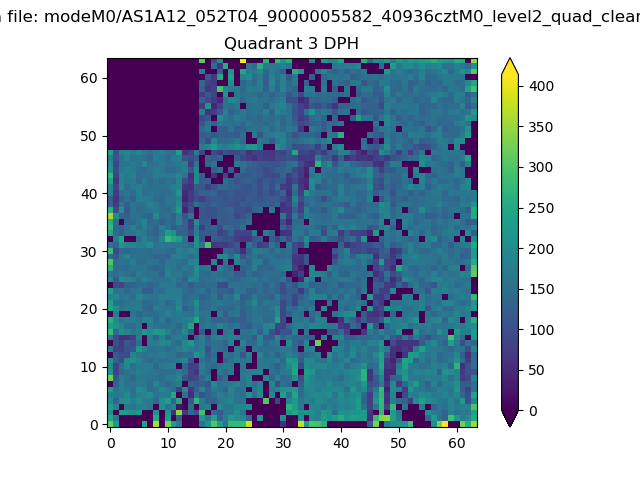 |
 |
Quadrant C |
| Plot type | Count rate plots | Images |
|---|---|---|
| Comparison with Poisson distribution Blue bars denote a histogram of data divided into 1 sec bins. Red curve is a Poisson curve with rate = median count rate of data. |
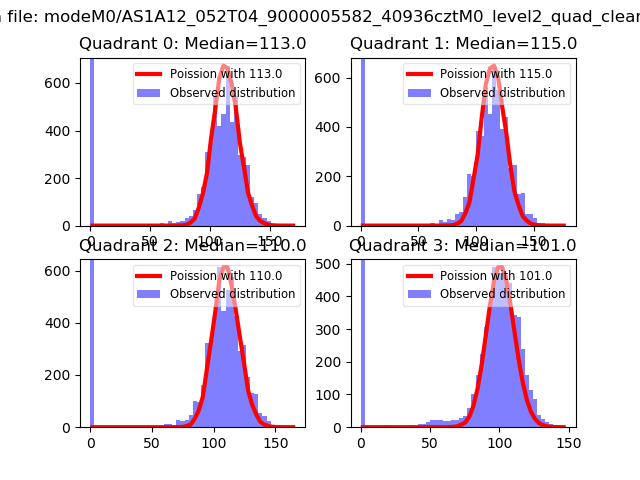 |
 |
| Quadrant-wise count rates Data is divided into 100 sec bins |
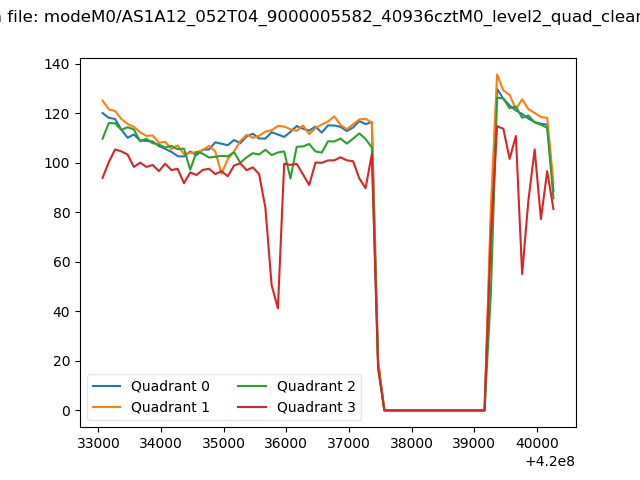 |
|
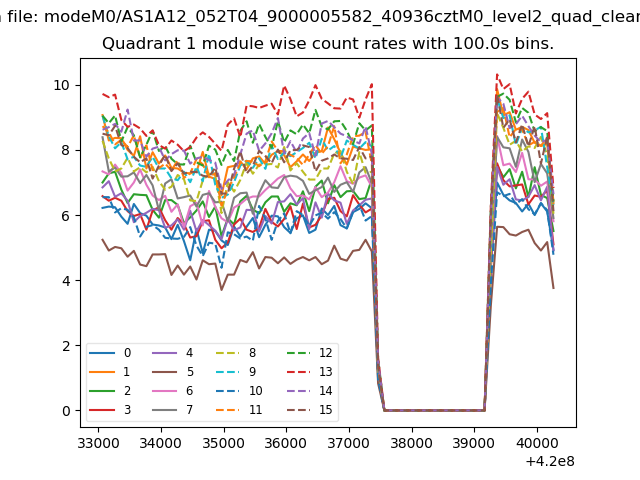
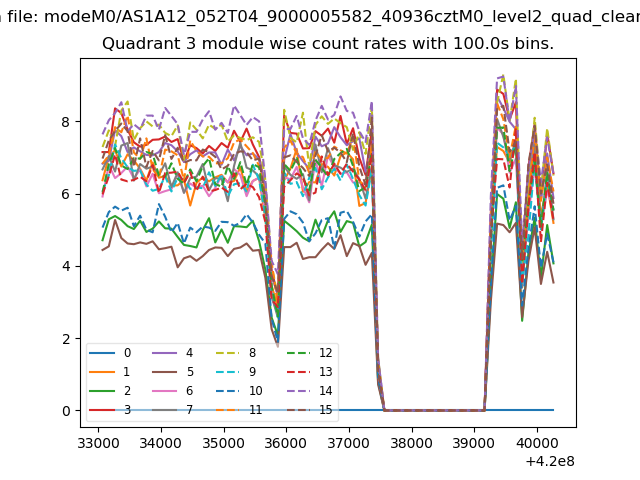
| Module-wise count rates for Quadrant A Data is divided into 100 sec bins |
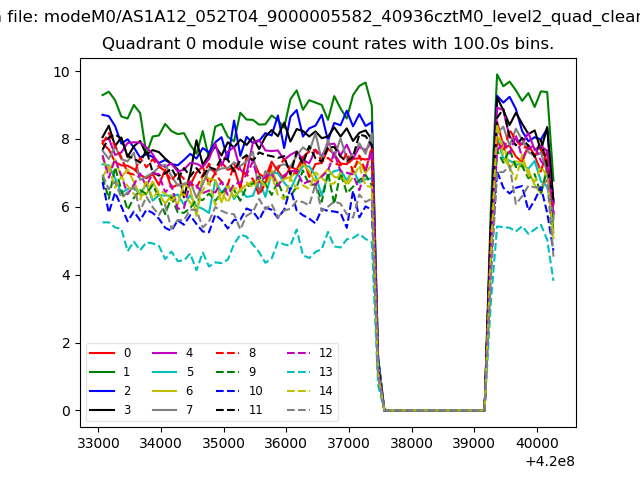 |
 |
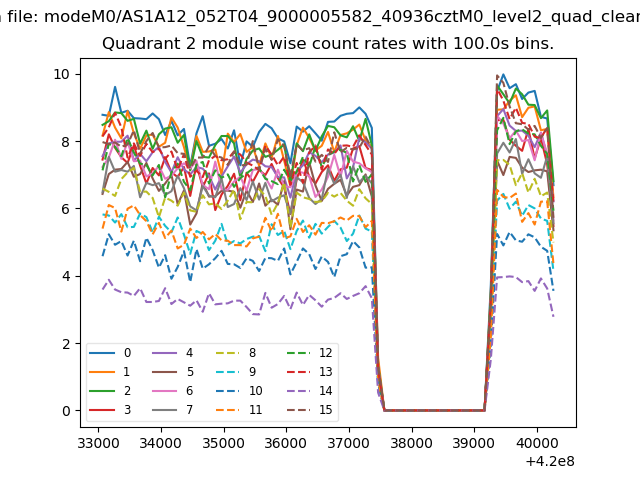
| Module-wise count rates for Quadrant B Data is divided into 100 sec bins |
 |
 |
| Module-wise count rates for Quadrant C Data is divided into 100 sec bins |
 |
 |
| Module-wise count rates for Quadrant D Data is divided into 100 sec bins |
 |
 |
| Parameter | Plot |
|---|---|
| CZT HV Monitor | 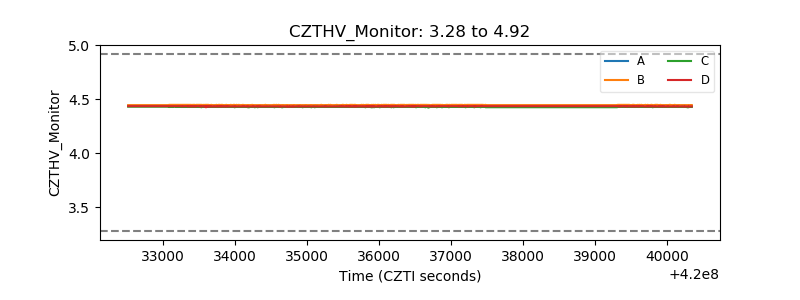 |
| D_VDD | 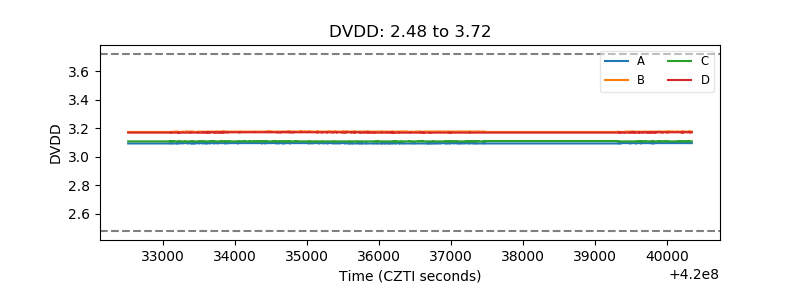 |
| Temperature 1 | 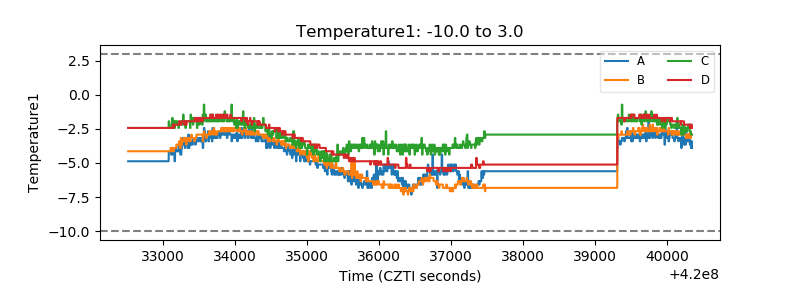 |
| Veto HV Monitor | 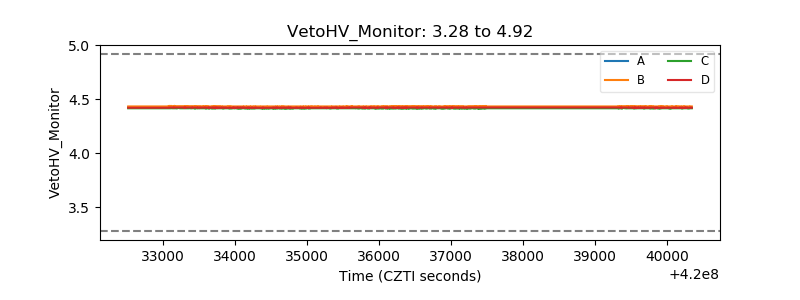 |
| Veto LLD | 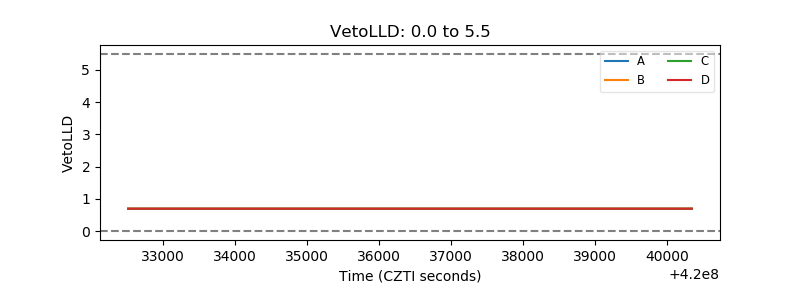 |
| Alpha Counter | 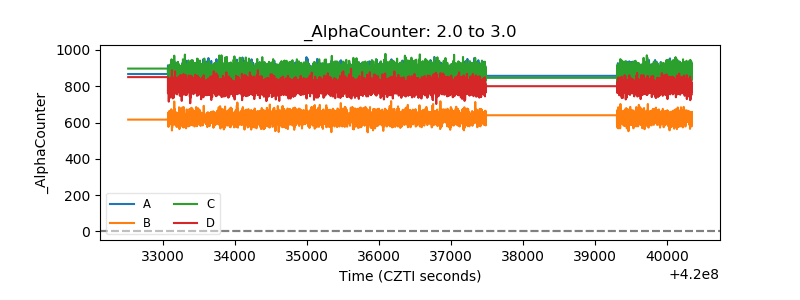 |
| _CPM_Rate | 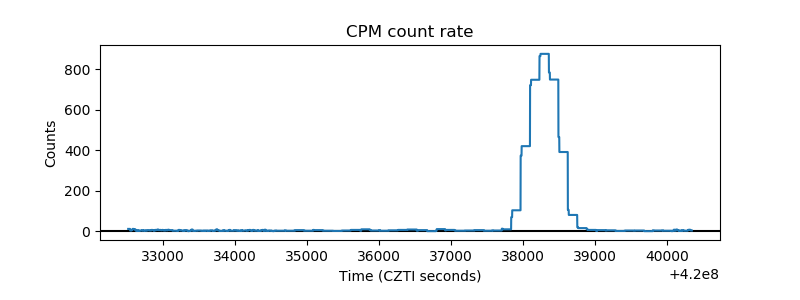 |
| CZT Counter | 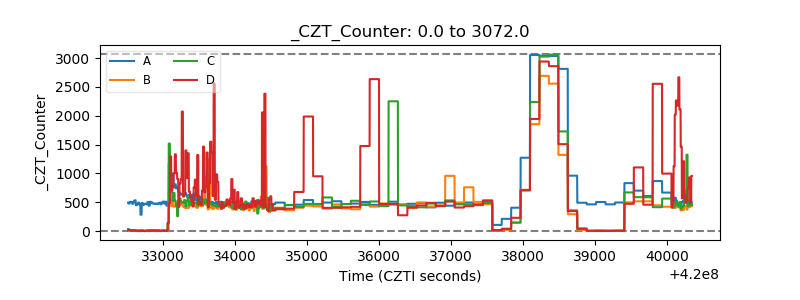 |
| +2.5 Volts monitor | 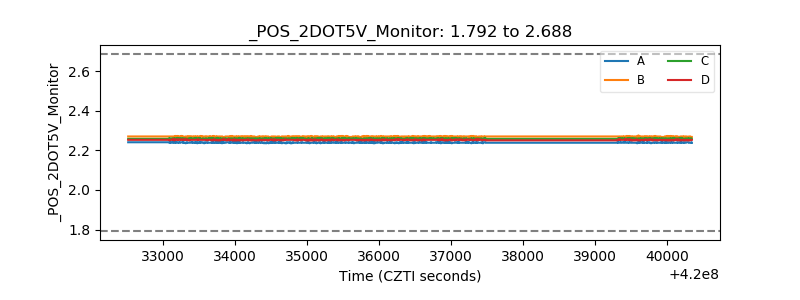 |
| +5 Volts monitor | 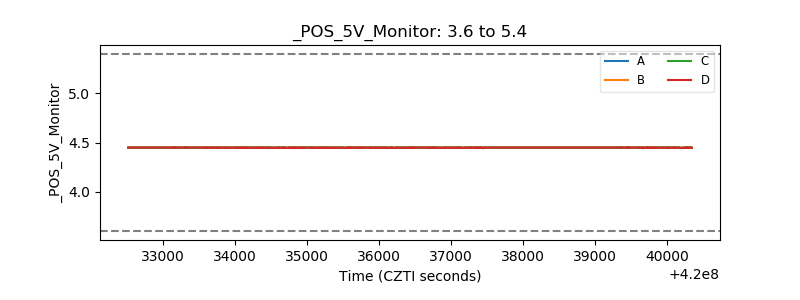 |
| _ROLL_ROT | 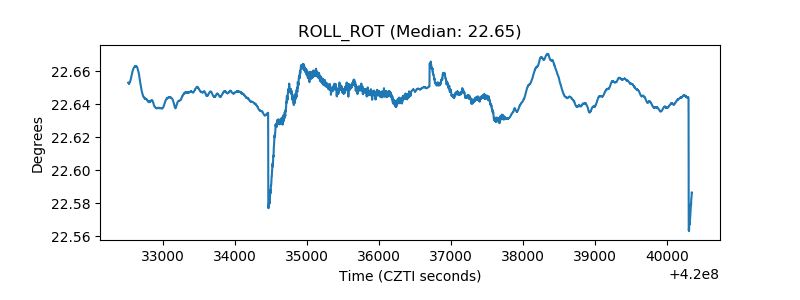 |
| _Roll_DEC | 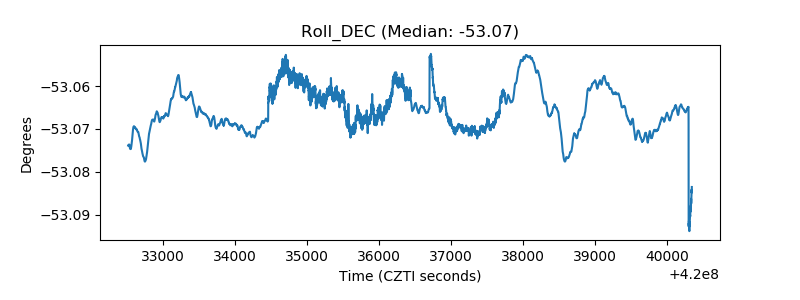 |
| _Roll_RA | 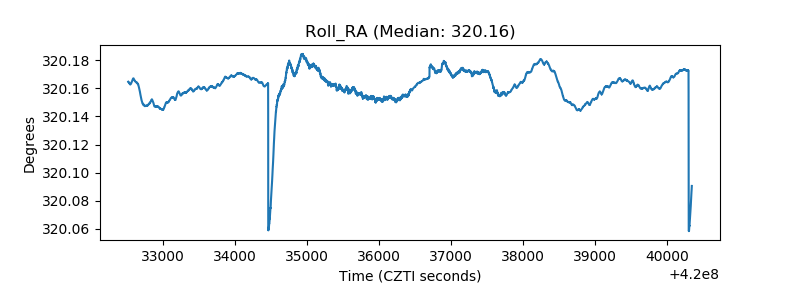 |
| Veto Counter | 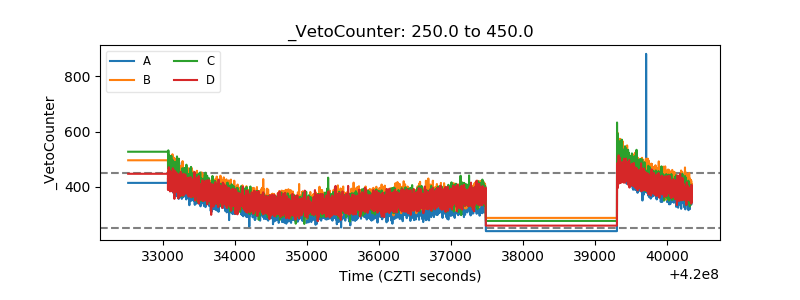 |