| Param | Original file | Final file |
|---|---|---|
| Filename | modeM0/AS1A12_052T04_9000005582_40937cztM0_level2.fits | modeM0/AS1A12_052T04_9000005582_40937cztM0_level2_quad_clean.evt |
| Size (bytes) | 343,172,160 | 91,707,840 |
| Size | 327.3 MB | 87.5 MB |
| Events in quadrant A | 2,873,803 | 629,090 |
| Events in quadrant B | 2,414,217 | 640,457 |
| Events in quadrant C | 3,246,429 | 592,436 |
| Events in quadrant D | 3,755,266 | 542,866 |
| Mode M9 | |||
|---|---|---|---|
| Quadrant | BADHDUFLAG | Total packets | Discarded packets |
| A | 0 | 22 | 0 |
| B | 0 | 22 | 0 |
| C | 0 | 22 | 0 |
| D | 0 | 23 | 0 |
| Mode SS | |||
|---|---|---|---|
| Quadrant | BADHDUFLAG | Total packets | Discarded packets |
| A | 0 | 110 | 0 |
| B | 0 | 110 | 0 |
| C | 0 | 110 | 0 |
| D | 0 | 110 | 0 |
| Mode M0 | |||
|---|---|---|---|
| Quadrant | BADHDUFLAG | Total packets | Discarded packets |
| A | 0 | 11732 | 3 |
| B | 0 | 10829 | 2 |
| C | 0 | 13019 | 2 |
| D | 0 | 14806 | 2 |
| Quadrant | Total seconds | Saturated seconds | Saturation percentage |
|---|---|---|---|
| A | 5308 | 13 | 0.244913% |
| B | 5308 | 11 | 0.207234% |
| C | 5308 | 136 | 2.562170% |
| D | 5308 | 270 | 5.086662% |
Noise dominated data is calculated using 1-second bins in cleaned event files. If a bin has >2000 counts, and if more than 50% of those come from <1% of pixels, then it is considered to be noise-dominated and hence unusable.
| Quadrant | # 1 sec bins | Bins with >0 counts | Bins with >2000 counts | High rate bins dominated by noise | Noise dominated (total time) | Noise dominated (detector-on time) | Marked lightcurve |
|---|---|---|---|---|---|---|---|
| A | 7250 | 5309 | 3 | 3 | 0.04% | 0.06% | 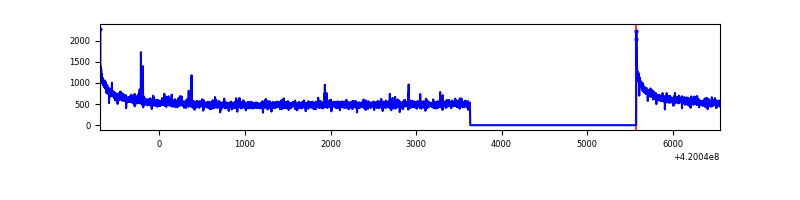 |
| B | 7250 | 5309 | 4 | 4 | 0.06% | 0.08% | 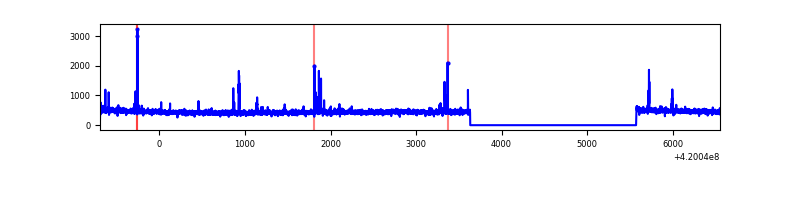 |
| C | 7250 | 5309 | 124 | 124 | 1.71% | 2.34% | 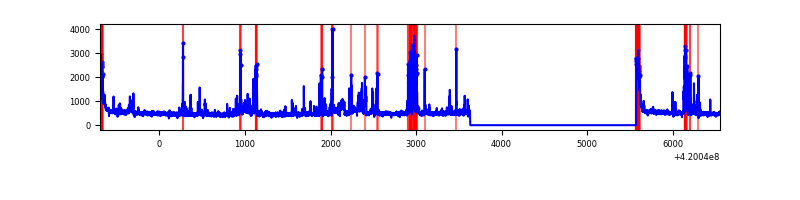 |
| D | 7250 | 5309 | 246 | 246 | 3.39% | 4.63% | 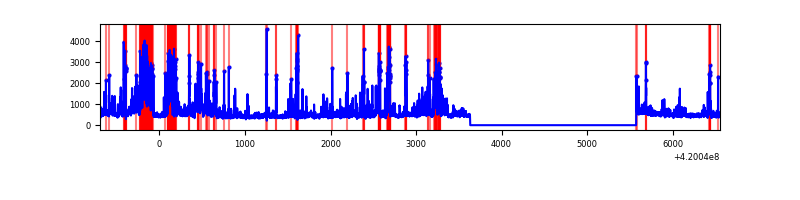 |
Top three noisy pixels from each quadrant. If the there are fewer than three noisy pixels in the level2.evt file, extra rows are filled as -1
| Pixel properties | Quadrant properties | ||||||
|---|---|---|---|---|---|---|---|
| Quadrant | DetID | PixID | Counts | Sigma | Mean | Median | Sigma |
| A | 10 | 83 | 509798 | 4159.18 | 602 | 590 | 122.4 |
| A | 2 | 79 | 19769 | 156.65 | 602 | 590 | 122.4 |
| A | 7 | 3 | 11607 | 89.99 | 602 | 590 | 122.4 |
| B | 5 | 255 | 76836 | 660.86 | 594 | 577 | 115.4 |
| B | 12 | 111 | 13908 | 115.53 | 594 | 577 | 115.4 |
| B | 11 | 111 | 13123 | 108.72 | 594 | 577 | 115.4 |
| C | 14 | 254 | 585227 | 4438.69 | 571 | 575 | 131.7 |
| C | 15 | 214 | 244887 | 1854.82 | 571 | 575 | 131.7 |
| C | 0 | 10 | 177745 | 1345.08 | 571 | 575 | 131.7 |
| D | 13 | 249 | 405379 | 2887.91 | 570 | 553 | 140.2 |
| D | 13 | 171 | 329472 | 2346.41 | 570 | 553 | 140.2 |
| D | 12 | 233 | 291762 | 2077.4 | 570 | 553 | 140.2 |
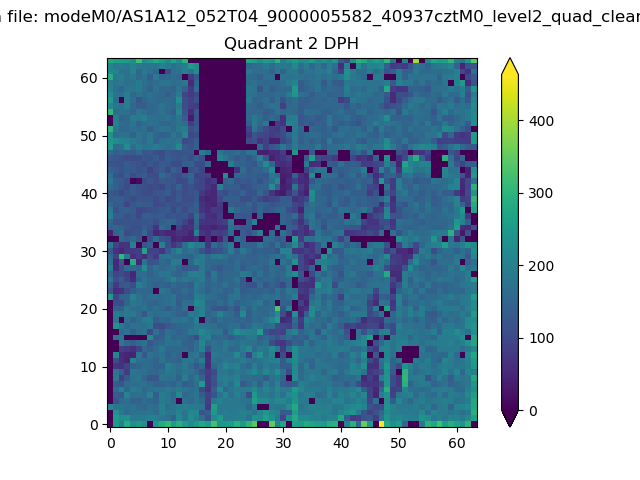
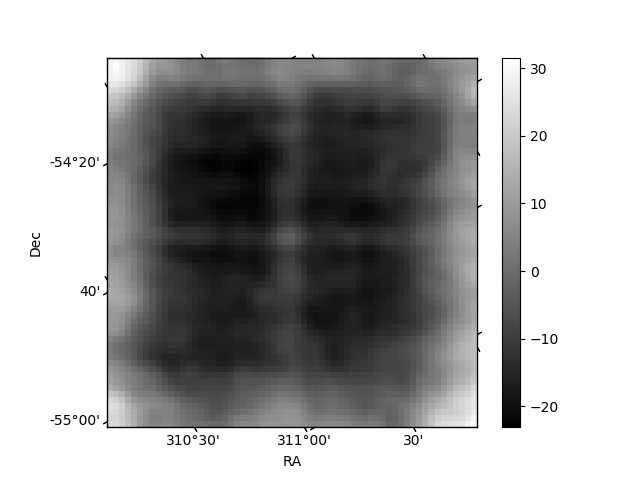
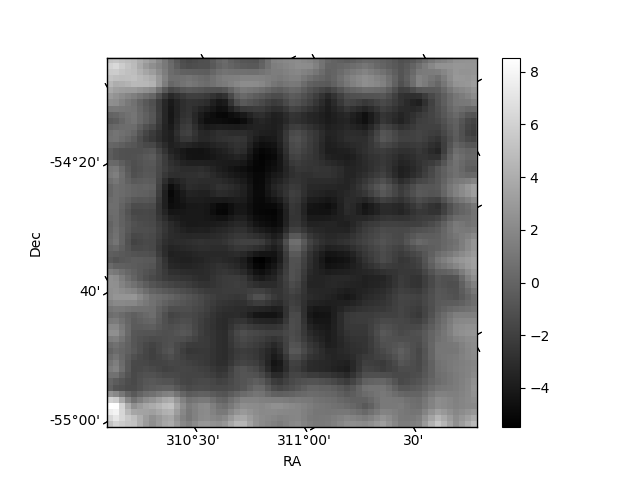
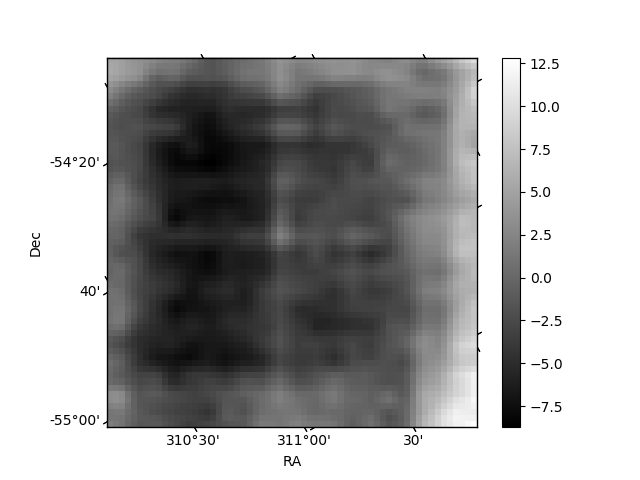
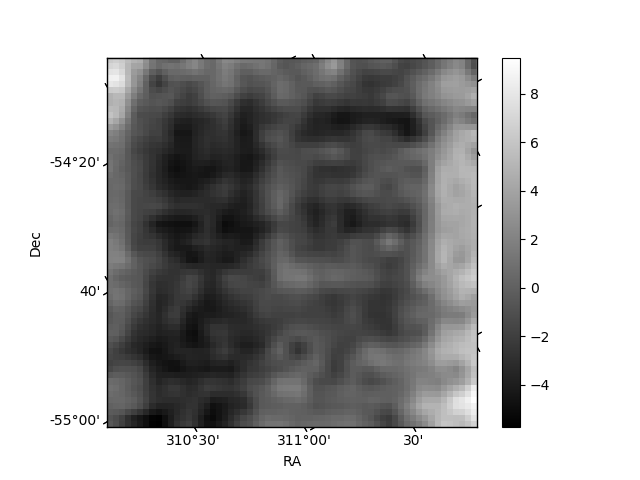
Histogram calculated using DETX and DETY for each event in the final _common_clean file
| Quadrant A | 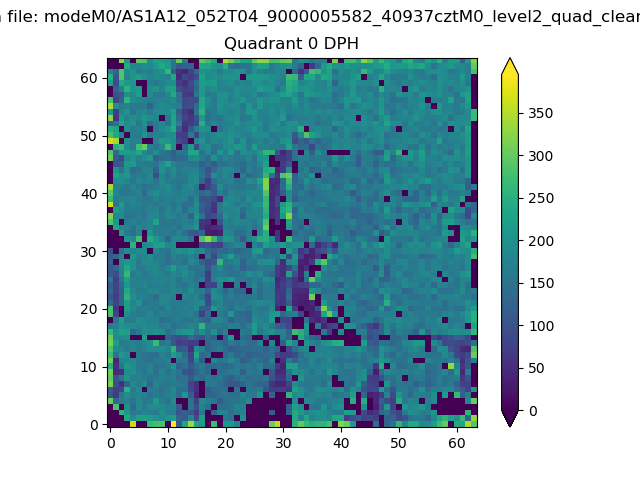 |
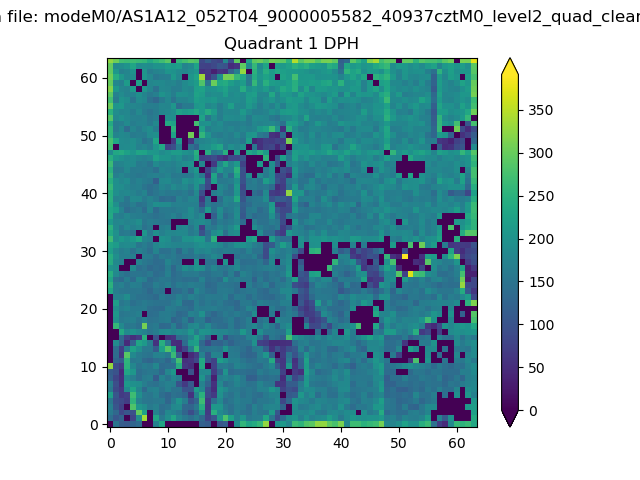 |
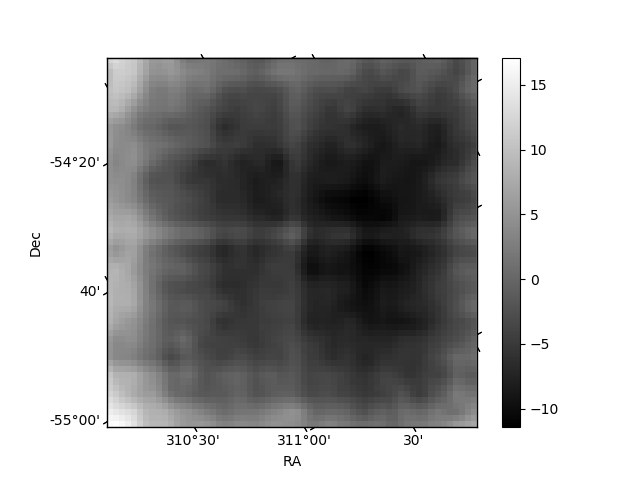
Quadrant B |
|---|---|---|---|
| Quadrant D | 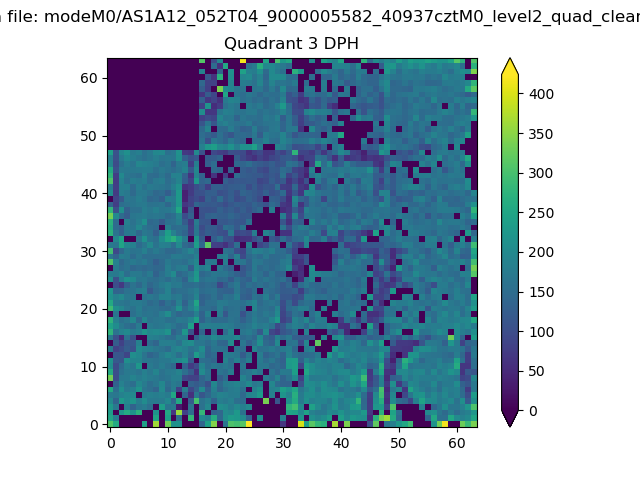 |
 |
Quadrant C |
| Plot type | Count rate plots | Images |
|---|---|---|
| Comparison with Poisson distribution Blue bars denote a histogram of data divided into 1 sec bins. Red curve is a Poisson curve with rate = median count rate of data. |
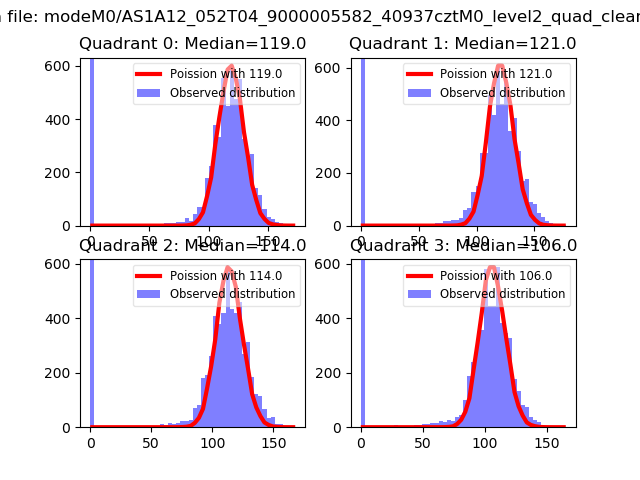 |
 |
| Quadrant-wise count rates Data is divided into 100 sec bins |
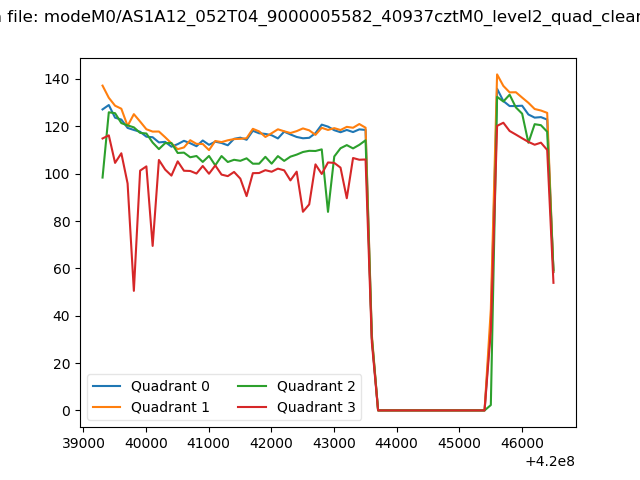 |
|
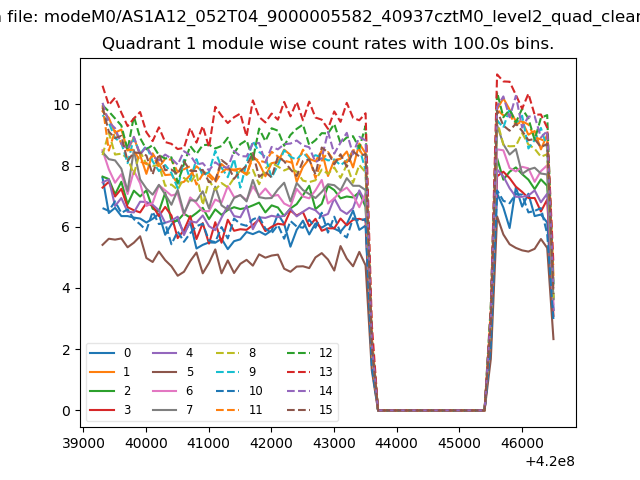
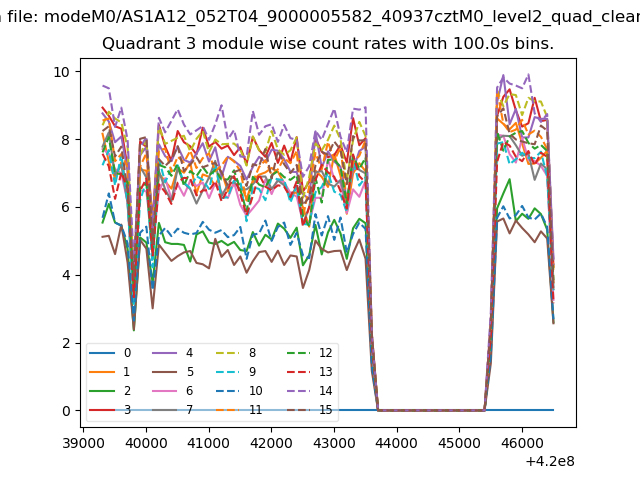
| Module-wise count rates for Quadrant A Data is divided into 100 sec bins |
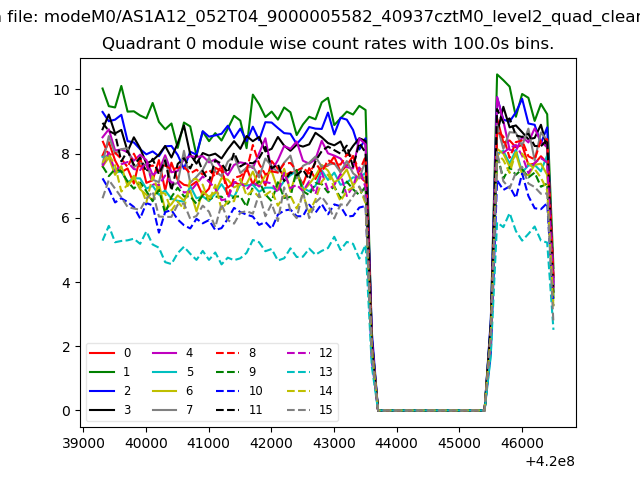 |
 |
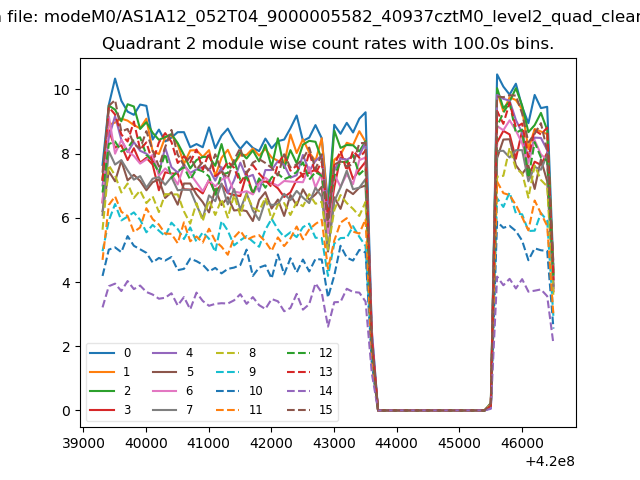
| Module-wise count rates for Quadrant B Data is divided into 100 sec bins |
 |
 |
| Module-wise count rates for Quadrant C Data is divided into 100 sec bins |
 |
 |
| Module-wise count rates for Quadrant D Data is divided into 100 sec bins |
 |
 |
| Parameter | Plot |
|---|---|
| CZT HV Monitor | 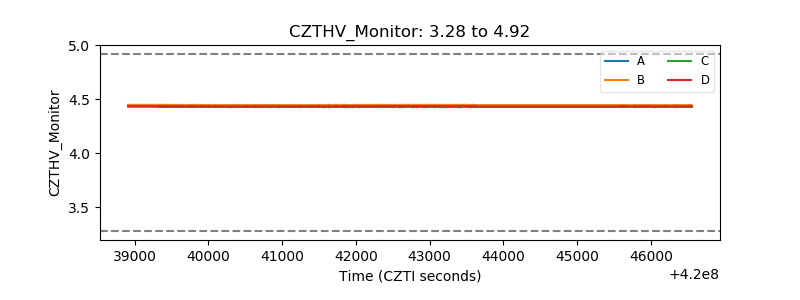 |
| D_VDD | 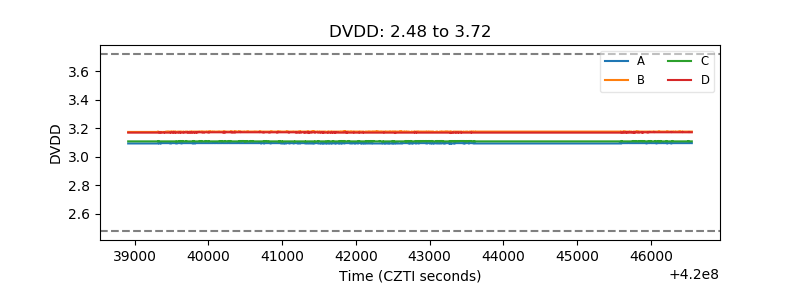 |
| Temperature 1 | 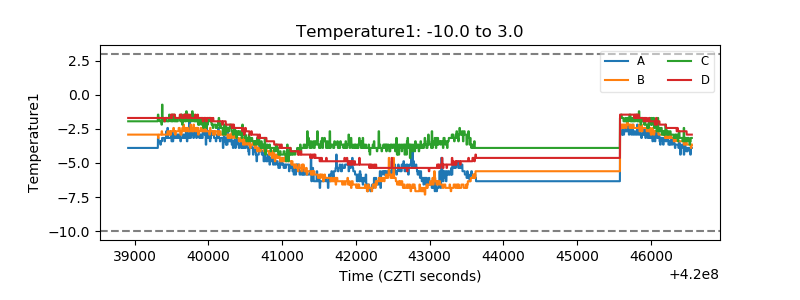 |
| Veto HV Monitor | 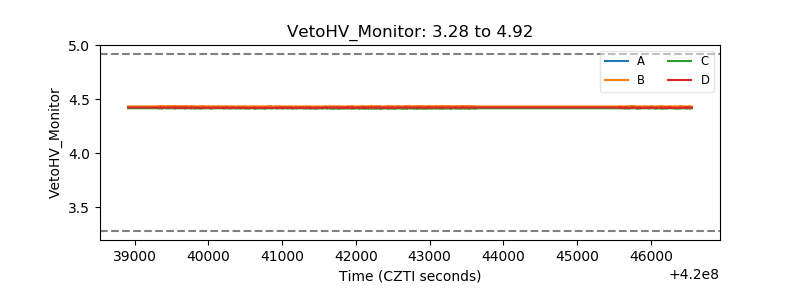 |
| Veto LLD | 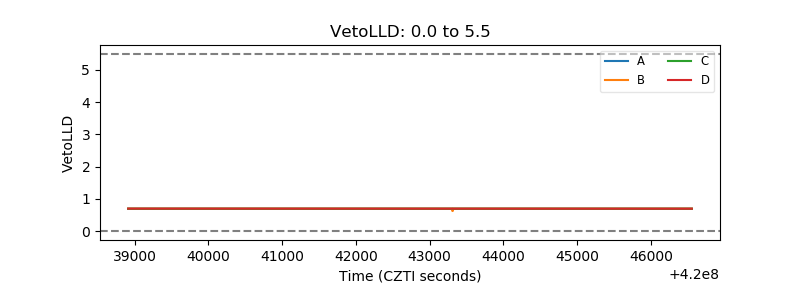 |
| Alpha Counter | 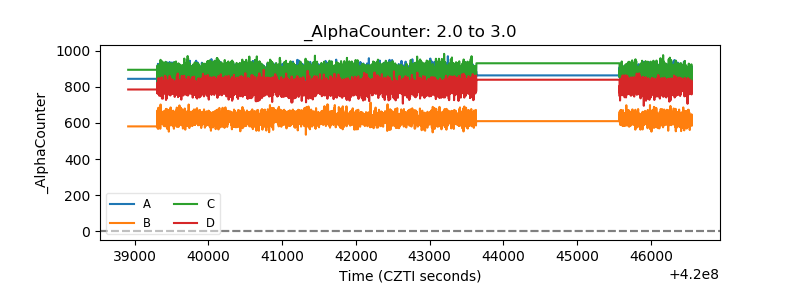 |
| _CPM_Rate | 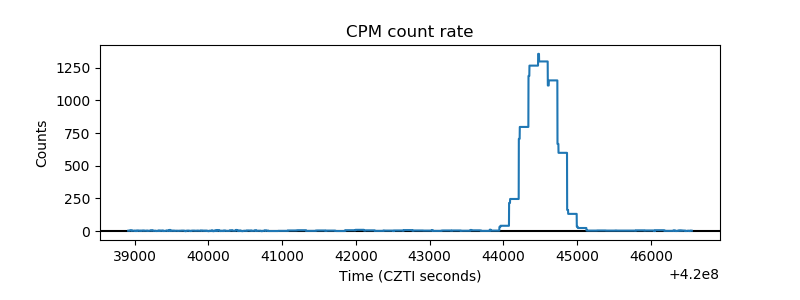 |
| CZT Counter | 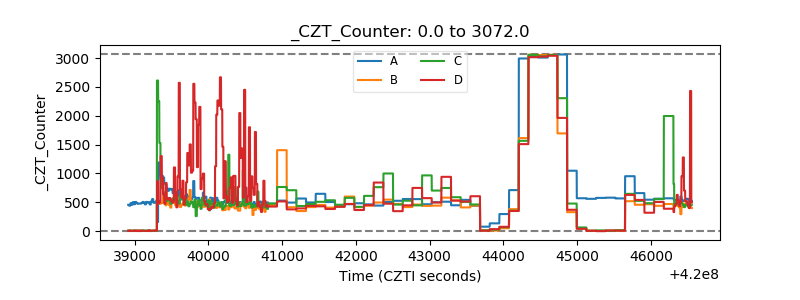 |
| +2.5 Volts monitor | 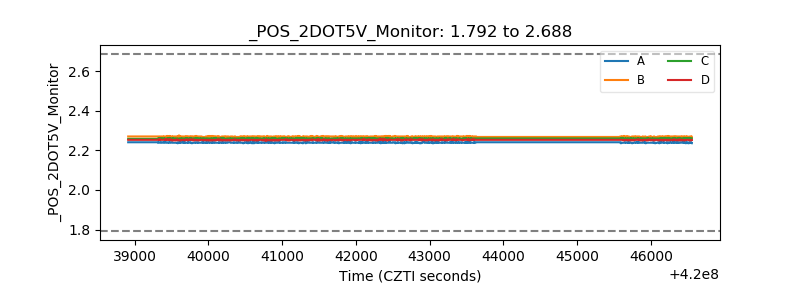 |
| +5 Volts monitor | 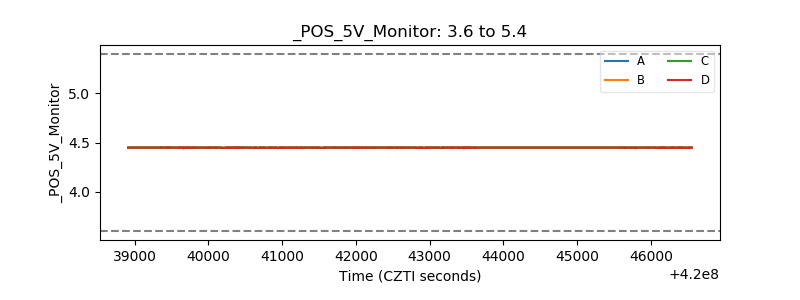 |
| _ROLL_ROT | 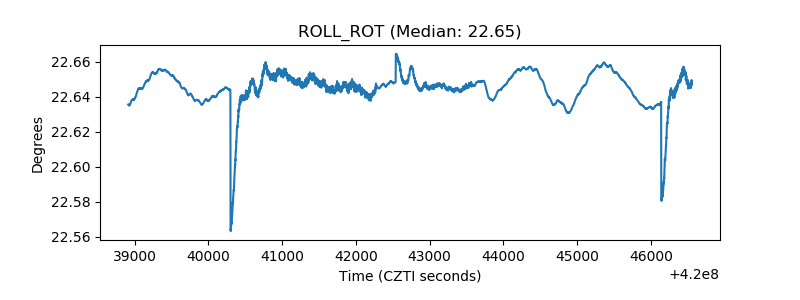 |
| _Roll_DEC | 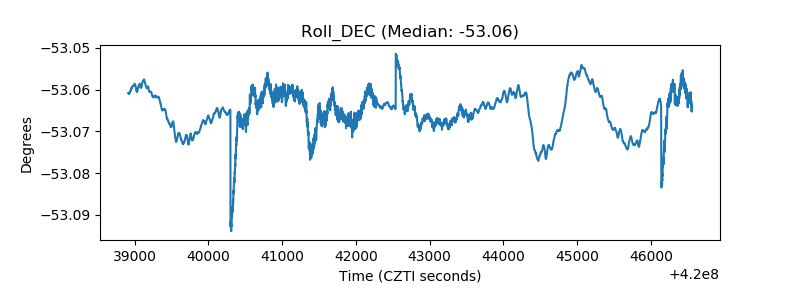 |
| _Roll_RA | 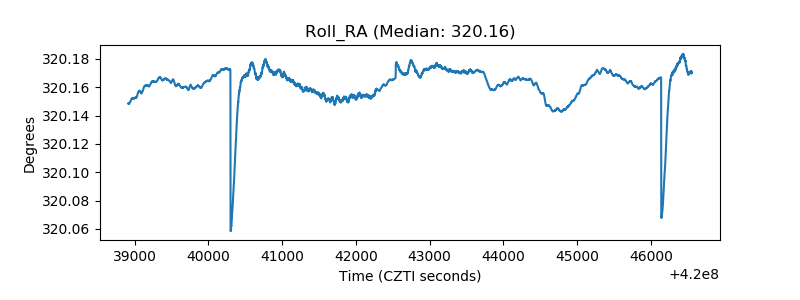 |
| Veto Counter | 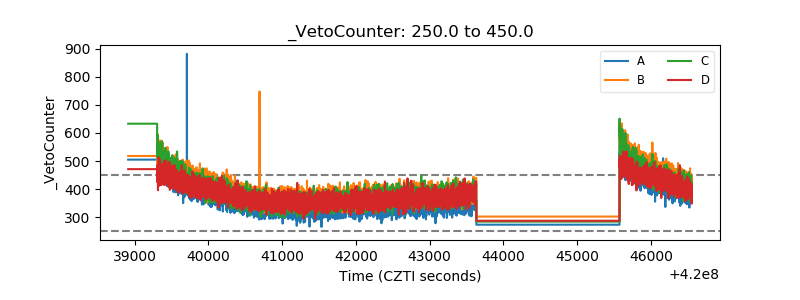 |