| Param | Original file | Final file |
|---|---|---|
| Filename | modeM0/AS1A12_052T04_9000005582_40938cztM0_level2.fits | modeM0/AS1A12_052T04_9000005582_40938cztM0_level2_quad_clean.evt |
| Size (bytes) | 318,533,760 | 88,767,360 |
| Size | 303.8 MB | 84.7 MB |
| Events in quadrant A | 2,746,870 | 615,280 |
| Events in quadrant B | 2,351,016 | 627,150 |
| Events in quadrant C | 2,979,759 | 570,948 |
| Events in quadrant D | 3,323,728 | 524,022 |
| Mode M9 | |||
|---|---|---|---|
| Quadrant | BADHDUFLAG | Total packets | Discarded packets |
| A | 0 | 25 | 0 |
| B | 0 | 25 | 0 |
| C | 0 | 25 | 0 |
| D | 0 | 26 | 0 |
| Mode SS | |||
|---|---|---|---|
| Quadrant | BADHDUFLAG | Total packets | Discarded packets |
| A | 0 | 102 | 0 |
| B | 0 | 102 | 0 |
| C | 0 | 102 | 0 |
| D | 0 | 102 | 0 |
| Mode M0 | |||
|---|---|---|---|
| Quadrant | BADHDUFLAG | Total packets | Discarded packets |
| A | 0 | 11156 | 3 |
| B | 0 | 10312 | 2 |
| C | 0 | 11874 | 2 |
| D | 0 | 13208 | 2 |
| Quadrant | Total seconds | Saturated seconds | Saturation percentage |
|---|---|---|---|
| A | 5000 | 18 | 0.360000% |
| B | 5000 | 19 | 0.380000% |
| C | 5000 | 166 | 3.320000% |
| D | 5000 | 269 | 5.380000% |
Noise dominated data is calculated using 1-second bins in cleaned event files. If a bin has >2000 counts, and if more than 50% of those come from <1% of pixels, then it is considered to be noise-dominated and hence unusable.
| Quadrant | # 1 sec bins | Bins with >0 counts | Bins with >2000 counts | High rate bins dominated by noise | Noise dominated (total time) | Noise dominated (detector-on time) | Marked lightcurve |
|---|---|---|---|---|---|---|---|
| A | 7063 | 5001 | 4 | 4 | 0.06% | 0.08% | 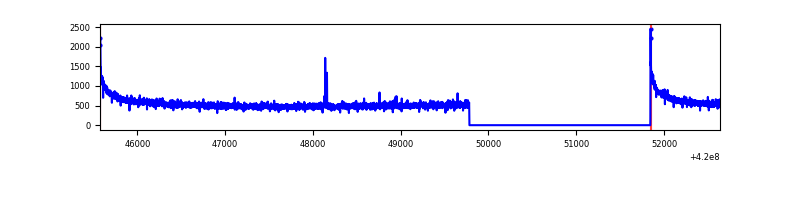 |
| B | 7063 | 5001 | 7 | 7 | 0.10% | 0.14% | 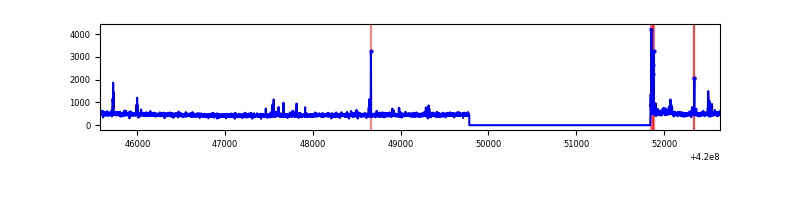 |
| C | 7063 | 5001 | 150 | 150 | 2.12% | 3.00% | 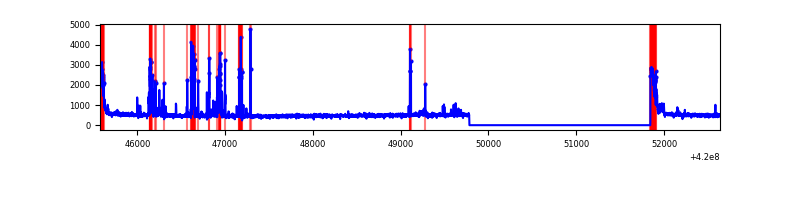 |
| D | 7063 | 5001 | 255 | 255 | 3.61% | 5.10% | 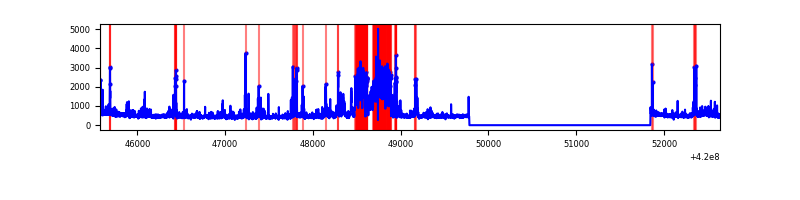 |
Top three noisy pixels from each quadrant. If the there are fewer than three noisy pixels in the level2.evt file, extra rows are filled as -1
| Pixel properties | Quadrant properties | ||||||
|---|---|---|---|---|---|---|---|
| Quadrant | DetID | PixID | Counts | Sigma | Mean | Median | Sigma |
| A | 10 | 83 | 492959 | 4185.83 | 577 | 565 | 117.6 |
| A | 13 | 6 | 10397 | 83.58 | 577 | 565 | 117.6 |
| A | 7 | 3 | 10118 | 81.21 | 577 | 565 | 117.6 |
| B | 5 | 255 | 62963 | 571.66 | 573 | 558 | 109.2 |
| B | 0 | 186 | 34600 | 311.84 | 573 | 558 | 109.2 |
| B | 12 | 111 | 13361 | 117.28 | 573 | 558 | 109.2 |
| C | 14 | 254 | 310695 | 2469.65 | 546 | 551 | 125.6 |
| C | 0 | 10 | 238067 | 1891.32 | 546 | 551 | 125.6 |
| C | 15 | 214 | 230650 | 1832.26 | 546 | 551 | 125.6 |
| D | 13 | 249 | 817855 | 6116.15 | 549 | 534 | 133.6 |
| D | 2 | 249 | 107574 | 801.0 | 549 | 534 | 133.6 |
| D | 1 | 52 | 97497 | 725.59 | 549 | 534 | 133.6 |
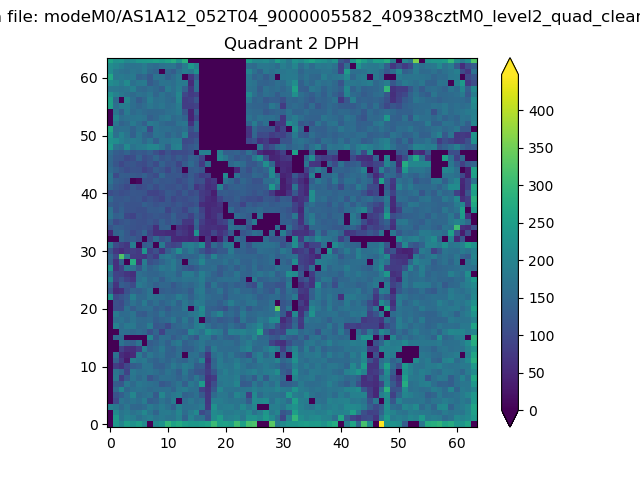
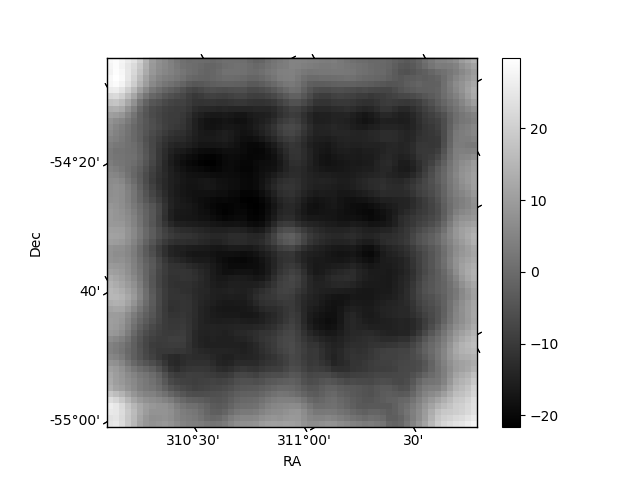
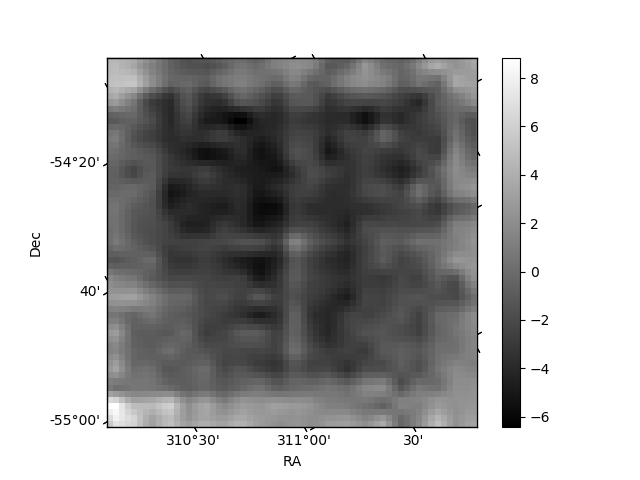
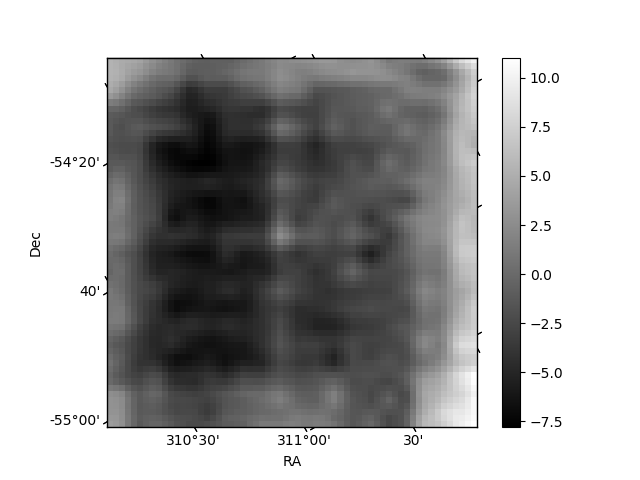
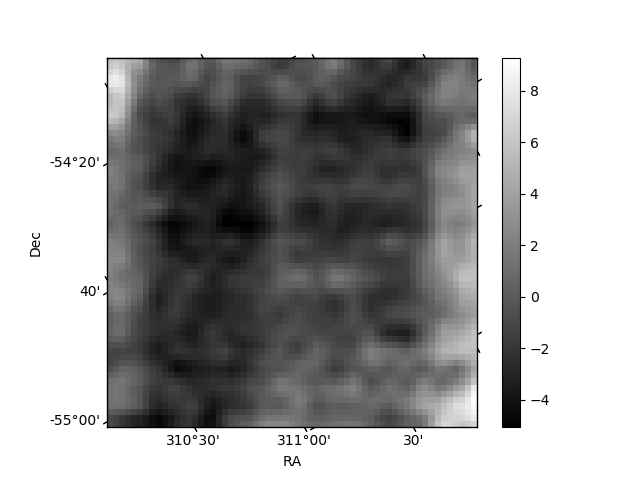
Histogram calculated using DETX and DETY for each event in the final _common_clean file
| Quadrant A | 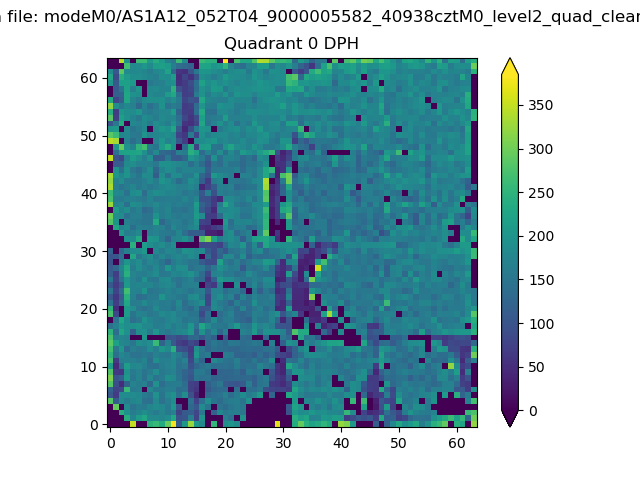 |
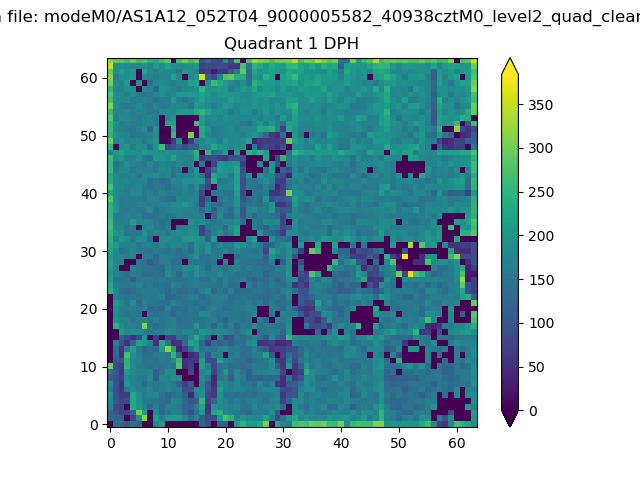 |
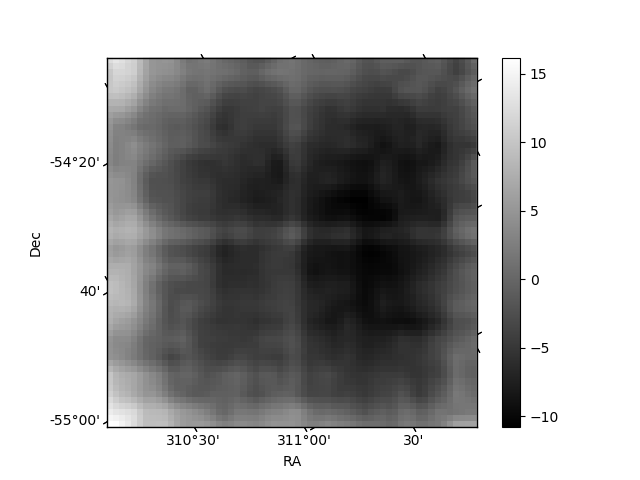
Quadrant B |
|---|---|---|---|
| Quadrant D | 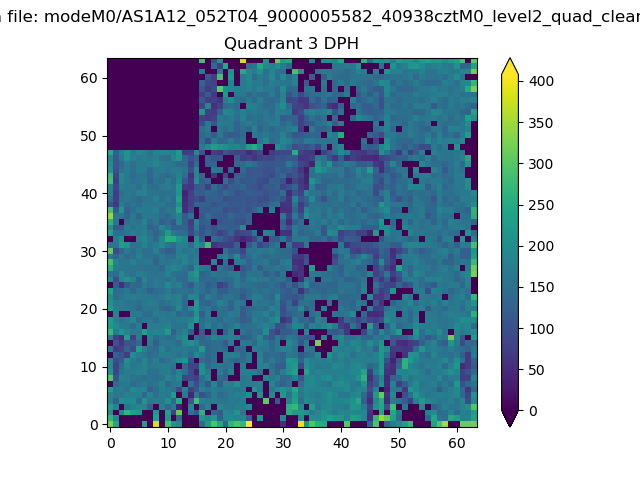 |
 |
Quadrant C |
| Plot type | Count rate plots | Images |
|---|---|---|
| Comparison with Poisson distribution Blue bars denote a histogram of data divided into 1 sec bins. Red curve is a Poisson curve with rate = median count rate of data. |
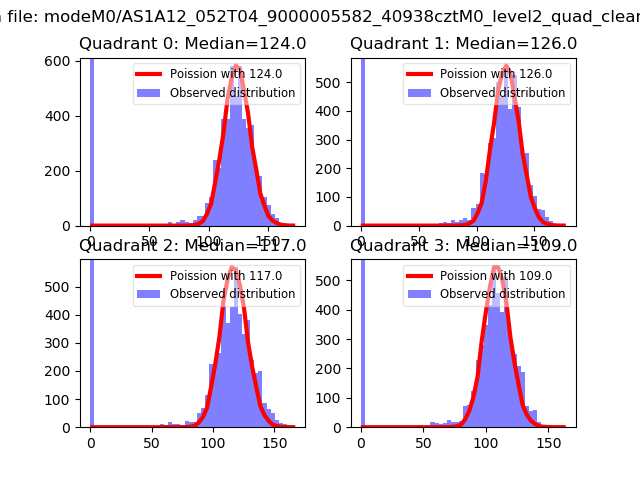 |
 |
| Quadrant-wise count rates Data is divided into 100 sec bins |
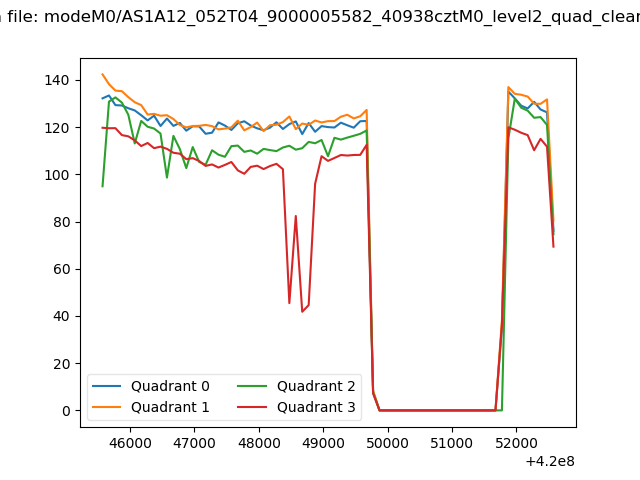 |
|
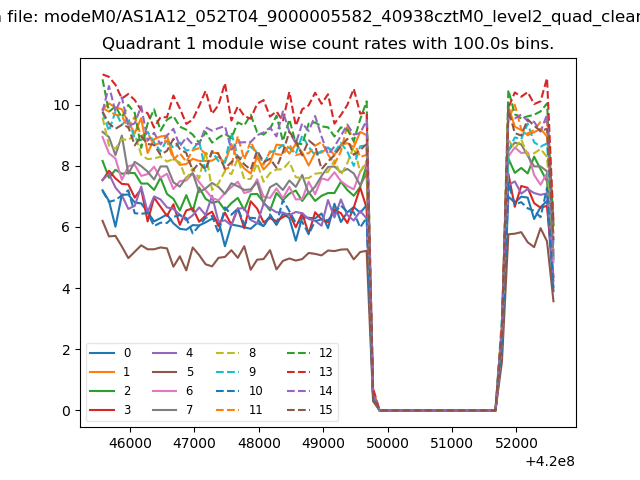
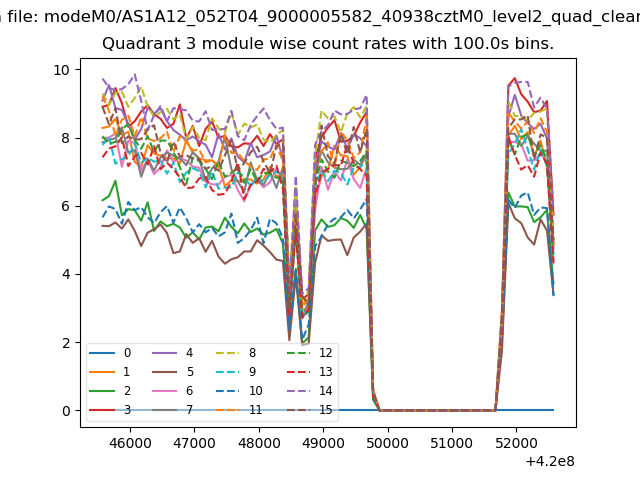
| Module-wise count rates for Quadrant A Data is divided into 100 sec bins |
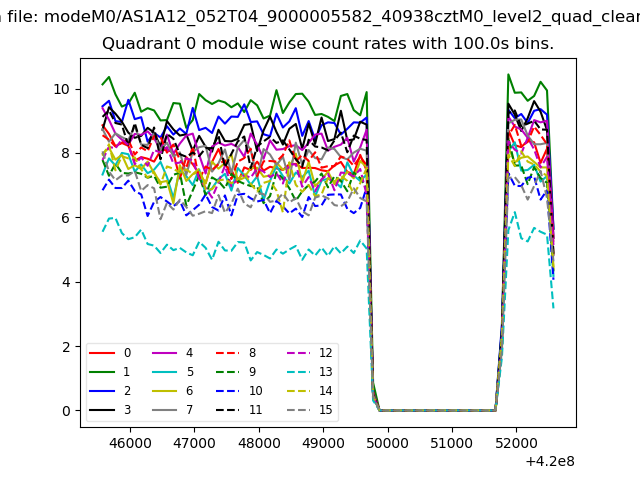 |
 |
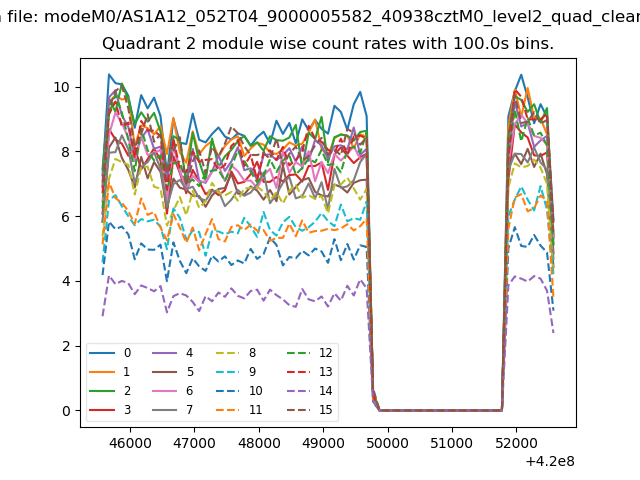
| Module-wise count rates for Quadrant B Data is divided into 100 sec bins |
 |
 |
| Module-wise count rates for Quadrant C Data is divided into 100 sec bins |
 |
 |
| Module-wise count rates for Quadrant D Data is divided into 100 sec bins |
 |
 |
| Parameter | Plot |
|---|---|
| CZT HV Monitor | 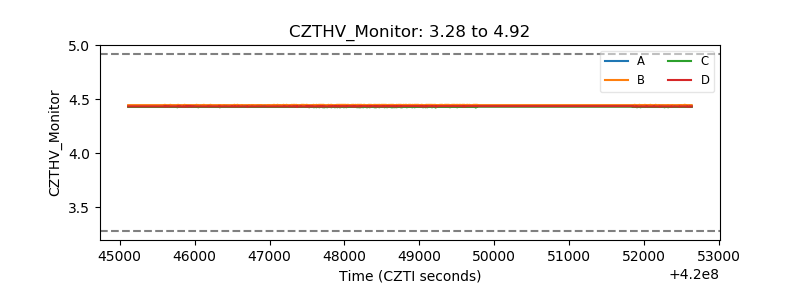 |
| D_VDD | 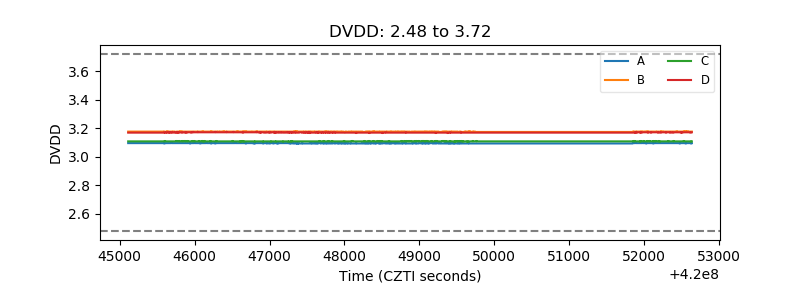 |
| Temperature 1 | 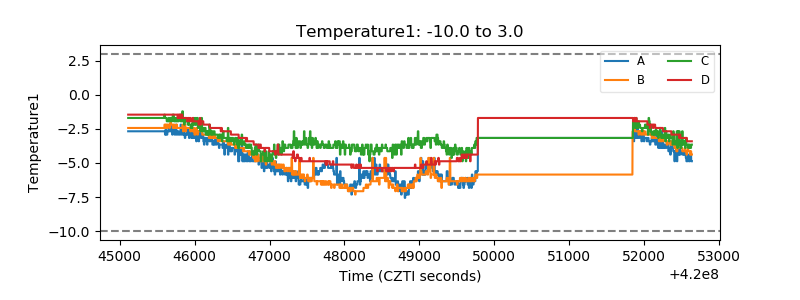 |
| Veto HV Monitor | 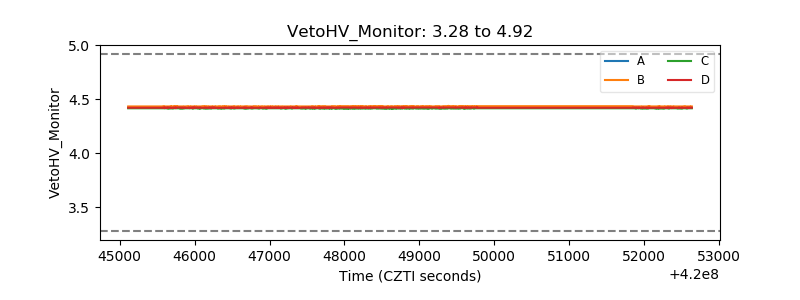 |
| Veto LLD | 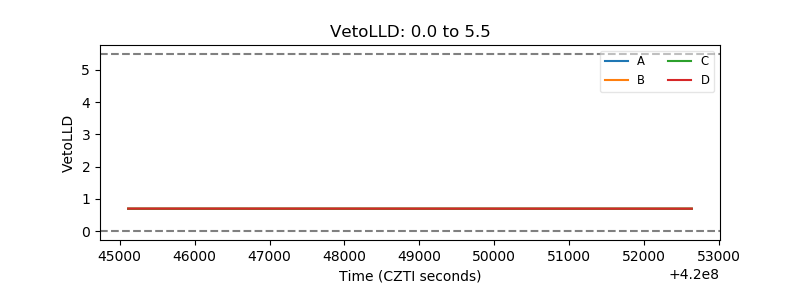 |
| Alpha Counter | 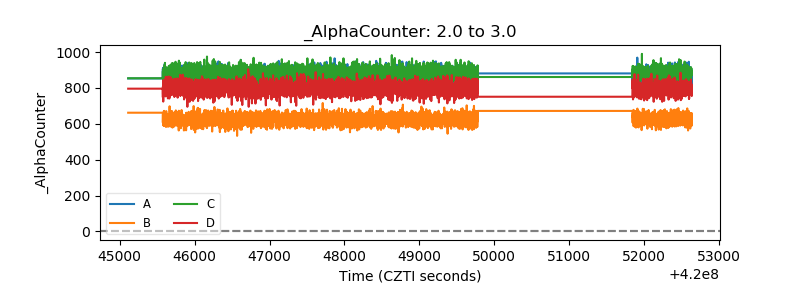 |
| _CPM_Rate | 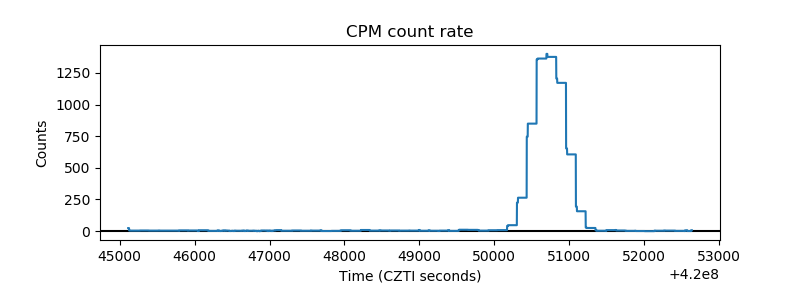 |
| CZT Counter | 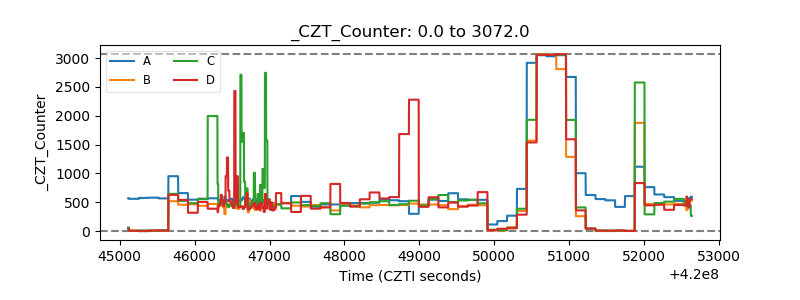 |
| +2.5 Volts monitor | 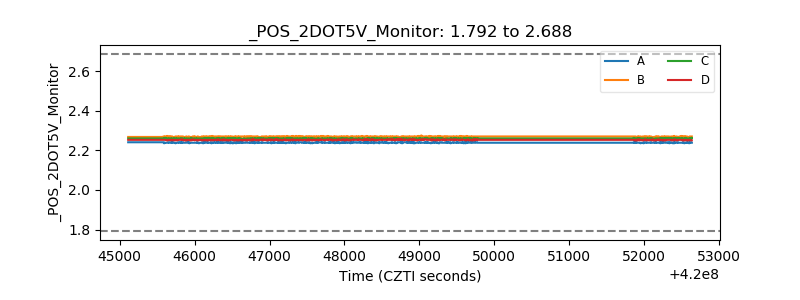 |
| +5 Volts monitor | 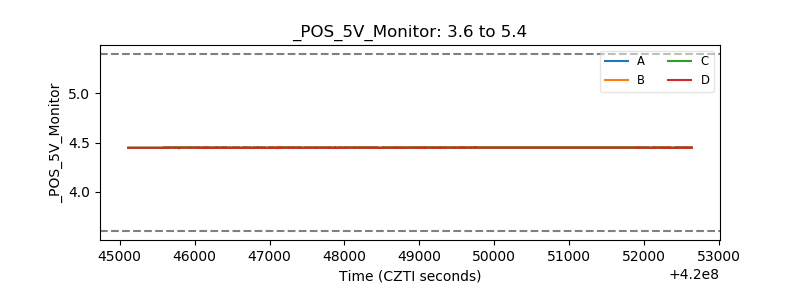 |
| _ROLL_ROT | 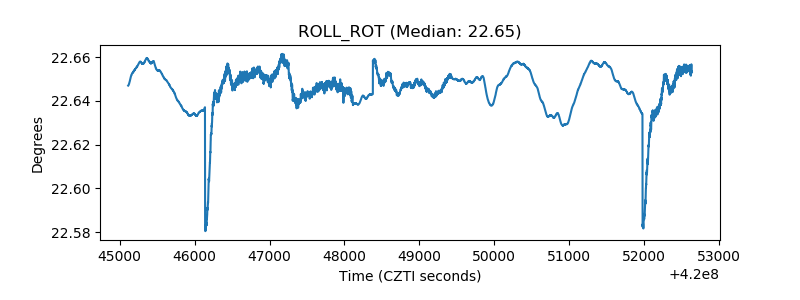 |
| _Roll_DEC | 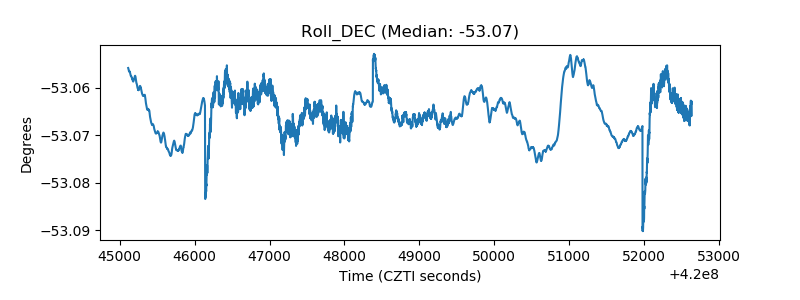 |
| _Roll_RA | 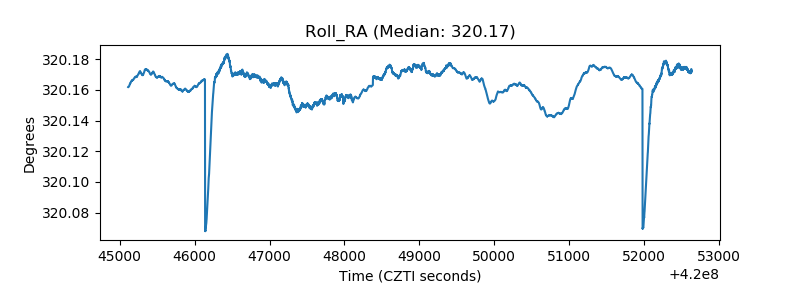 |
| Veto Counter | 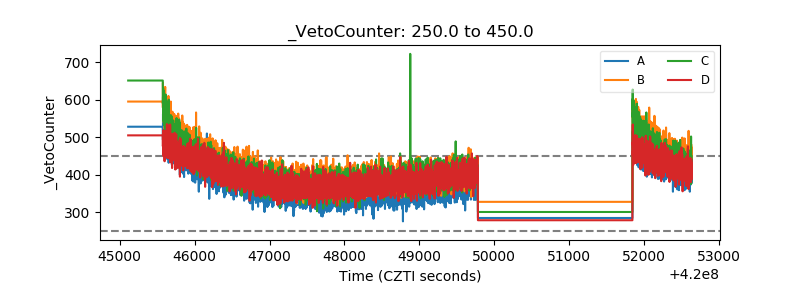 |