| Param | Original file | Final file |
|---|---|---|
| Filename | modeM0/AS1A12_052T04_9000005582_40939cztM0_level2.fits | modeM0/AS1A12_052T04_9000005582_40939cztM0_level2_quad_clean.evt |
| Size (bytes) | 284,817,600 | 87,840,000 |
| Size | 271.6 MB | 83.8 MB |
| Events in quadrant A | 2,677,697 | 604,307 |
| Events in quadrant B | 2,295,656 | 614,454 |
| Events in quadrant C | 2,656,953 | 564,326 |
| Events in quadrant D | 2,529,733 | 533,011 |
| Mode M9 | |||
|---|---|---|---|
| Quadrant | BADHDUFLAG | Total packets | Discarded packets |
| A | 0 | 35 | 0 |
| B | 0 | 35 | 0 |
| C | 0 | 35 | 0 |
| D | 0 | 36 | 0 |
| Mode SS | |||
|---|---|---|---|
| Quadrant | BADHDUFLAG | Total packets | Discarded packets |
| A | 0 | 98 | 0 |
| B | 0 | 98 | 0 |
| C | 0 | 98 | 0 |
| D | 0 | 98 | 0 |
| Mode M0 | |||
|---|---|---|---|
| Quadrant | BADHDUFLAG | Total packets | Discarded packets |
| A | 0 | 10882 | 3 |
| B | 0 | 10076 | 2 |
| C | 0 | 10839 | 2 |
| D | 0 | 10778 | 2 |
| Quadrant | Total seconds | Saturated seconds | Saturation percentage |
|---|---|---|---|
| A | 4910 | 15 | 0.305499% |
| B | 4910 | 18 | 0.366599% |
| C | 4910 | 80 | 1.629328% |
| D | 4910 | 27 | 0.549898% |
Noise dominated data is calculated using 1-second bins in cleaned event files. If a bin has >2000 counts, and if more than 50% of those come from <1% of pixels, then it is considered to be noise-dominated and hence unusable.
| Quadrant | # 1 sec bins | Bins with >0 counts | Bins with >2000 counts | High rate bins dominated by noise | Noise dominated (total time) | Noise dominated (detector-on time) | Marked lightcurve |
|---|---|---|---|---|---|---|---|
| A | 7033 | 4911 | 6 | 6 | 0.09% | 0.12% | 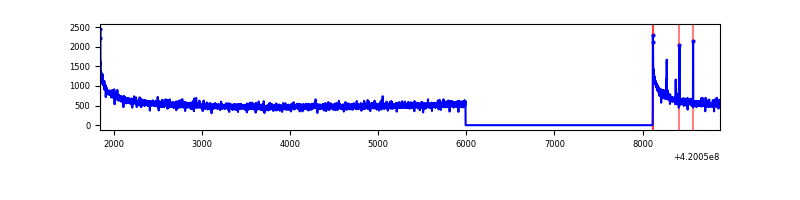 |
| B | 7033 | 4911 | 6 | 6 | 0.09% | 0.12% | 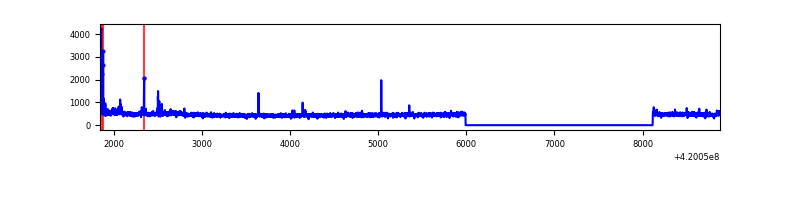 |
| C | 7033 | 4911 | 71 | 71 | 1.01% | 1.45% | 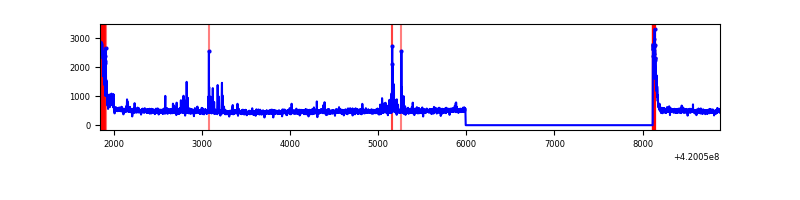 |
| D | 7033 | 4911 | 22 | 22 | 0.31% | 0.45% | 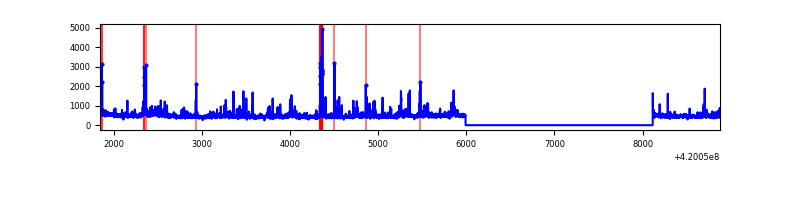 |
Top three noisy pixels from each quadrant. If the there are fewer than three noisy pixels in the level2.evt file, extra rows are filled as -1
| Pixel properties | Quadrant properties | ||||||
|---|---|---|---|---|---|---|---|
| Quadrant | DetID | PixID | Counts | Sigma | Mean | Median | Sigma |
| A | 10 | 83 | 486947 | 4272.66 | 560 | 549 | 113.8 |
| A | 13 | 248 | 12984 | 109.23 | 560 | 549 | 113.8 |
| A | 13 | 6 | 9967 | 82.73 | 560 | 549 | 113.8 |
| B | 5 | 255 | 37032 | 342.68 | 558 | 543 | 106.5 |
| B | 0 | 186 | 34668 | 320.48 | 558 | 543 | 106.5 |
| B | 0 | 229 | 23067 | 211.53 | 558 | 543 | 106.5 |
| C | 0 | 10 | 231593 | 1862.18 | 536 | 541 | 124.1 |
| C | 15 | 214 | 227653 | 1830.42 | 536 | 541 | 124.1 |
| C | 14 | 254 | 59924 | 478.6 | 536 | 541 | 124.1 |
| D | 2 | 249 | 118183 | 911.51 | 539 | 525 | 129.1 |
| D | 13 | 249 | 95701 | 737.34 | 539 | 525 | 129.1 |
| D | 1 | 47 | 70070 | 538.77 | 539 | 525 | 129.1 |
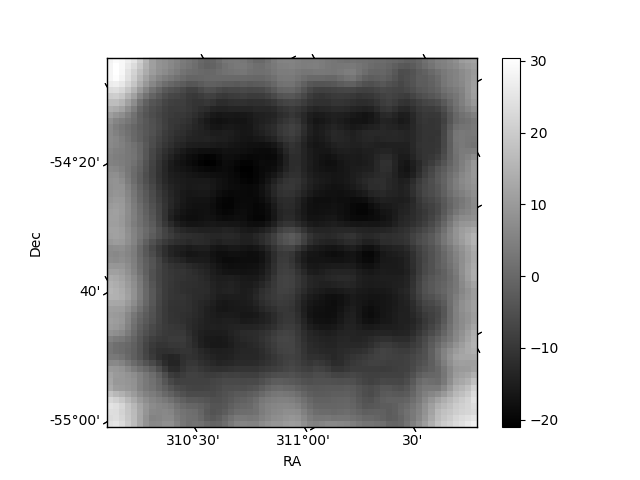
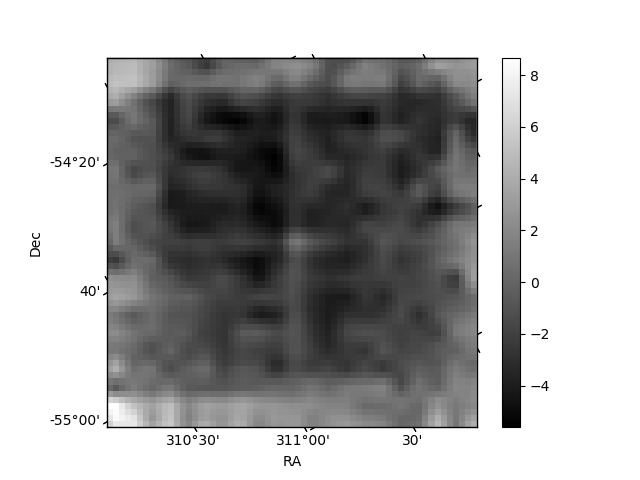
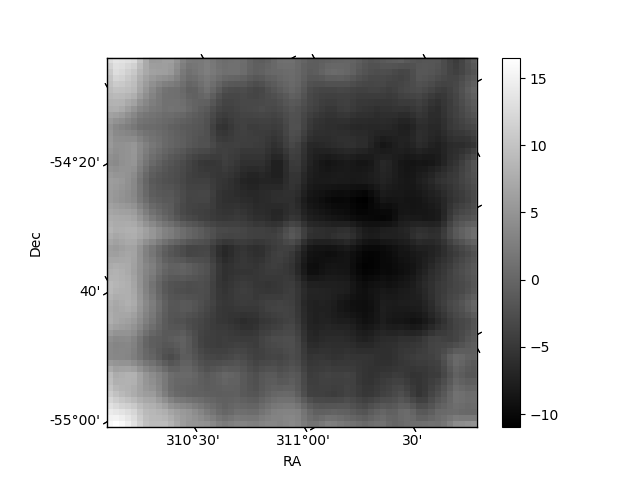
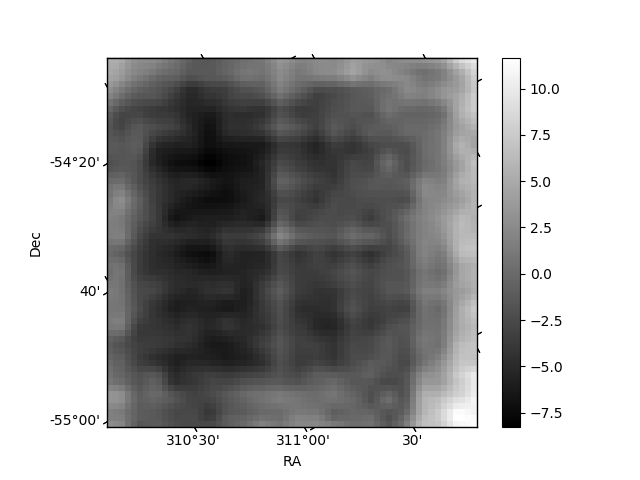
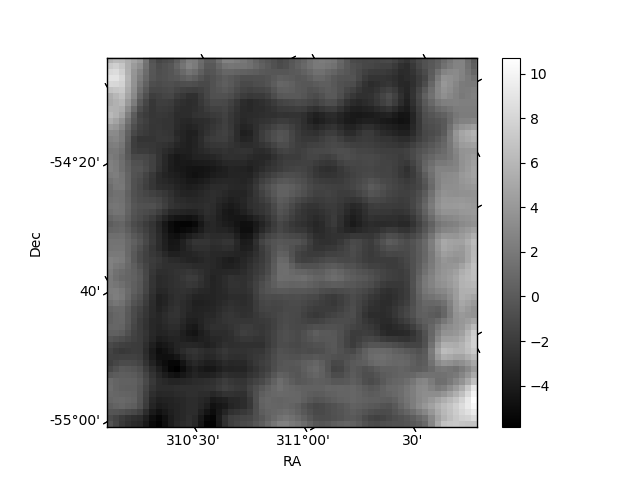
Histogram calculated using DETX and DETY for each event in the final _common_clean file
| Quadrant A | 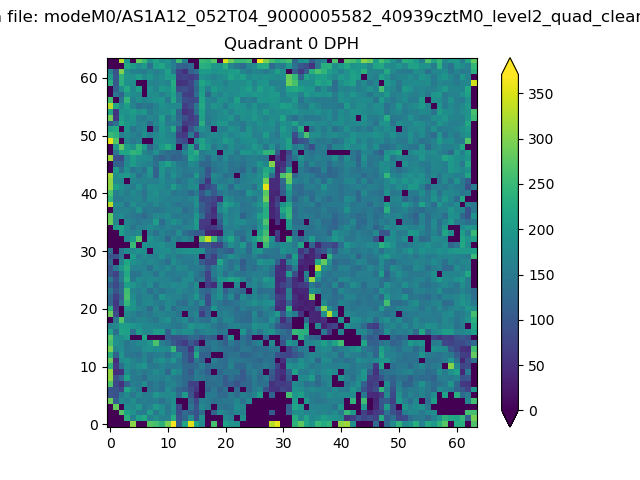 |
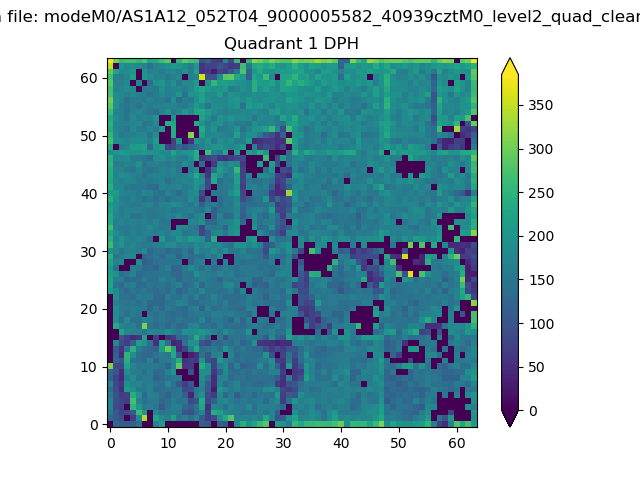 |
Quadrant B |
|---|---|---|---|
| Quadrant D | 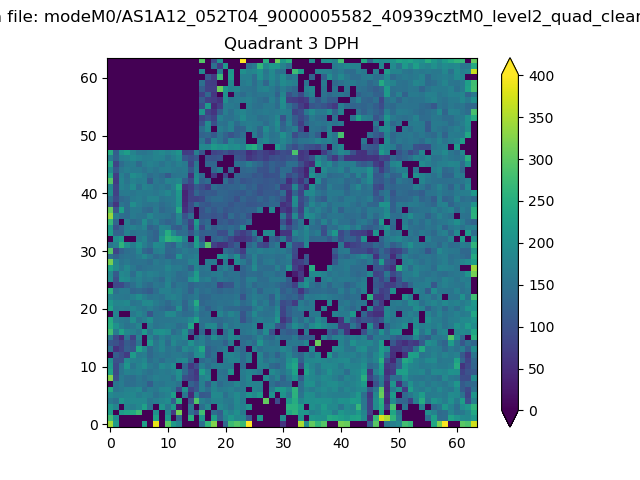 |
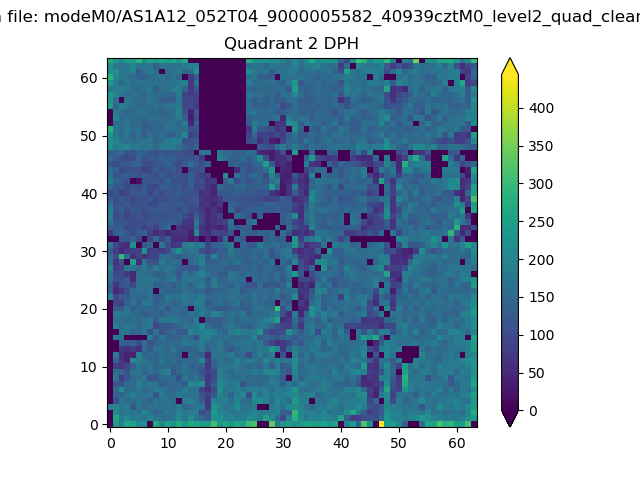 |
Quadrant C |
| Plot type | Count rate plots | Images |
|---|---|---|
| Comparison with Poisson distribution Blue bars denote a histogram of data divided into 1 sec bins. Red curve is a Poisson curve with rate = median count rate of data. |
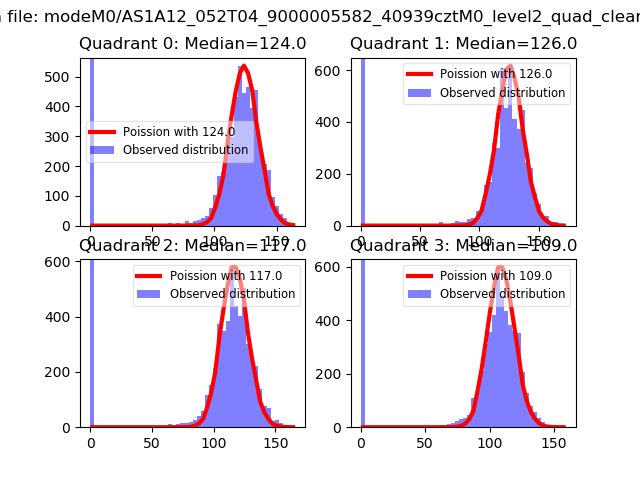 |
 |
| Quadrant-wise count rates Data is divided into 100 sec bins |
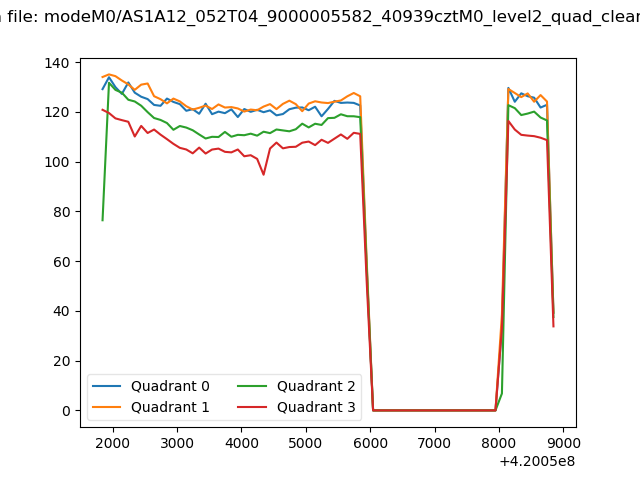 |
|
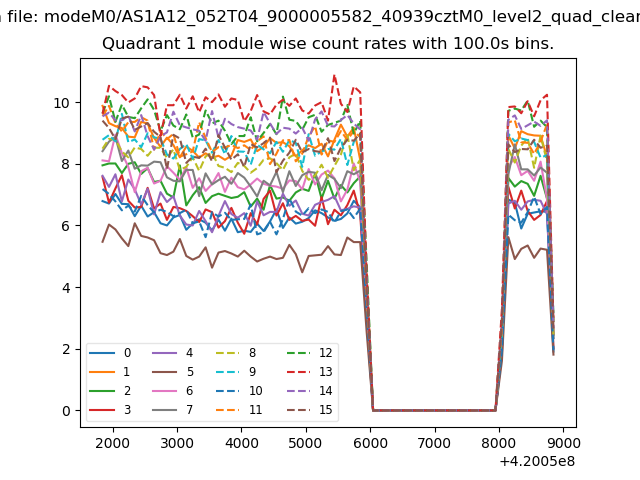
| Module-wise count rates for Quadrant A Data is divided into 100 sec bins |
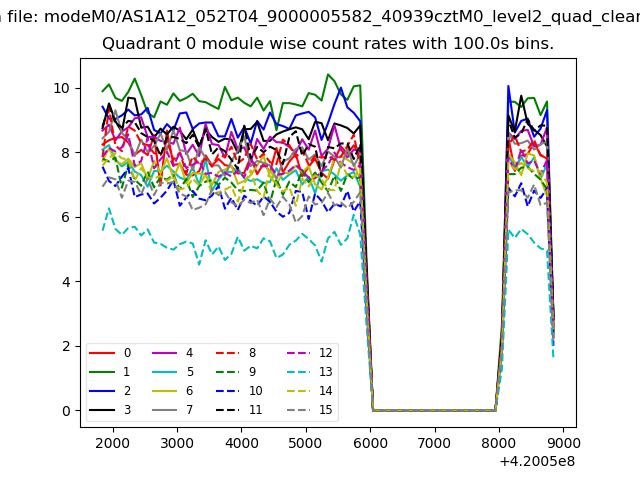 |
 |
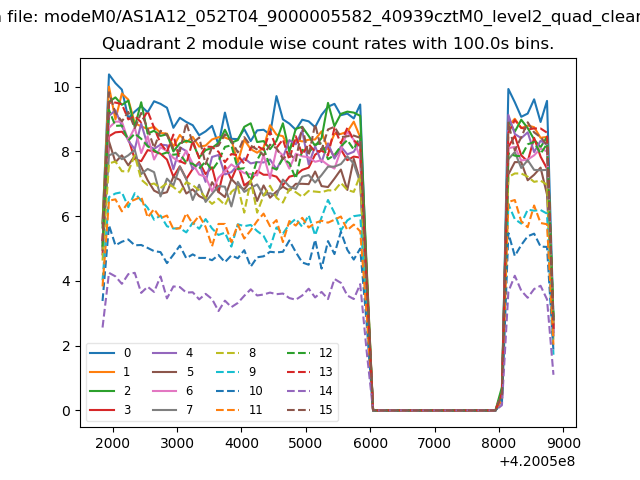
| Module-wise count rates for Quadrant B Data is divided into 100 sec bins |
 |
 |
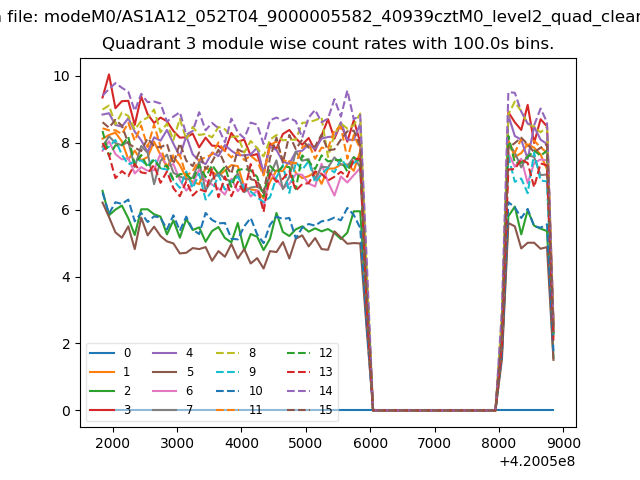
| Module-wise count rates for Quadrant C Data is divided into 100 sec bins |
 |
 |
| Module-wise count rates for Quadrant D Data is divided into 100 sec bins |
 |
 |
| Parameter | Plot |
|---|---|
| CZT HV Monitor | 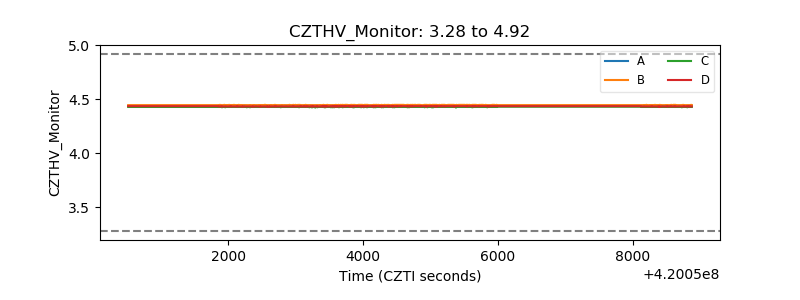 |
| D_VDD | 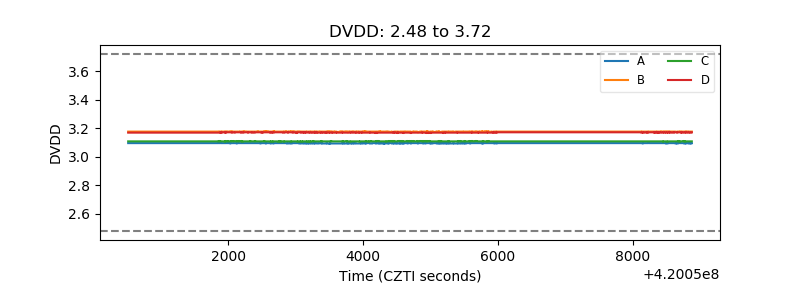 |
| Temperature 1 | 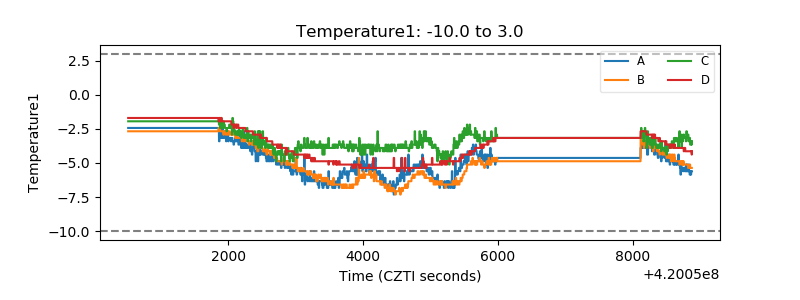 |
| Veto HV Monitor | 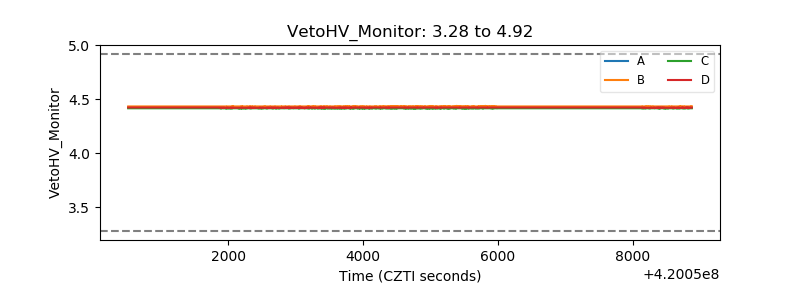 |
| Veto LLD | 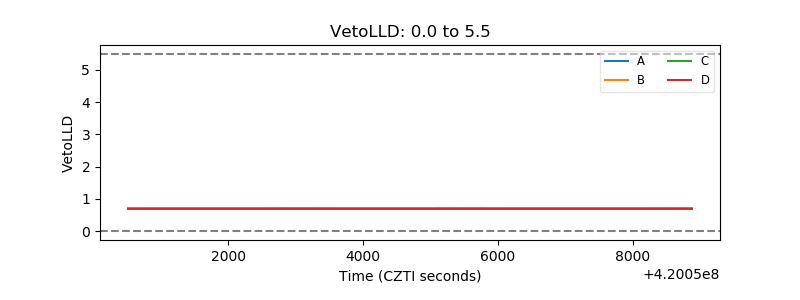 |
| Alpha Counter | 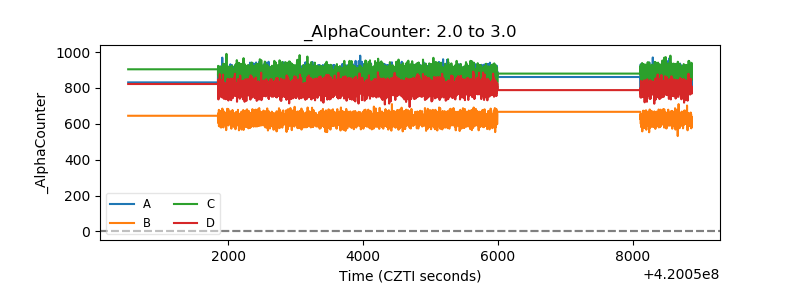 |
| _CPM_Rate | 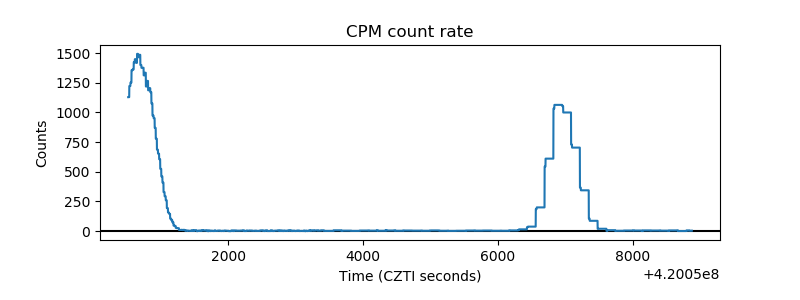 |
| CZT Counter | 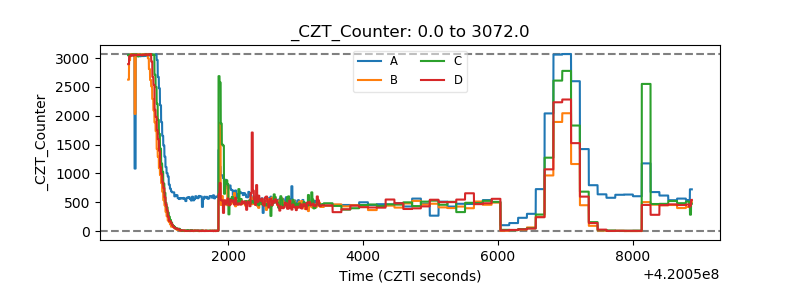 |
| +2.5 Volts monitor | 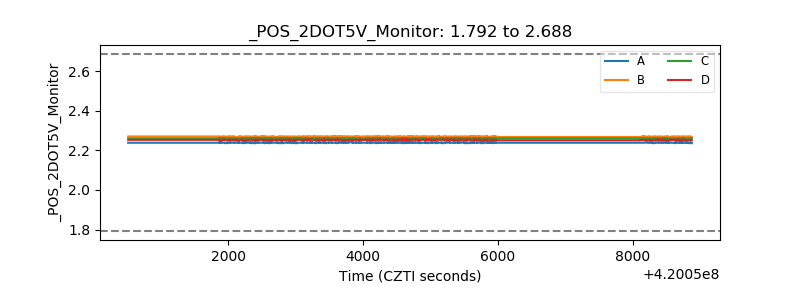 |
| +5 Volts monitor | 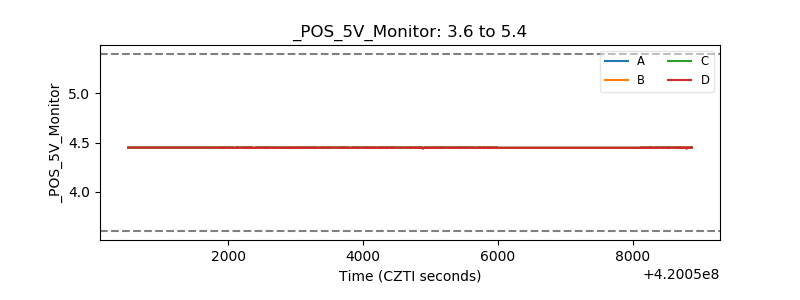 |
| _ROLL_ROT | 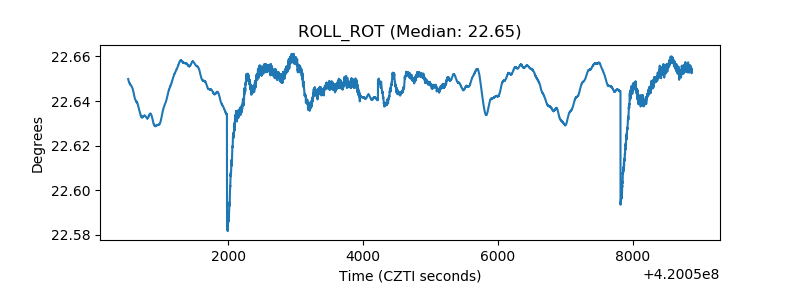 |
| _Roll_DEC | 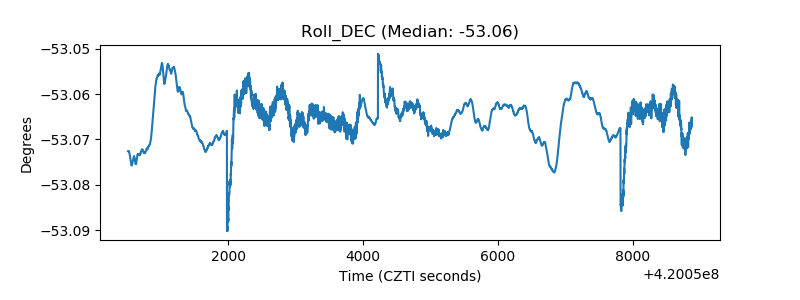 |
| _Roll_RA | 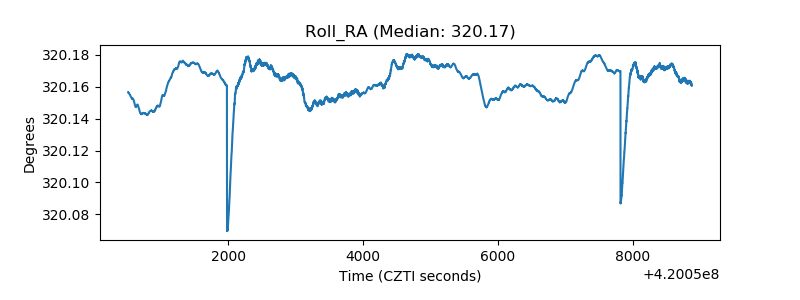 |
| Veto Counter | 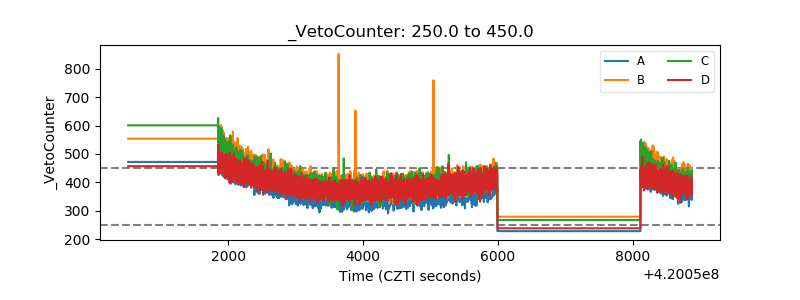 |