| Param | Original file | Final file |
|---|---|---|
| Filename | modeM0/AS1A12_052T04_9000005582_40941cztM0_level2.fits | modeM0/AS1A12_052T04_9000005582_40941cztM0_level2_quad_clean.evt |
| Size (bytes) | 326,566,080 | 81,391,680 |
| Size | 311.4 MB | 77.6 MB |
| Events in quadrant A | 2,552,412 | 562,720 |
| Events in quadrant B | 2,577,644 | 569,505 |
| Events in quadrant C | 2,493,827 | 526,501 |
| Events in quadrant D | 4,079,530 | 459,241 |
| Mode M9 | |||
|---|---|---|---|
| Quadrant | BADHDUFLAG | Total packets | Discarded packets |
| A | 0 | 39 | 0 |
| B | 0 | 39 | 0 |
| C | 0 | 39 | 0 |
| D | 0 | 40 | 0 |
| Mode SS | |||
|---|---|---|---|
| Quadrant | BADHDUFLAG | Total packets | Discarded packets |
| A | 0 | 102 | 0 |
| B | 0 | 102 | 0 |
| C | 0 | 102 | 0 |
| D | 0 | 102 | 0 |
| Mode M0 | |||
|---|---|---|---|
| Quadrant | BADHDUFLAG | Total packets | Discarded packets |
| A | 0 | 10623 | 3 |
| B | 0 | 10836 | 2 |
| C | 0 | 10549 | 2 |
| D | 0 | 15671 | 2 |
| Quadrant | Total seconds | Saturated seconds | Saturation percentage |
|---|---|---|---|
| A | 4939 | 10 | 0.202470% |
| B | 4939 | 6 | 0.121482% |
| C | 4939 | 64 | 1.295809% |
| D | 4939 | 496 | 10.042519% |
Noise dominated data is calculated using 1-second bins in cleaned event files. If a bin has >2000 counts, and if more than 50% of those come from <1% of pixels, then it is considered to be noise-dominated and hence unusable.
| Quadrant | # 1 sec bins | Bins with >0 counts | Bins with >2000 counts | High rate bins dominated by noise | Noise dominated (total time) | Noise dominated (detector-on time) | Marked lightcurve |
|---|---|---|---|---|---|---|---|
| A | 6941 | 4940 | 3 | 3 | 0.04% | 0.06% | 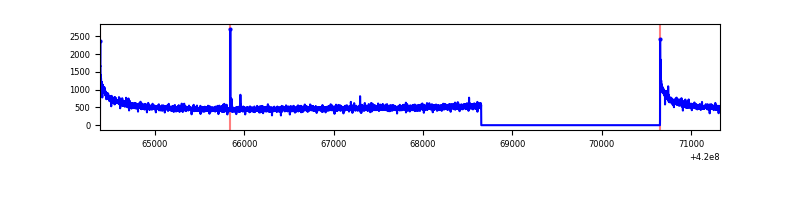 |
| B | 6941 | 4940 | 0 | 0 | 0.00% | 0.00% | 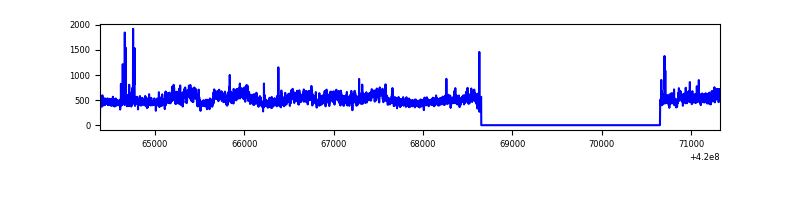 |
| C | 6941 | 4940 | 56 | 56 | 0.81% | 1.13% | 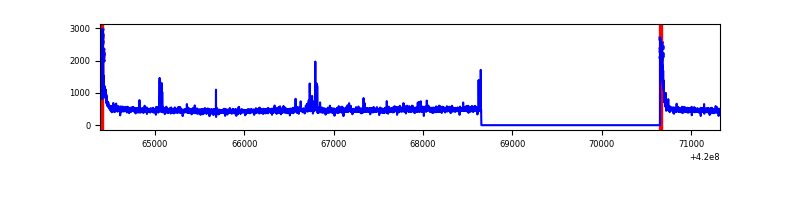 |
| D | 6941 | 4940 | 426 | 426 | 6.14% | 8.62% | 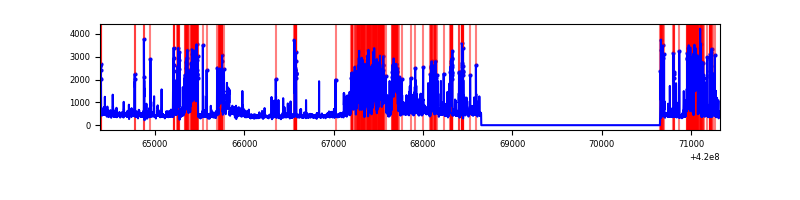 |
Top three noisy pixels from each quadrant. If the there are fewer than three noisy pixels in the level2.evt file, extra rows are filled as -1
| Pixel properties | Quadrant properties | ||||||
|---|---|---|---|---|---|---|---|
| Quadrant | DetID | PixID | Counts | Sigma | Mean | Median | Sigma |
| A | 10 | 83 | 465298 | 4268.24 | 533 | 521 | 108.9 |
| A | 2 | 79 | 16440 | 146.19 | 533 | 521 | 108.9 |
| A | 13 | 6 | 7847 | 67.27 | 533 | 521 | 108.9 |
| B | 0 | 229 | 449803 | 4354.86 | 529 | 514 | 103.2 |
| B | 5 | 255 | 31153 | 296.98 | 529 | 514 | 103.2 |
| B | 12 | 111 | 12747 | 118.57 | 529 | 514 | 103.2 |
| C | 15 | 214 | 229373 | 1884.93 | 520 | 522 | 121.4 |
| C | 0 | 10 | 182872 | 1501.93 | 520 | 522 | 121.4 |
| C | 9 | 54 | 35010 | 284.06 | 520 | 522 | 121.4 |
| D | 13 | 249 | 1263409 | 10327.41 | 501 | 486 | 122.3 |
| D | 2 | 249 | 651523 | 5323.78 | 501 | 486 | 122.3 |
| D | 12 | 6 | 62183 | 504.52 | 501 | 486 | 122.3 |
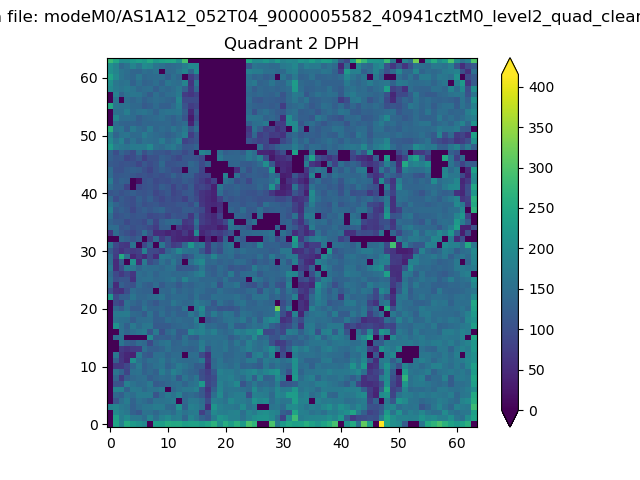
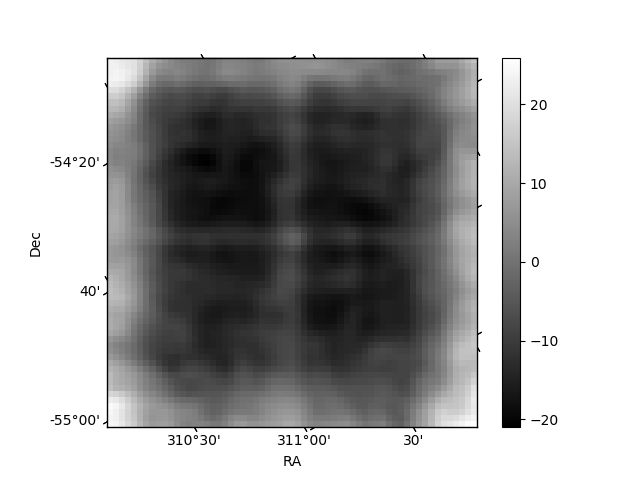
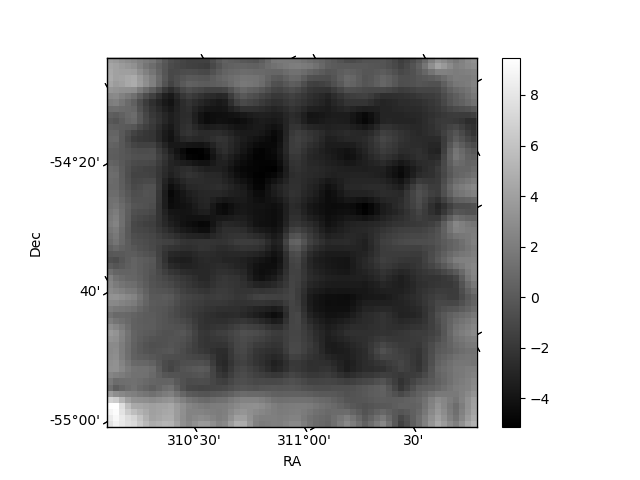
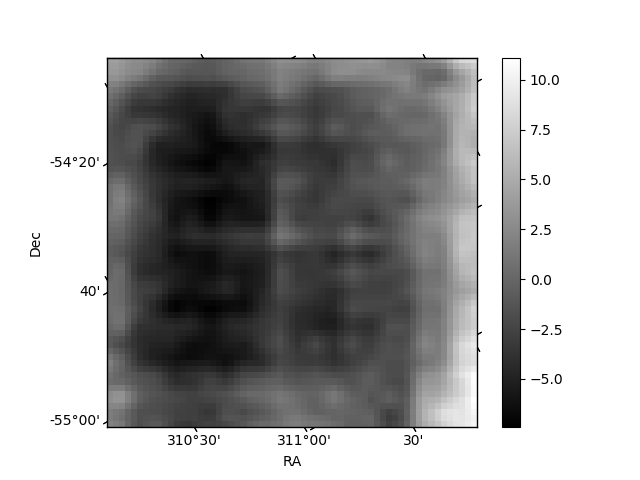
Histogram calculated using DETX and DETY for each event in the final _common_clean file
| Quadrant A | 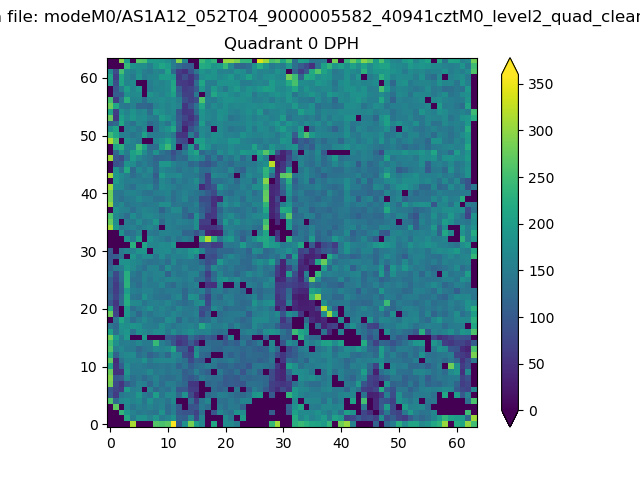 |
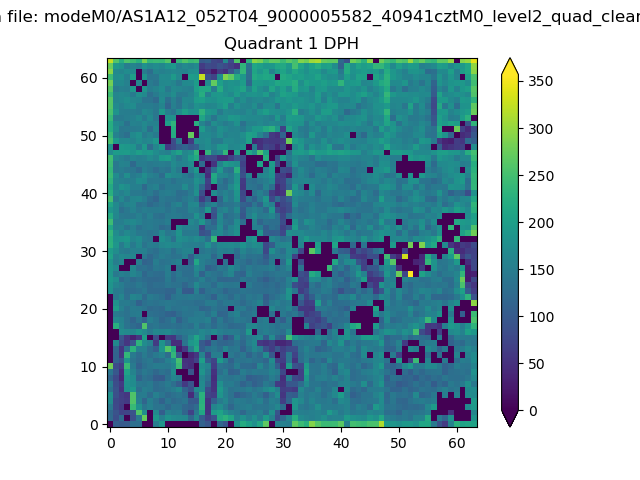 |
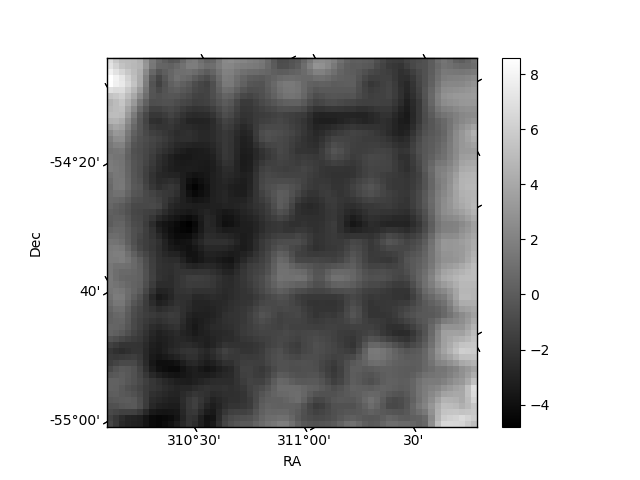
Quadrant B |
|---|---|---|---|
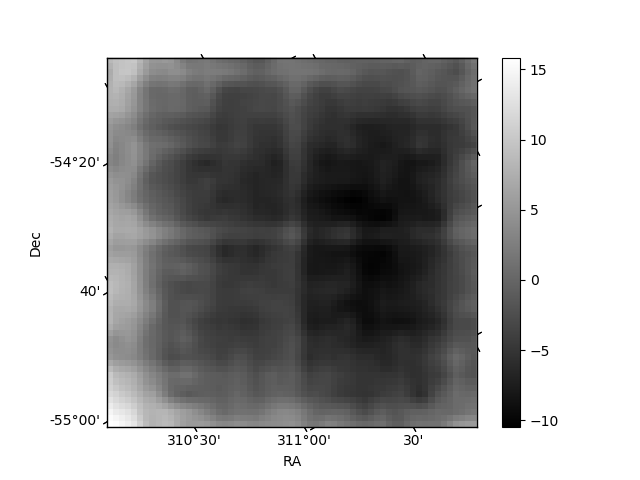
| Quadrant D | 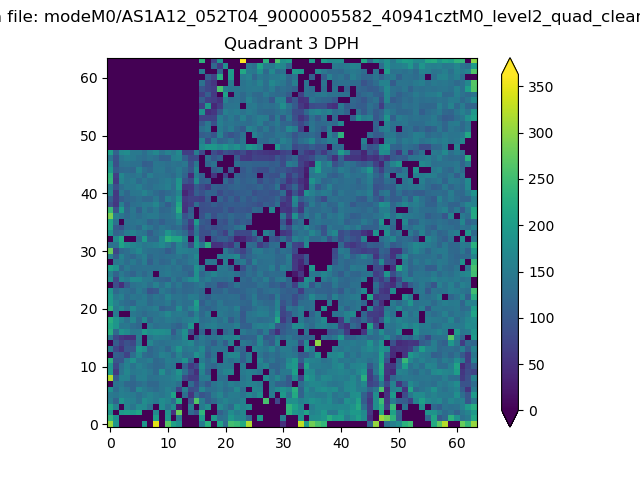 |
 |
Quadrant C |
| Plot type | Count rate plots | Images |
|---|---|---|
| Comparison with Poisson distribution Blue bars denote a histogram of data divided into 1 sec bins. Red curve is a Poisson curve with rate = median count rate of data. |
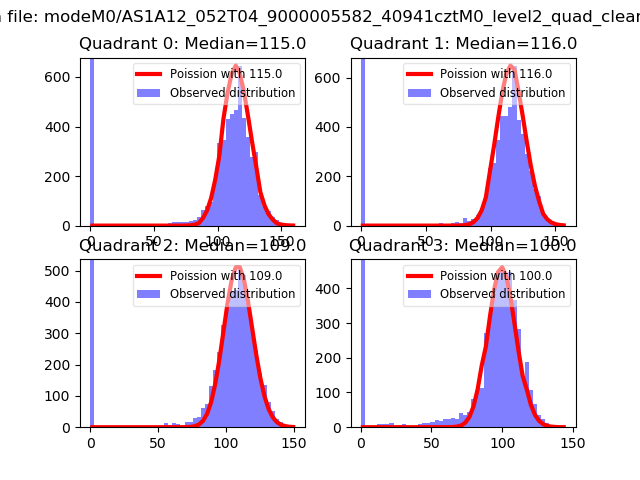 |
 |
| Quadrant-wise count rates Data is divided into 100 sec bins |
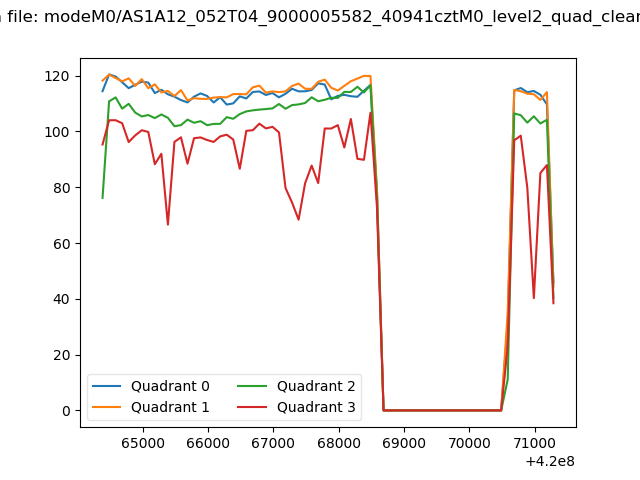 |
|
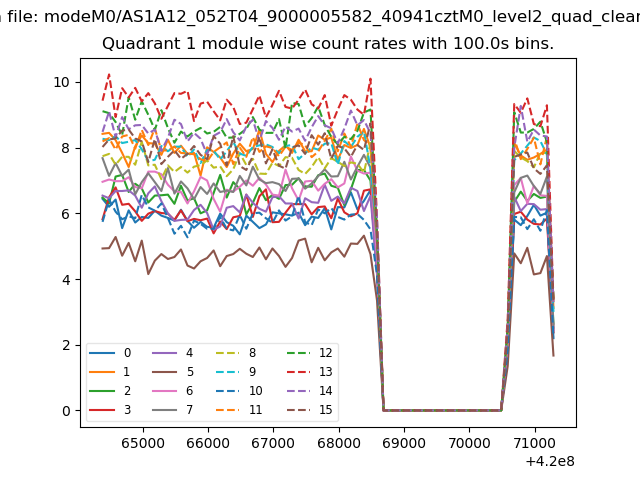
| Module-wise count rates for Quadrant A Data is divided into 100 sec bins |
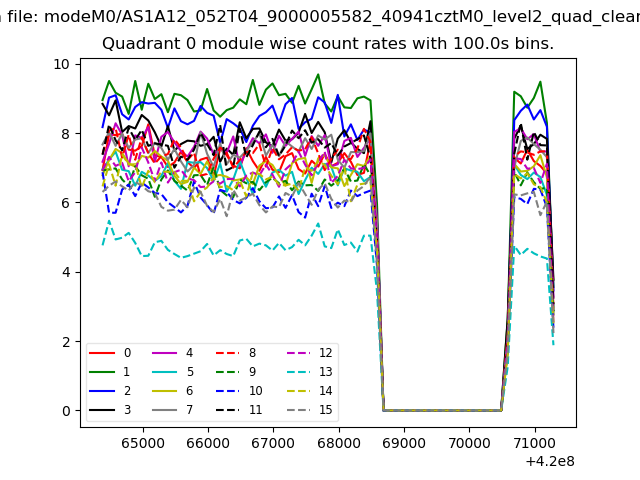 |
 |
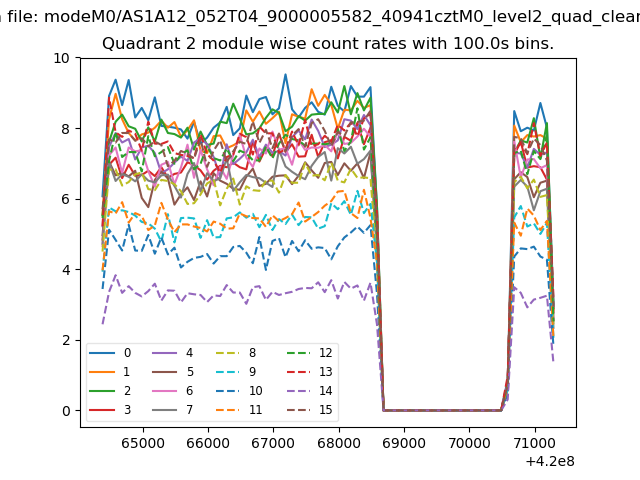
| Module-wise count rates for Quadrant B Data is divided into 100 sec bins |
 |
 |
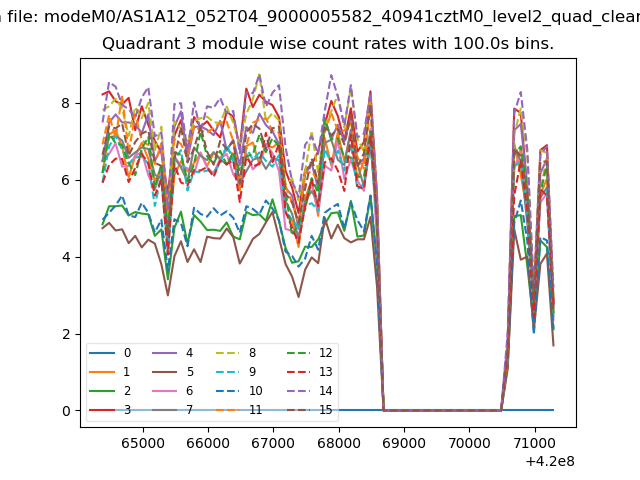
| Module-wise count rates for Quadrant C Data is divided into 100 sec bins |
 |
 |
| Module-wise count rates for Quadrant D Data is divided into 100 sec bins |
 |
 |
| Parameter | Plot |
|---|---|
| CZT HV Monitor | 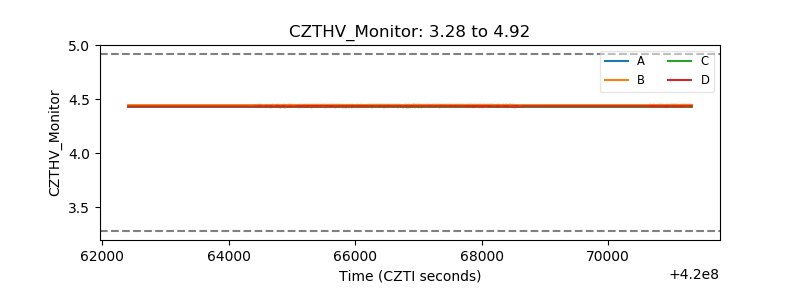 |
| D_VDD | 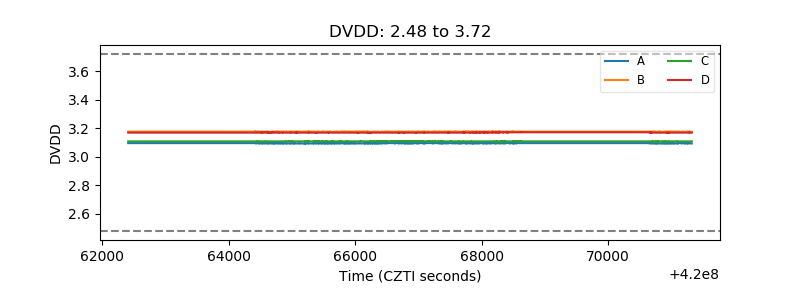 |
| Temperature 1 | 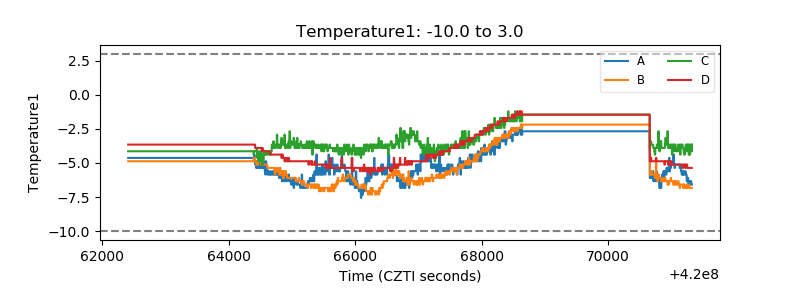 |
| Veto HV Monitor | 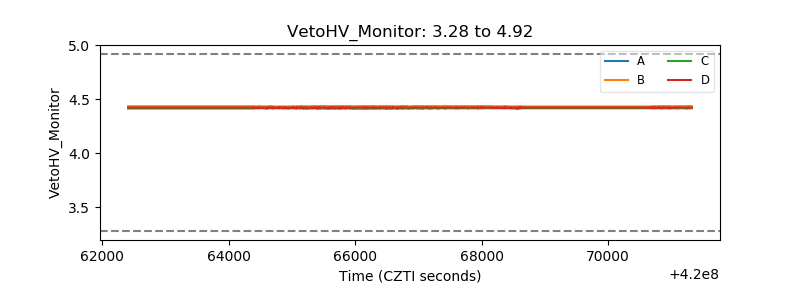 |
| Veto LLD | 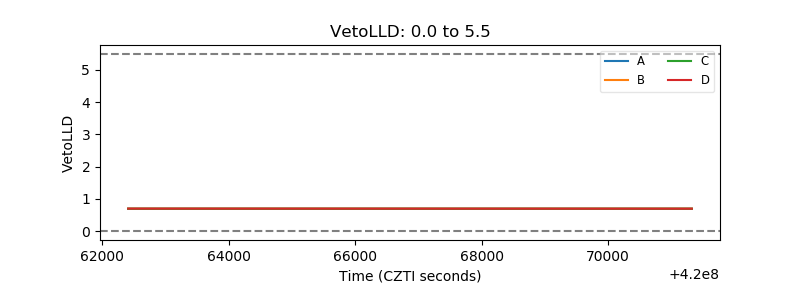 |
| Alpha Counter | 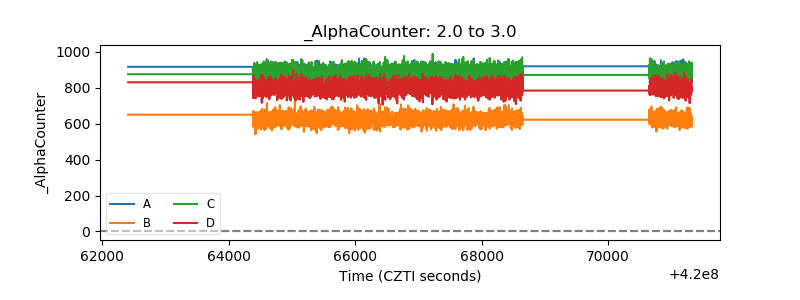 |
| _CPM_Rate | 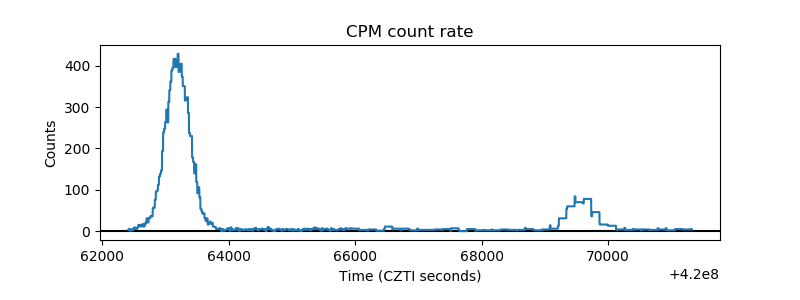 |
| CZT Counter | 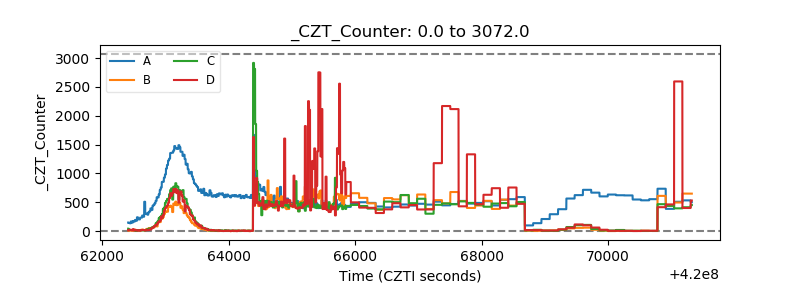 |
| +2.5 Volts monitor |  |
| +5 Volts monitor | 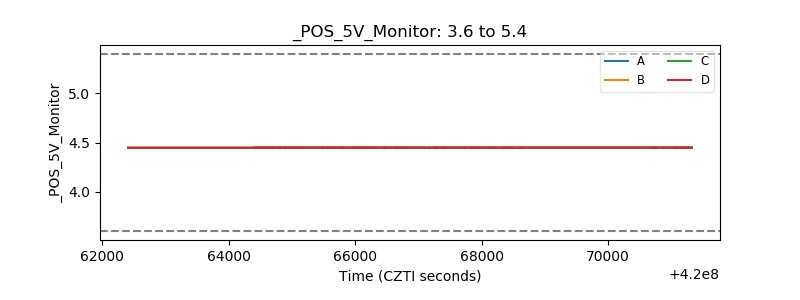 |
| _ROLL_ROT | 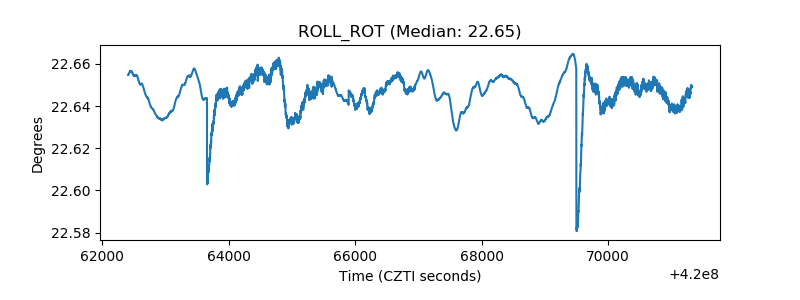 |
| _Roll_DEC | 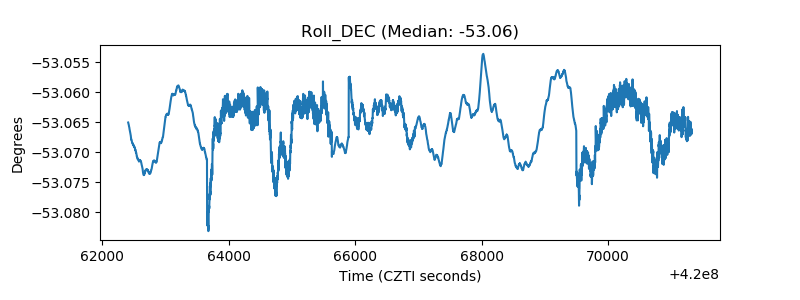 |
| _Roll_RA | 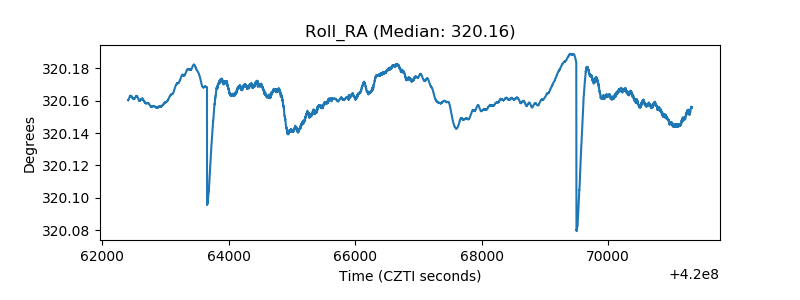 |
| Veto Counter | 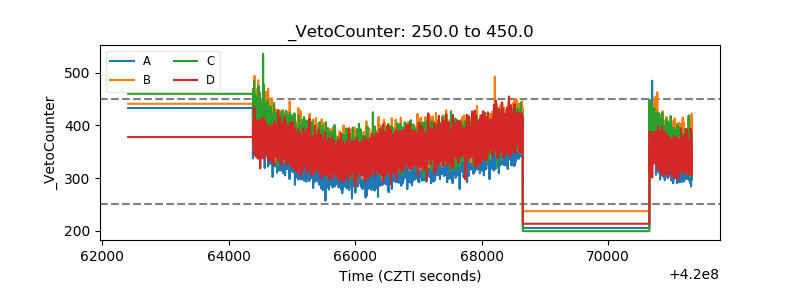 |