| Param | Original file | Final file |
|---|---|---|
| Filename | modeM0/AS1A12_052T04_9000005582_40942cztM0_level2.fits | modeM0/AS1A12_052T04_9000005582_40942cztM0_level2_quad_clean.evt |
| Size (bytes) | 360,097,920 | 87,289,920 |
| Size | 343.4 MB | 83.2 MB |
| Events in quadrant A | 2,766,058 | 598,074 |
| Events in quadrant B | 3,193,758 | 599,316 |
| Events in quadrant C | 2,640,164 | 570,666 |
| Events in quadrant D | 4,308,511 | 496,146 |
| Mode M9 | |||
|---|---|---|---|
| Quadrant | BADHDUFLAG | Total packets | Discarded packets |
| A | 0 | 34 | 0 |
| B | 0 | 34 | 0 |
| C | 0 | 34 | 0 |
| D | 0 | 35 | 0 |
| Mode SS | |||
|---|---|---|---|
| Quadrant | BADHDUFLAG | Total packets | Discarded packets |
| A | 0 | 112 | 0 |
| B | 0 | 112 | 0 |
| C | 0 | 112 | 0 |
| D | 0 | 112 | 0 |
| Mode M0 | |||
|---|---|---|---|
| Quadrant | BADHDUFLAG | Total packets | Discarded packets |
| A | 0 | 11536 | 3 |
| B | 0 | 13131 | 2 |
| C | 0 | 11281 | 2 |
| D | 0 | 16628 | 2 |
| Quadrant | Total seconds | Saturated seconds | Saturation percentage |
|---|---|---|---|
| A | 5408 | 10 | 0.184911% |
| B | 5408 | 110 | 2.034024% |
| C | 5408 | 36 | 0.665680% |
| D | 5408 | 503 | 9.301036% |
Noise dominated data is calculated using 1-second bins in cleaned event files. If a bin has >2000 counts, and if more than 50% of those come from <1% of pixels, then it is considered to be noise-dominated and hence unusable.
| Quadrant | # 1 sec bins | Bins with >0 counts | Bins with >2000 counts | High rate bins dominated by noise | Noise dominated (total time) | Noise dominated (detector-on time) | Marked lightcurve |
|---|---|---|---|---|---|---|---|
| A | 7080 | 5409 | 2 | 2 | 0.03% | 0.04% | 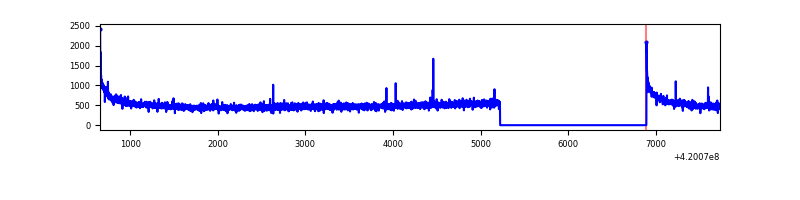 |
| B | 7080 | 5409 | 67 | 67 | 0.95% | 1.24% | 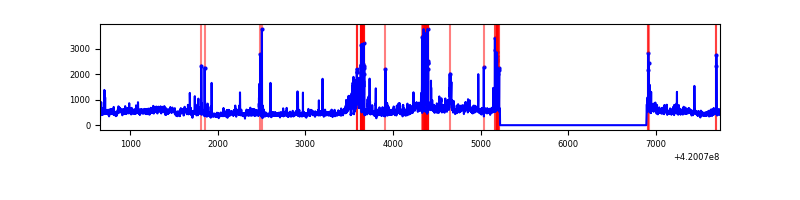 |
| C | 7080 | 5409 | 35 | 35 | 0.49% | 0.65% | 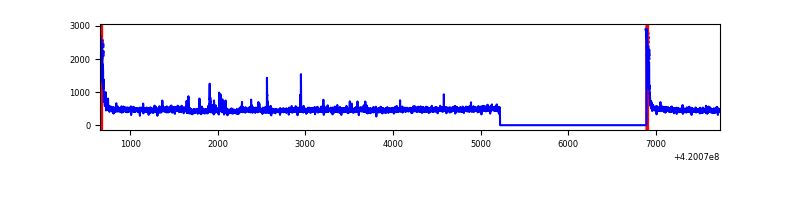 |
| D | 7080 | 5409 | 435 | 435 | 6.14% | 8.04% | 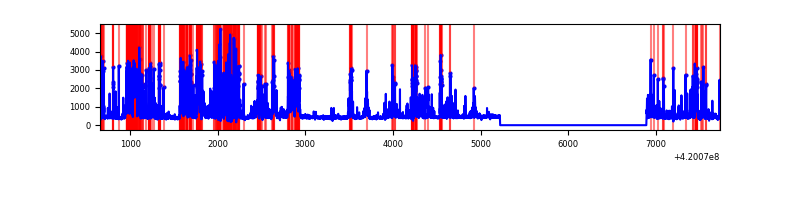 |
Top three noisy pixels from each quadrant. If the there are fewer than three noisy pixels in the level2.evt file, extra rows are filled as -1
| Pixel properties | Quadrant properties | ||||||
|---|---|---|---|---|---|---|---|
| Quadrant | DetID | PixID | Counts | Sigma | Mean | Median | Sigma |
| A | 10 | 83 | 492733 | 4174.88 | 578 | 566 | 117.9 |
| A | 13 | 6 | 17868 | 146.77 | 578 | 566 | 117.9 |
| A | 2 | 79 | 9027 | 71.77 | 578 | 566 | 117.9 |
| B | 0 | 229 | 441848 | 3985.96 | 569 | 553 | 110.7 |
| B | 5 | 255 | 384301 | 3466.17 | 569 | 553 | 110.7 |
| B | 15 | 35 | 52620 | 470.29 | 569 | 553 | 110.7 |
| C | 15 | 214 | 251646 | 1910.95 | 564 | 567 | 131.4 |
| C | 0 | 10 | 133673 | 1013.06 | 564 | 567 | 131.4 |
| C | 14 | 254 | 22824 | 169.4 | 564 | 567 | 131.4 |
| D | 2 | 249 | 783860 | 5930.66 | 543 | 528 | 132.1 |
| D | 12 | 6 | 740413 | 5601.72 | 543 | 528 | 132.1 |
| D | 13 | 249 | 570855 | 4317.98 | 543 | 528 | 132.1 |
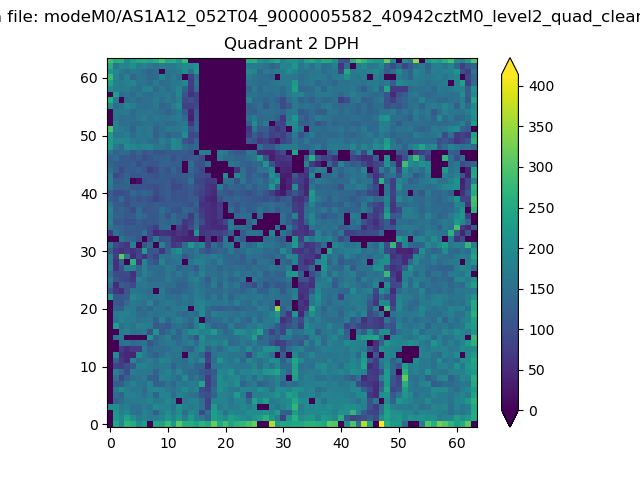
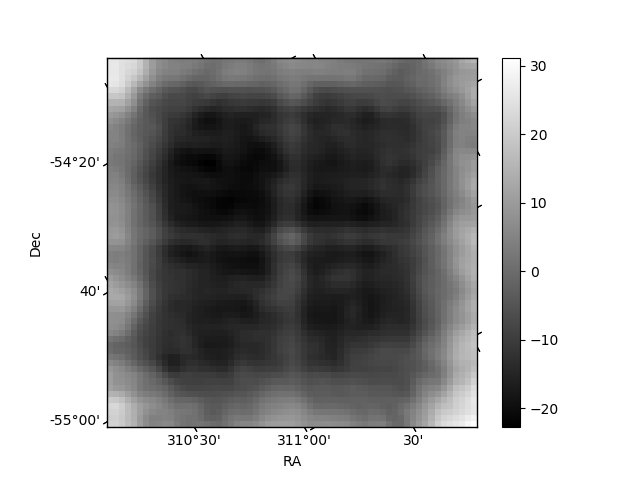
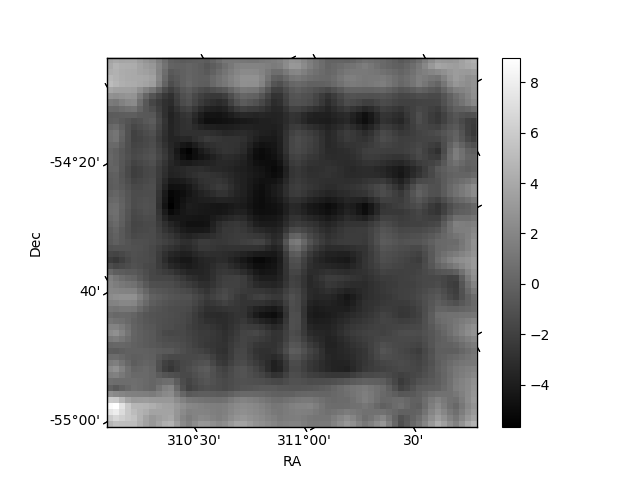
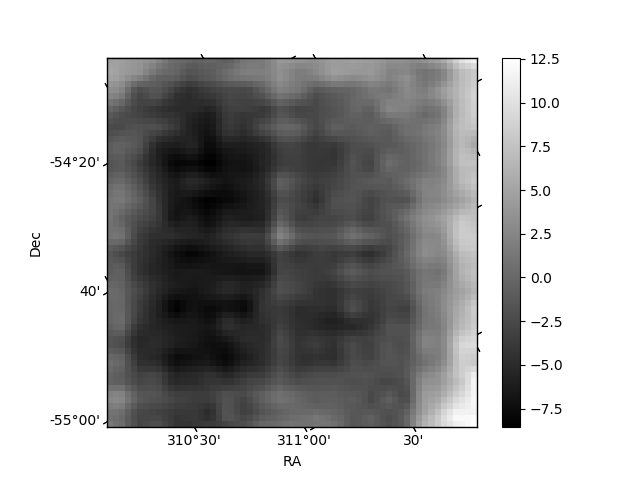
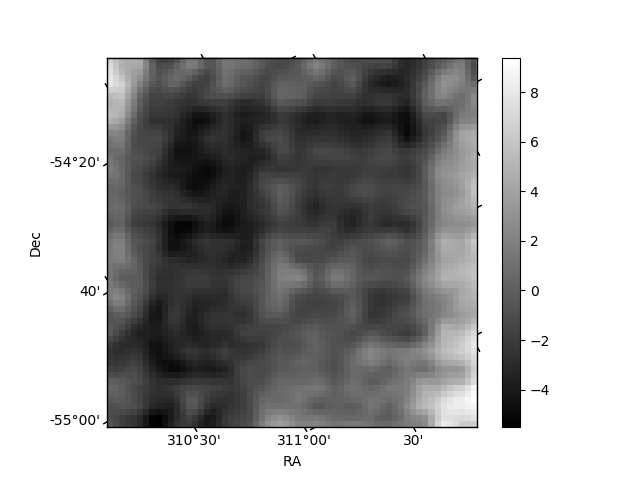
Histogram calculated using DETX and DETY for each event in the final _common_clean file
| Quadrant A | 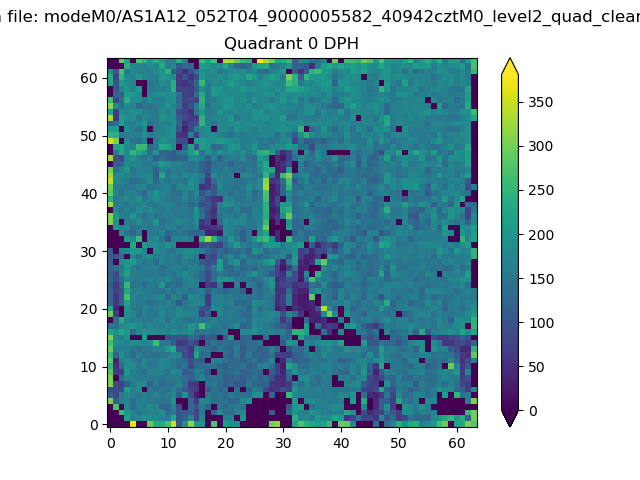 |
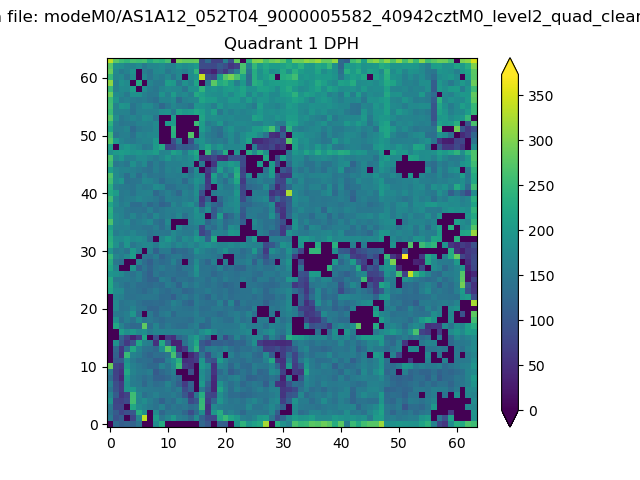 |
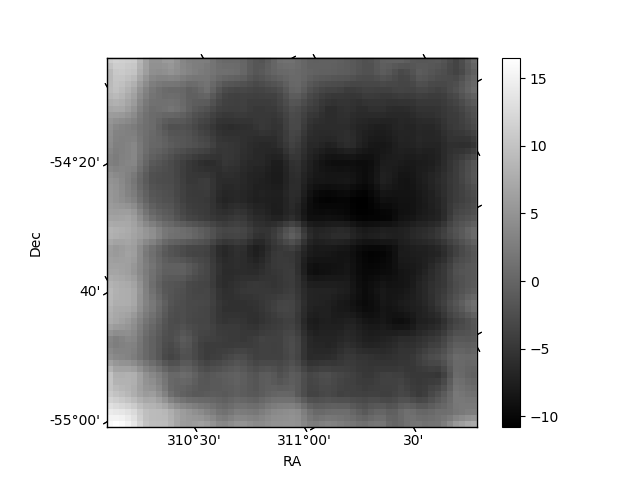
Quadrant B |
|---|---|---|---|
| Quadrant D | 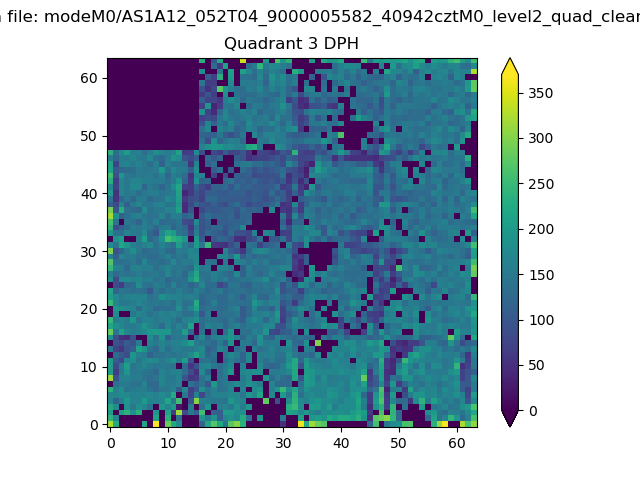 |
 |
Quadrant C |
| Plot type | Count rate plots | Images |
|---|---|---|
| Comparison with Poisson distribution Blue bars denote a histogram of data divided into 1 sec bins. Red curve is a Poisson curve with rate = median count rate of data. |
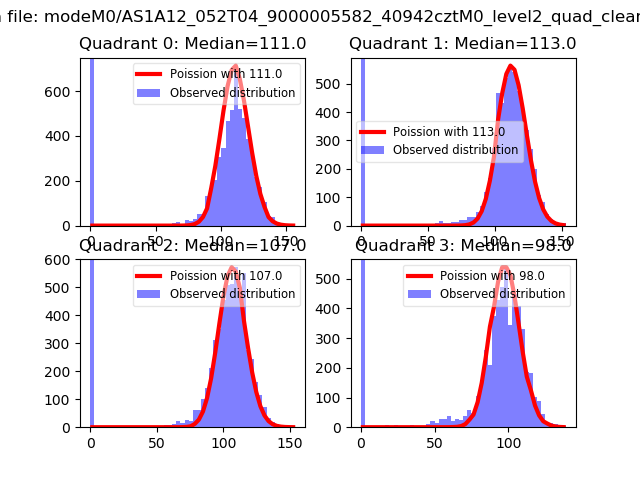 |
 |
| Quadrant-wise count rates Data is divided into 100 sec bins |
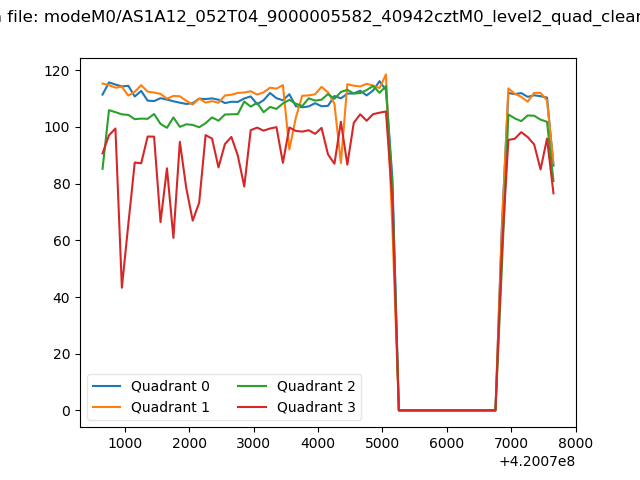 |
|
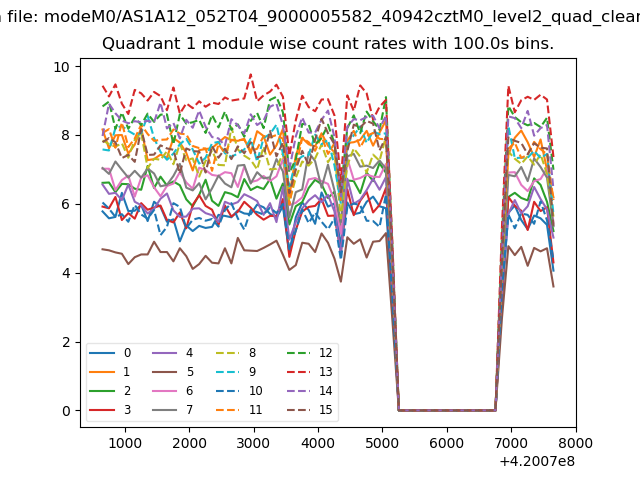
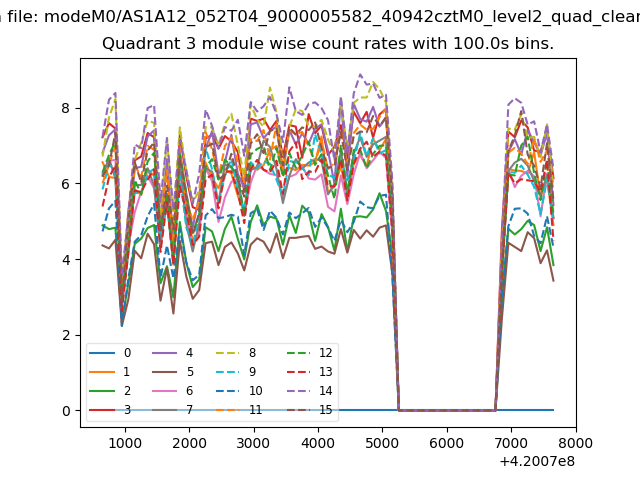
| Module-wise count rates for Quadrant A Data is divided into 100 sec bins |
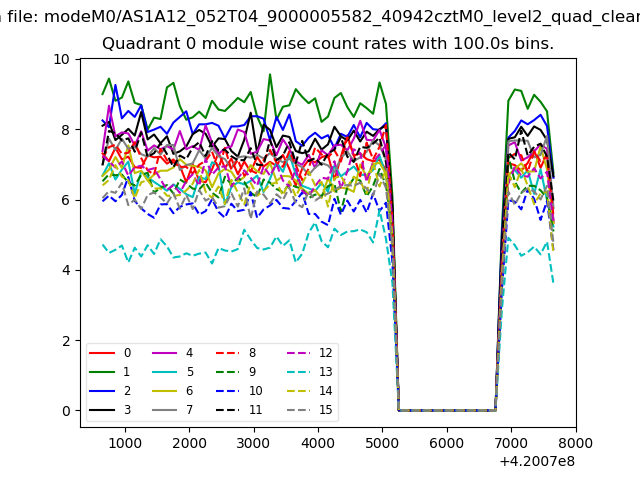 |
 |
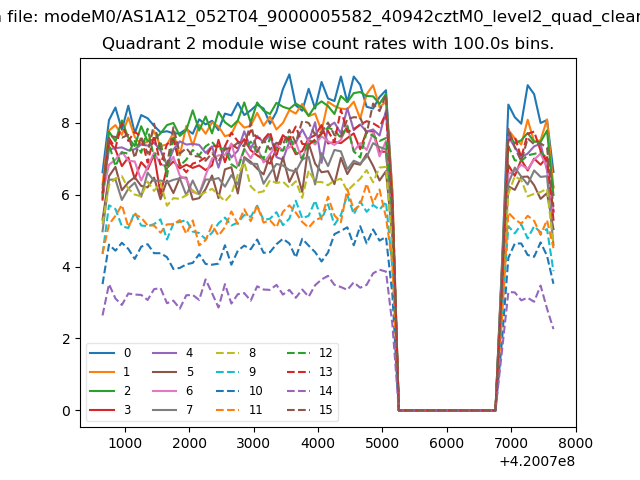
| Module-wise count rates for Quadrant B Data is divided into 100 sec bins |
 |
 |
| Module-wise count rates for Quadrant C Data is divided into 100 sec bins |
 |
 |
| Module-wise count rates for Quadrant D Data is divided into 100 sec bins |
 |
 |
| Parameter | Plot |
|---|---|
| CZT HV Monitor | 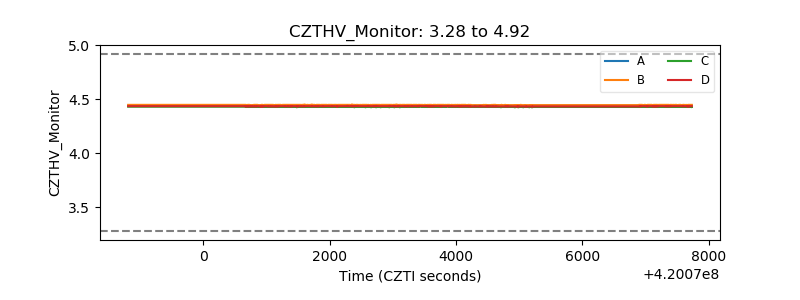 |
| D_VDD | 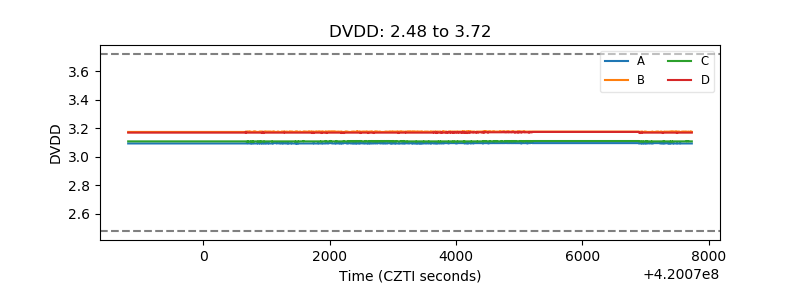 |
| Temperature 1 | 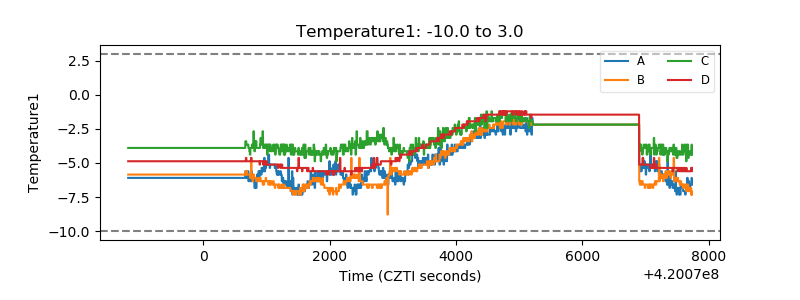 |
| Veto HV Monitor | 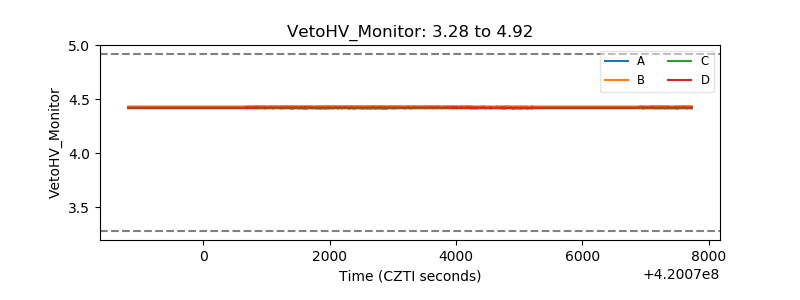 |
| Veto LLD | 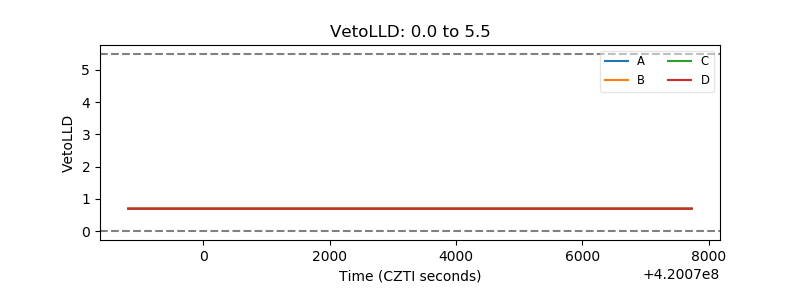 |
| Alpha Counter | 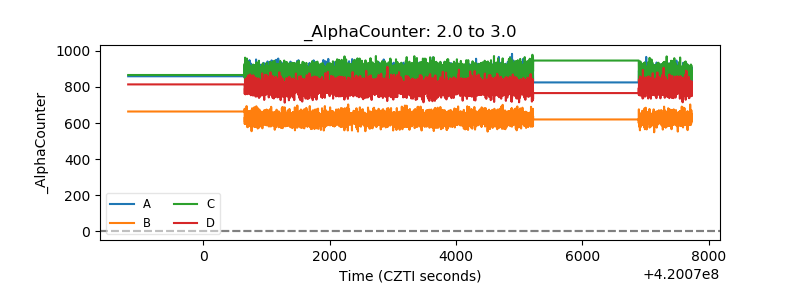 |
| _CPM_Rate | 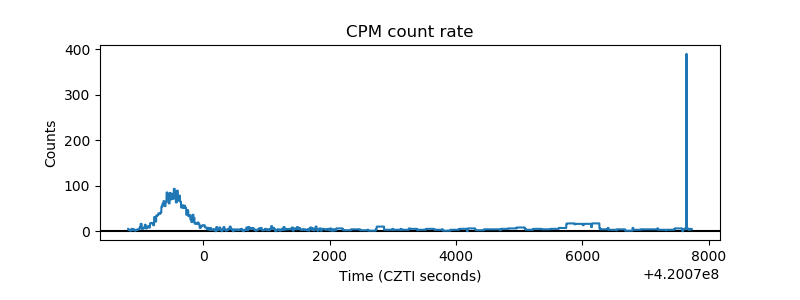 |
| CZT Counter | 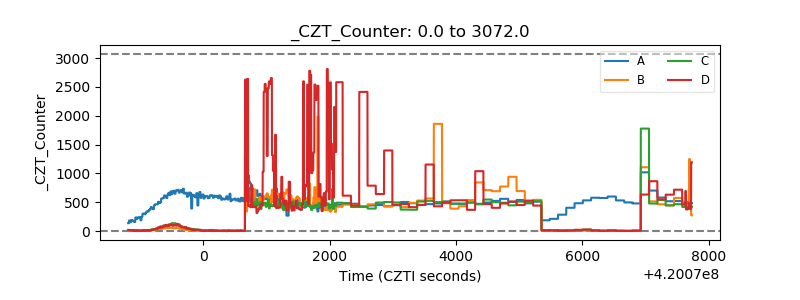 |
| +2.5 Volts monitor | 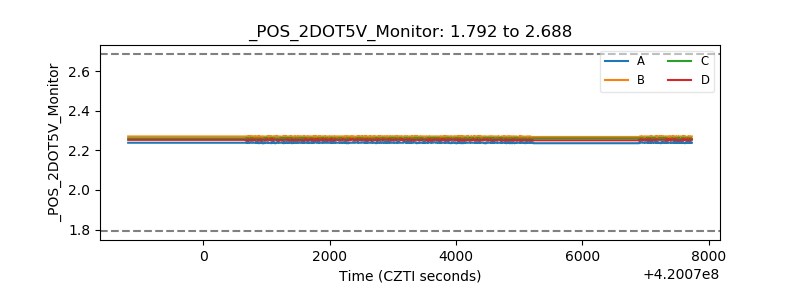 |
| +5 Volts monitor | 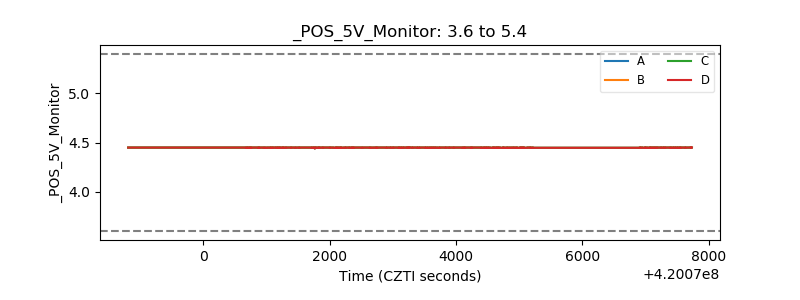 |
| _ROLL_ROT | 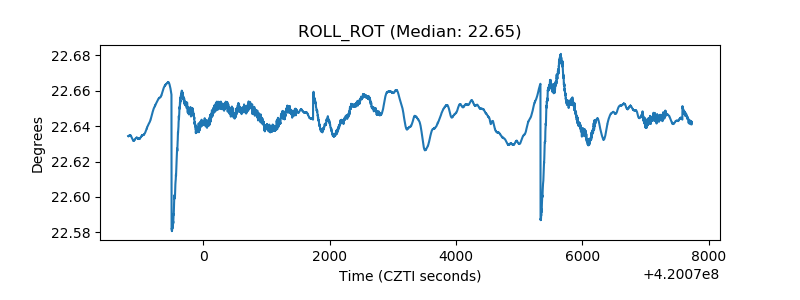 |
| _Roll_DEC | 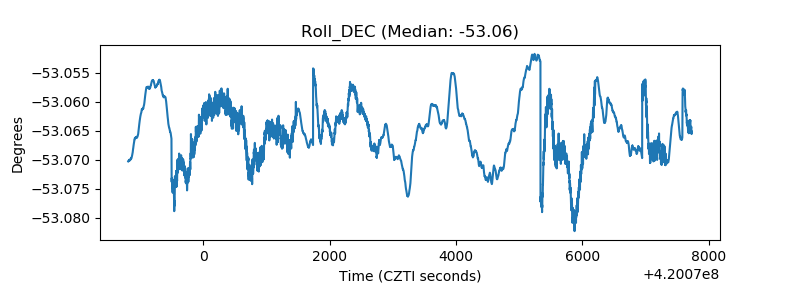 |
| _Roll_RA | 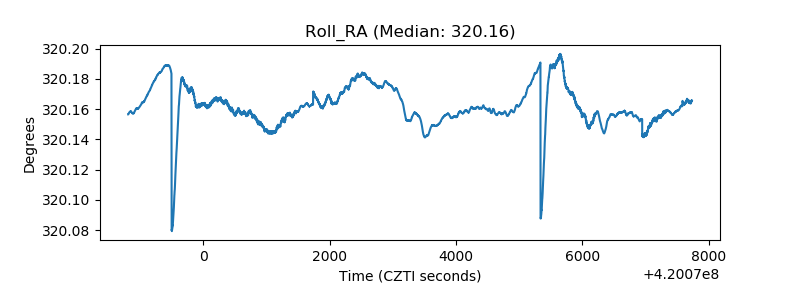 |
| Veto Counter | 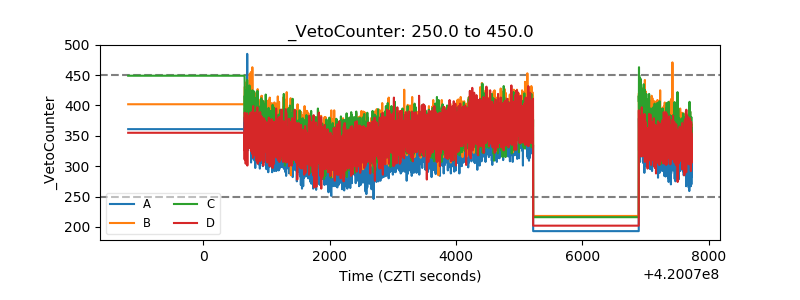 |