| Param | Original file | Final file |
|---|---|---|
| Filename | modeM0/AS1A12_052T04_9000005582_40943cztM0_level2.fits | modeM0/AS1A12_052T04_9000005582_40943cztM0_level2_quad_clean.evt |
| Size (bytes) | 370,082,880 | 93,323,520 |
| Size | 352.9 MB | 89.0 MB |
| Events in quadrant A | 2,985,859 | 634,688 |
| Events in quadrant B | 2,699,096 | 642,654 |
| Events in quadrant C | 2,758,161 | 611,029 |
| Events in quadrant D | 4,802,758 | 530,547 |
| Mode M9 | |||
|---|---|---|---|
| Quadrant | BADHDUFLAG | Total packets | Discarded packets |
| A | 0 | 29 | 0 |
| B | 0 | 29 | 0 |
| C | 0 | 29 | 0 |
| D | 0 | 29 | 0 |
| Mode SS | |||
|---|---|---|---|
| Quadrant | BADHDUFLAG | Total packets | Discarded packets |
| A | 0 | 118 | 0 |
| B | 0 | 118 | 0 |
| C | 0 | 118 | 0 |
| D | 0 | 118 | 0 |
| Mode M0 | |||
|---|---|---|---|
| Quadrant | BADHDUFLAG | Total packets | Discarded packets |
| A | 0 | 12431 | 3 |
| B | 0 | 12126 | 2 |
| C | 0 | 11965 | 2 |
| D | 0 | 18358 | 2 |
| Quadrant | Total seconds | Saturated seconds | Saturation percentage |
|---|---|---|---|
| A | 5822 | 12 | 0.206115% |
| B | 5822 | 19 | 0.326348% |
| C | 5822 | 20 | 0.343525% |
| D | 5822 | 526 | 9.034696% |
Noise dominated data is calculated using 1-second bins in cleaned event files. If a bin has >2000 counts, and if more than 50% of those come from <1% of pixels, then it is considered to be noise-dominated and hence unusable.
| Quadrant | # 1 sec bins | Bins with >0 counts | Bins with >2000 counts | High rate bins dominated by noise | Noise dominated (total time) | Noise dominated (detector-on time) | Marked lightcurve |
|---|---|---|---|---|---|---|---|
| A | 7195 | 5823 | 3 | 3 | 0.04% | 0.05% | 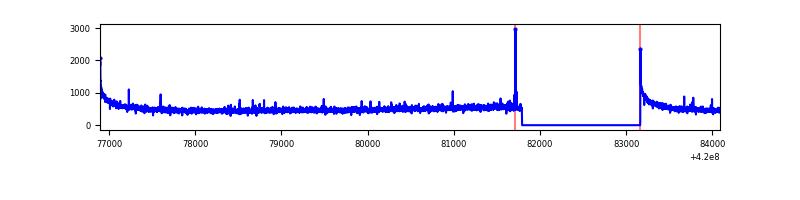 |
| B | 7195 | 5823 | 10 | 10 | 0.14% | 0.17% | 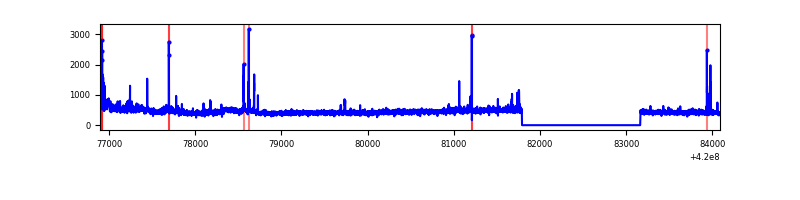 |
| C | 7195 | 5823 | 19 | 19 | 0.26% | 0.33% | 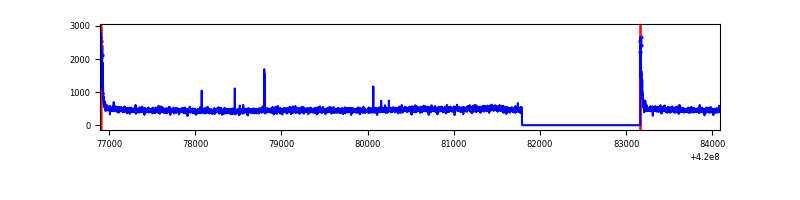 |
| D | 7195 | 5823 | 489 | 489 | 6.80% | 8.40% | 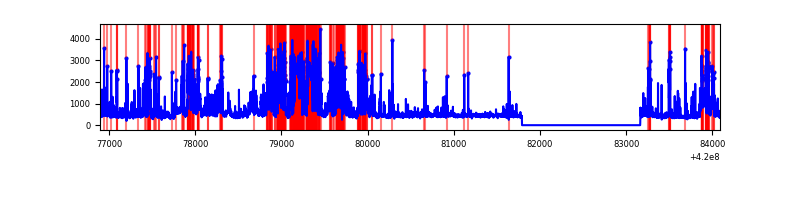 |
Top three noisy pixels from each quadrant. If the there are fewer than three noisy pixels in the level2.evt file, extra rows are filled as -1
| Pixel properties | Quadrant properties | ||||||
|---|---|---|---|---|---|---|---|
| Quadrant | DetID | PixID | Counts | Sigma | Mean | Median | Sigma |
| A | 10 | 83 | 532799 | 4155.88 | 625 | 612 | 128.1 |
| A | 13 | 248 | 17375 | 130.9 | 625 | 612 | 128.1 |
| A | 13 | 6 | 10731 | 79.02 | 625 | 612 | 128.1 |
| B | 0 | 229 | 128531 | 1060.74 | 620 | 603 | 120.6 |
| B | 5 | 255 | 77635 | 638.72 | 620 | 603 | 120.6 |
| B | 0 | 190 | 28803 | 233.82 | 620 | 603 | 120.6 |
| C | 15 | 214 | 272028 | 1897.58 | 610 | 614 | 143.0 |
| C | 0 | 10 | 93387 | 648.62 | 610 | 614 | 143.0 |
| C | 12 | 249 | 14675 | 98.31 | 610 | 614 | 143.0 |
| D | 13 | 249 | 1008339 | 7092.3 | 585 | 569 | 142.1 |
| D | 12 | 6 | 939233 | 6605.96 | 585 | 569 | 142.1 |
| D | 2 | 249 | 346447 | 2434.16 | 585 | 569 | 142.1 |
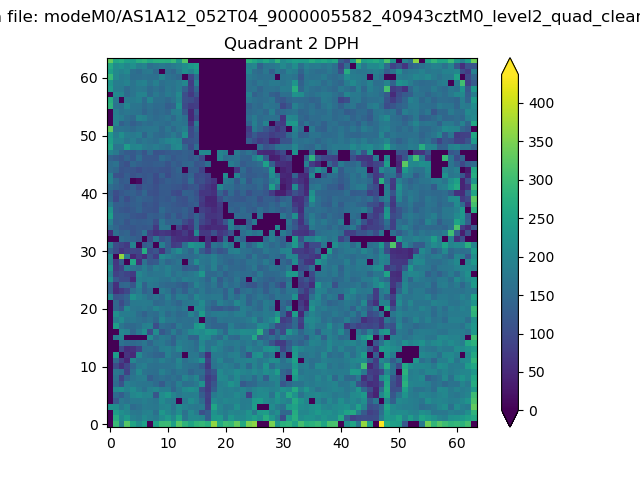
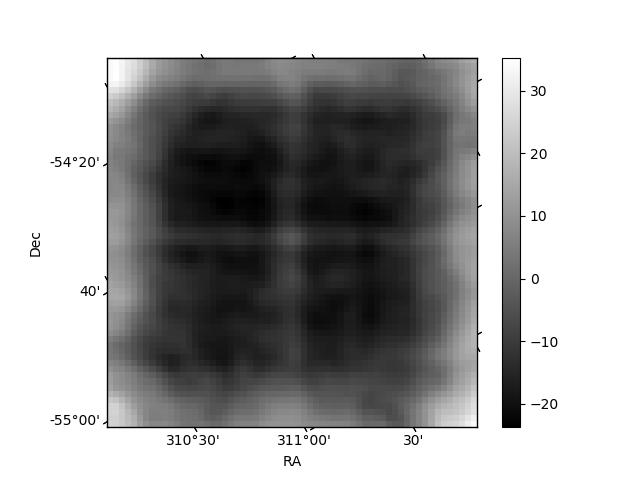
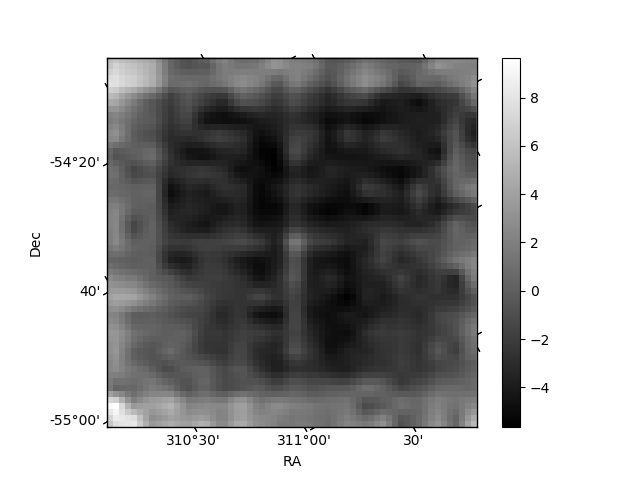
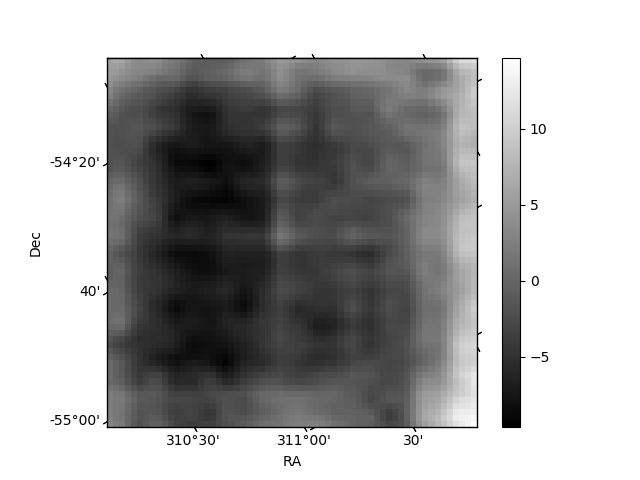
Histogram calculated using DETX and DETY for each event in the final _common_clean file
| Quadrant A | 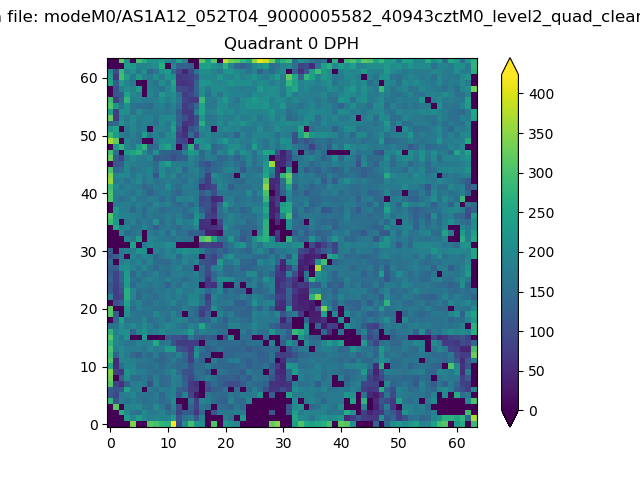 |
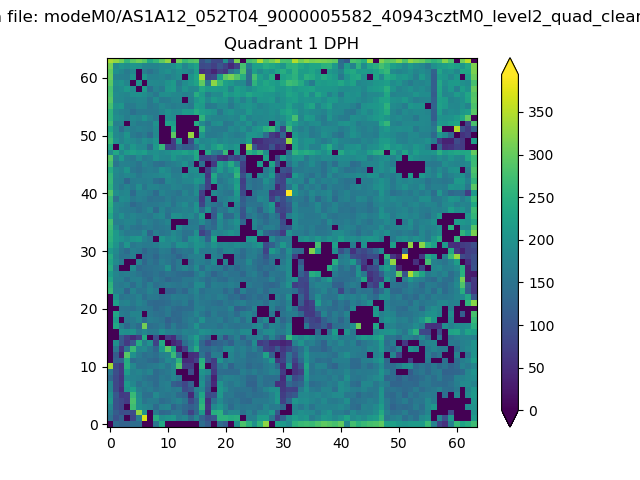 |
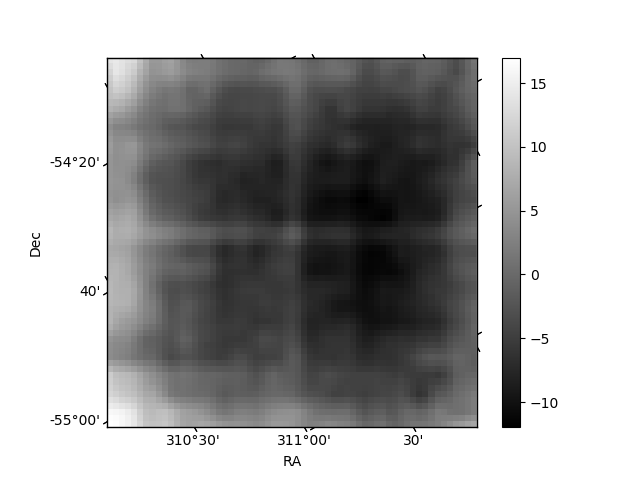
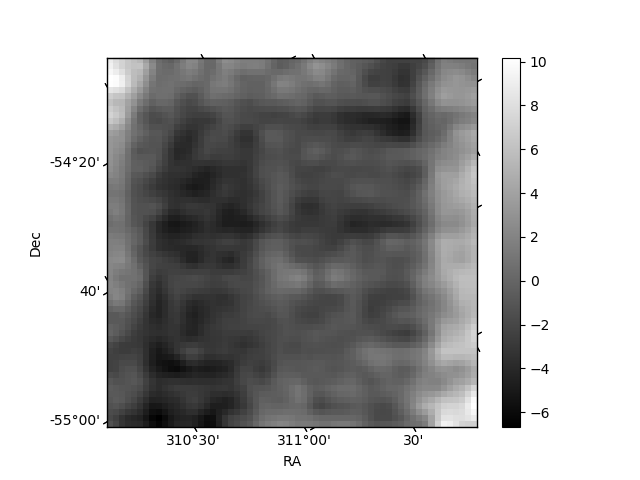
Quadrant B |
|---|---|---|---|
| Quadrant D | 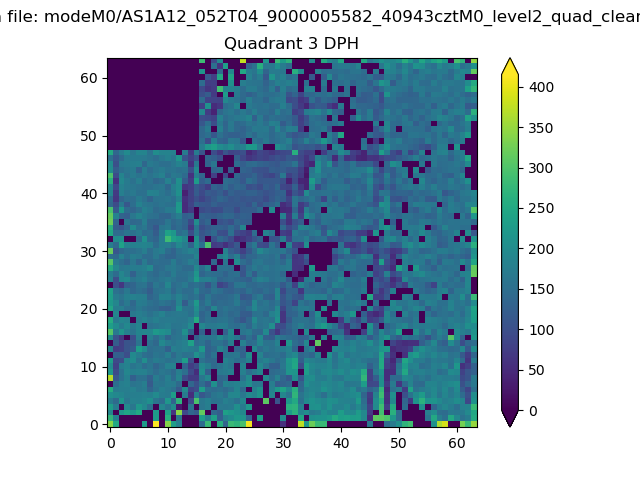 |
 |
Quadrant C |
| Plot type | Count rate plots | Images |
|---|---|---|
| Comparison with Poisson distribution Blue bars denote a histogram of data divided into 1 sec bins. Red curve is a Poisson curve with rate = median count rate of data. |
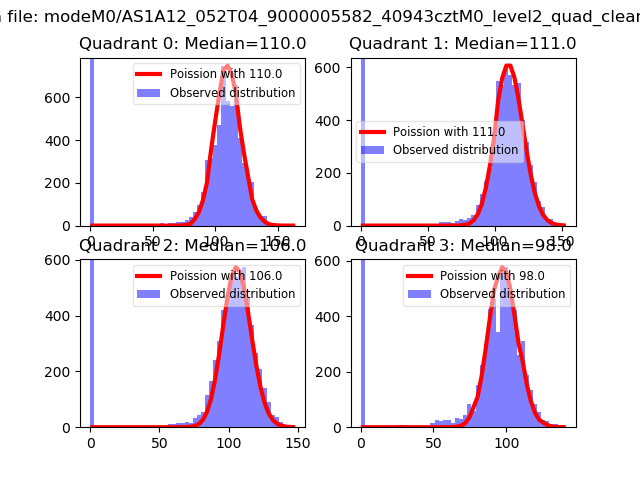 |
 |
| Quadrant-wise count rates Data is divided into 100 sec bins |
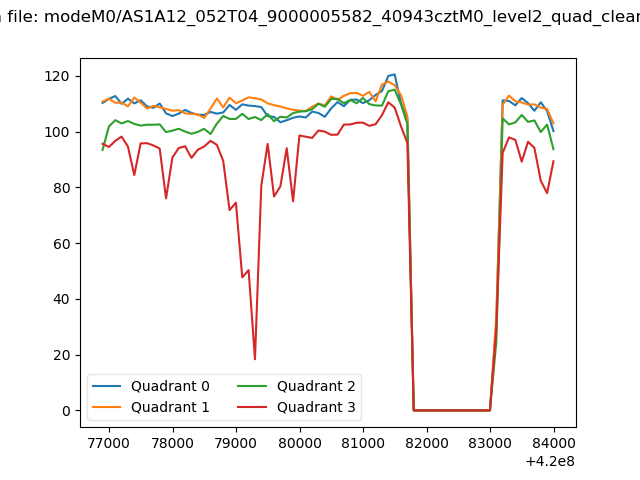 |
|
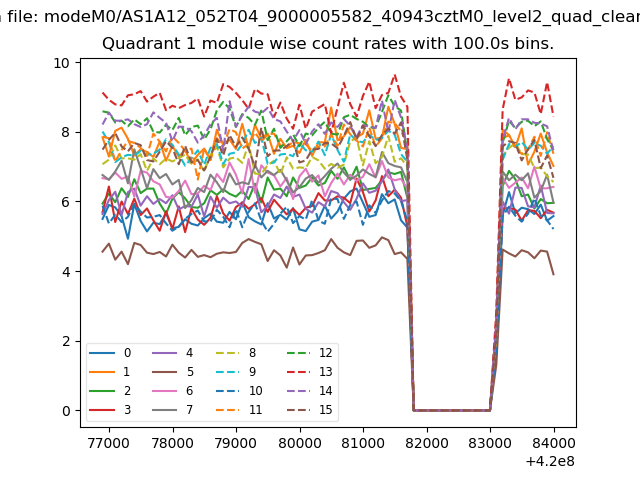
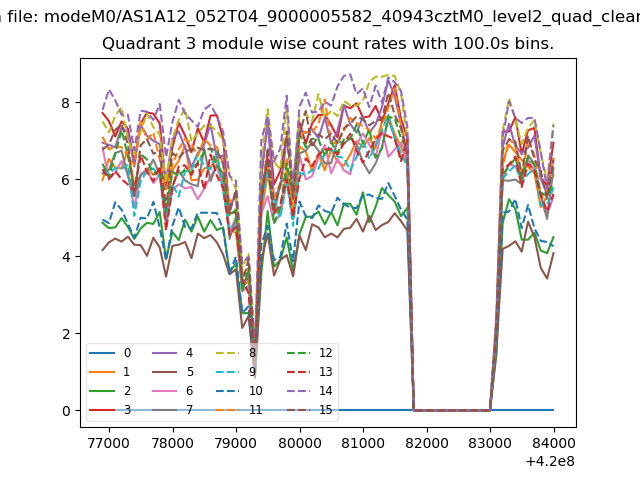
| Module-wise count rates for Quadrant A Data is divided into 100 sec bins |
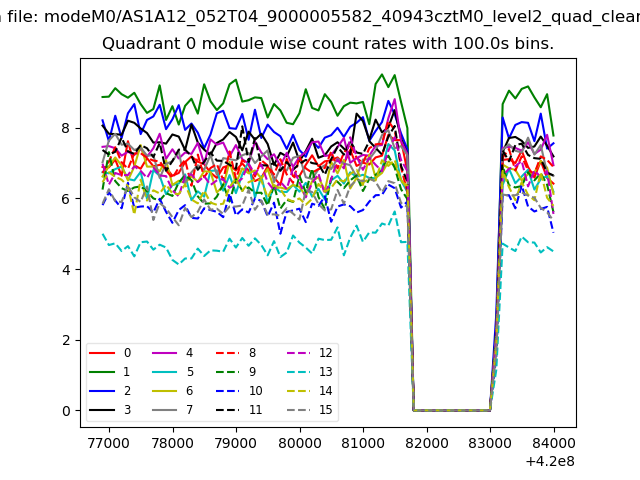 |
 |
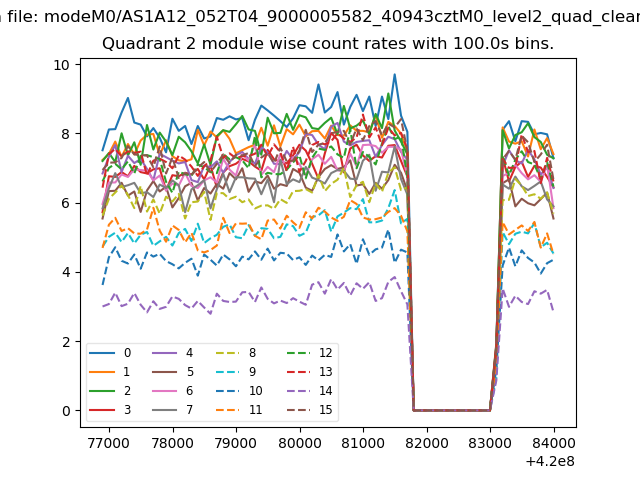
| Module-wise count rates for Quadrant B Data is divided into 100 sec bins |
 |
 |
| Module-wise count rates for Quadrant C Data is divided into 100 sec bins |
 |
 |
| Module-wise count rates for Quadrant D Data is divided into 100 sec bins |
 |
 |
| Parameter | Plot |
|---|---|
| CZT HV Monitor | 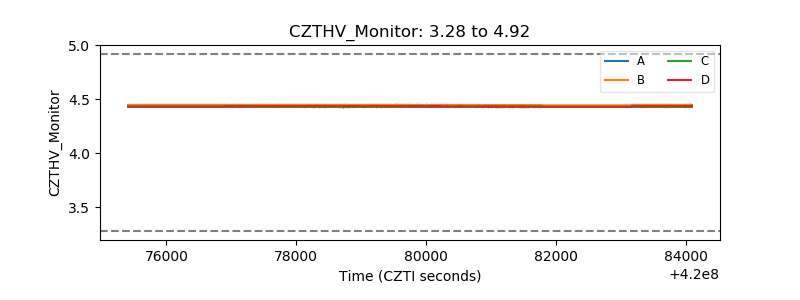 |
| D_VDD | 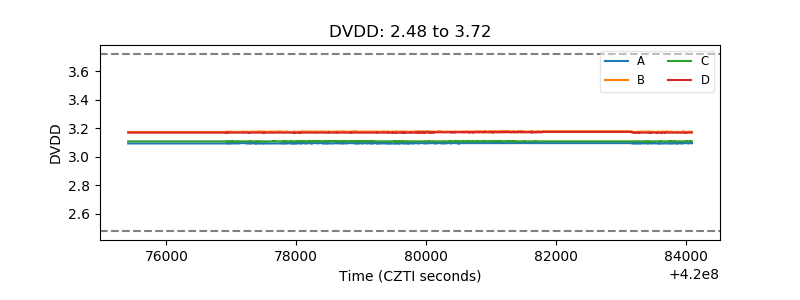 |
| Temperature 1 | 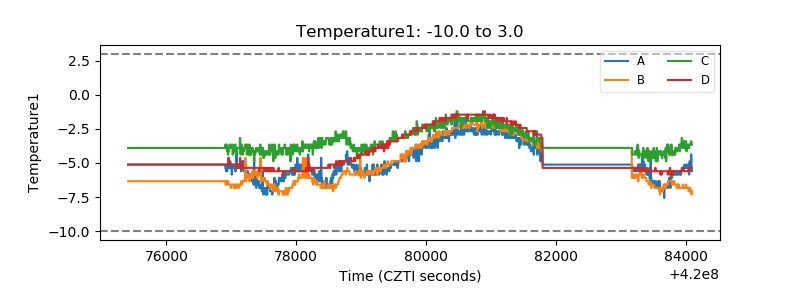 |
| Veto HV Monitor | 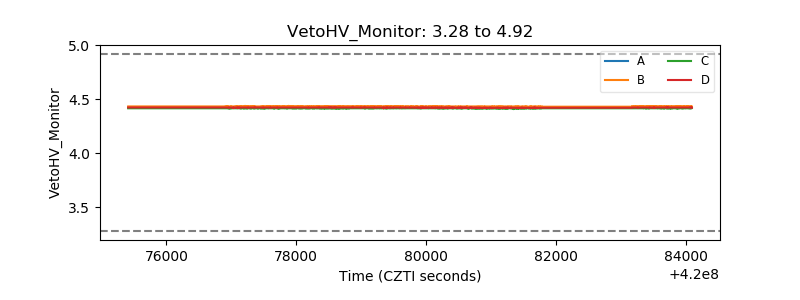 |
| Veto LLD | 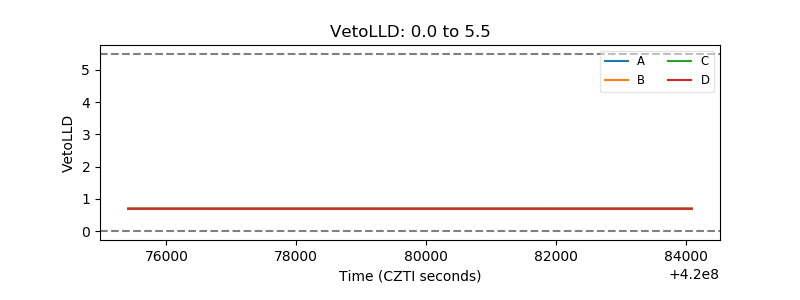 |
| Alpha Counter | 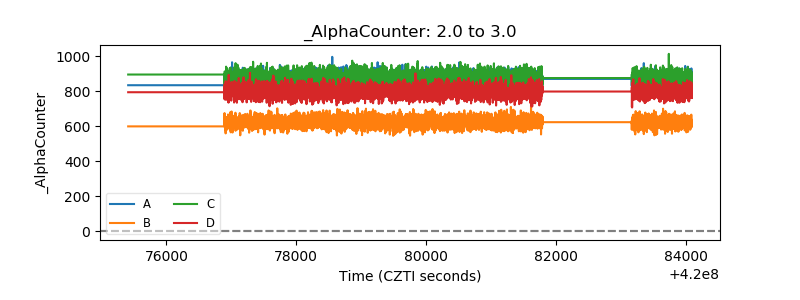 |
| _CPM_Rate | 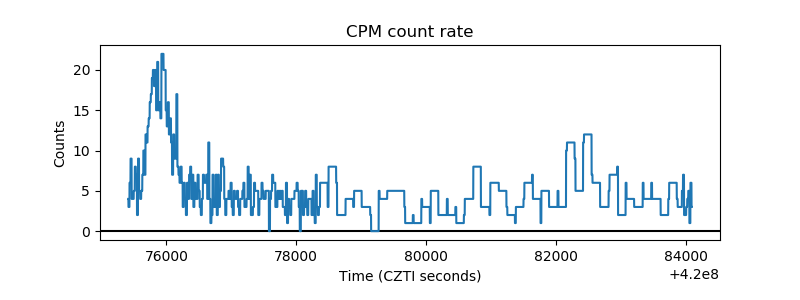 |
| CZT Counter | 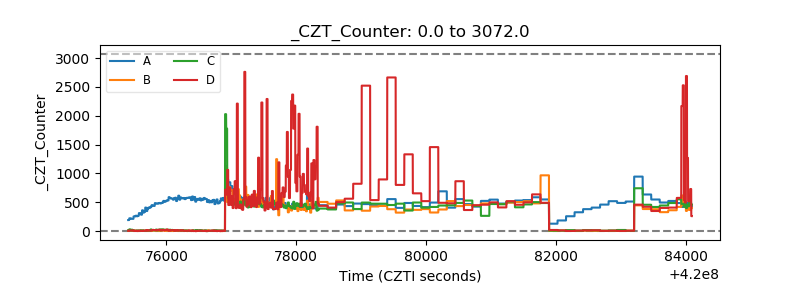 |
| +2.5 Volts monitor | 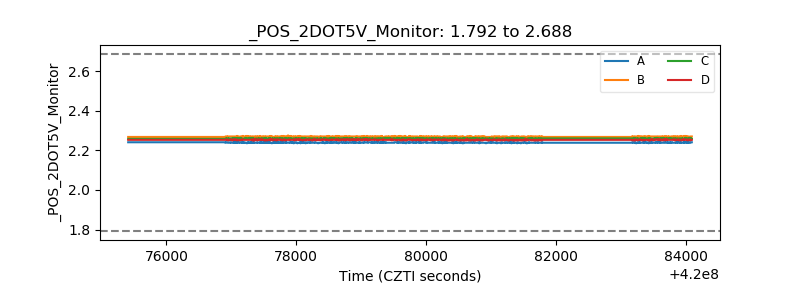 |
| +5 Volts monitor | 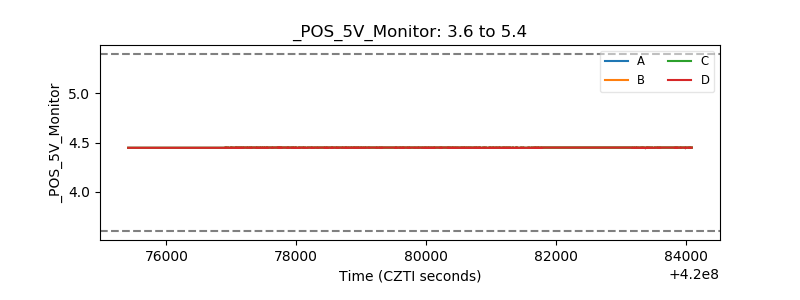 |
| _ROLL_ROT | 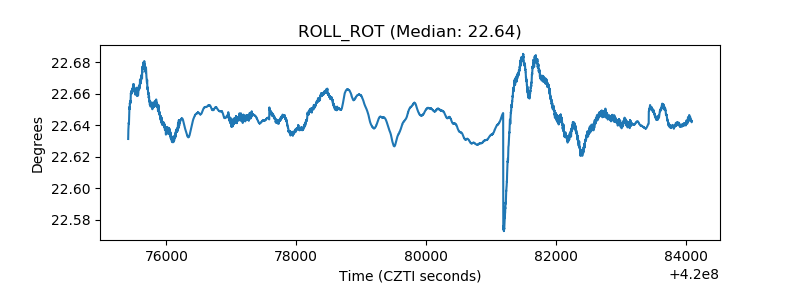 |
| _Roll_DEC | 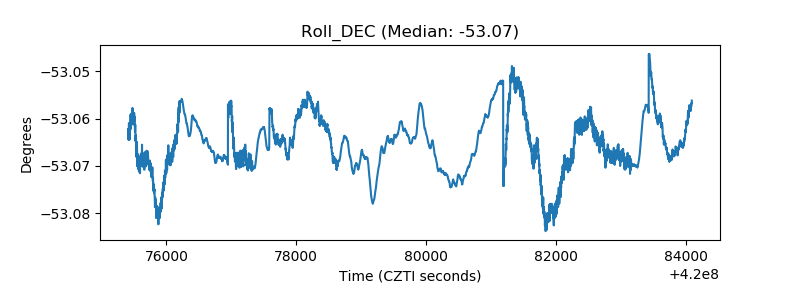 |
| _Roll_RA | 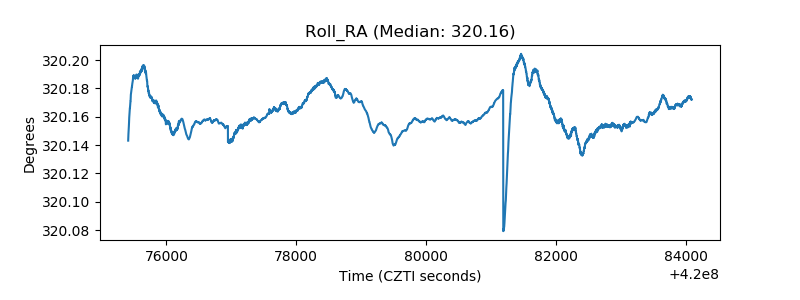 |
| Veto Counter | 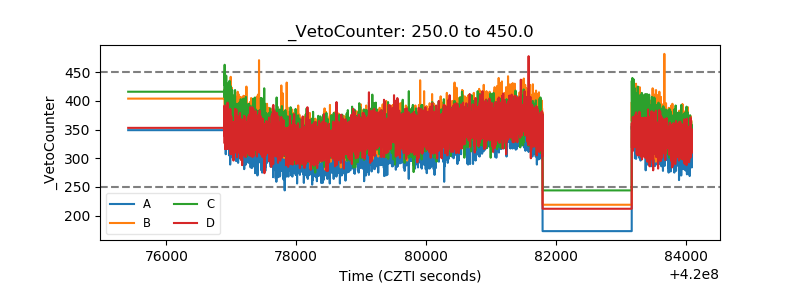 |