| Param | Original file | Final file |
|---|---|---|
| Filename | modeM0/AS1A12_052T04_9000005582_40944cztM0_level2.fits | modeM0/AS1A12_052T04_9000005582_40944cztM0_level2_quad_clean.evt |
| Size (bytes) | 355,253,760 | 99,840,960 |
| Size | 338.8 MB | 95.2 MB |
| Events in quadrant A | 3,167,127 | 669,584 |
| Events in quadrant B | 2,863,907 | 681,035 |
| Events in quadrant C | 2,955,546 | 648,399 |
| Events in quadrant D | 3,682,531 | 592,534 |
| Mode M9 | |||
|---|---|---|---|
| Quadrant | BADHDUFLAG | Total packets | Discarded packets |
| A | 0 | 27 | 0 |
| B | 0 | 27 | 0 |
| C | 0 | 27 | 0 |
| D | 0 | 27 | 0 |
| Mode SS | |||
|---|---|---|---|
| Quadrant | BADHDUFLAG | Total packets | Discarded packets |
| A | 0 | 128 | 0 |
| B | 0 | 128 | 0 |
| C | 0 | 128 | 0 |
| D | 0 | 128 | 0 |
| Mode M0 | |||
|---|---|---|---|
| Quadrant | BADHDUFLAG | Total packets | Discarded packets |
| A | 0 | 13138 | 3 |
| B | 0 | 12870 | 2 |
| C | 0 | 12657 | 2 |
| D | 0 | 15401 | 2 |
| Quadrant | Total seconds | Saturated seconds | Saturation percentage |
|---|---|---|---|
| A | 6179 | 13 | 0.210390% |
| B | 6179 | 21 | 0.339861% |
| C | 6179 | 26 | 0.420780% |
| D | 6179 | 203 | 3.285321% |
Noise dominated data is calculated using 1-second bins in cleaned event files. If a bin has >2000 counts, and if more than 50% of those come from <1% of pixels, then it is considered to be noise-dominated and hence unusable.
| Quadrant | # 1 sec bins | Bins with >0 counts | Bins with >2000 counts | High rate bins dominated by noise | Noise dominated (total time) | Noise dominated (detector-on time) | Marked lightcurve |
|---|---|---|---|---|---|---|---|
| A | 8834 | 6181 | 3 | 3 | 0.03% | 0.05% | 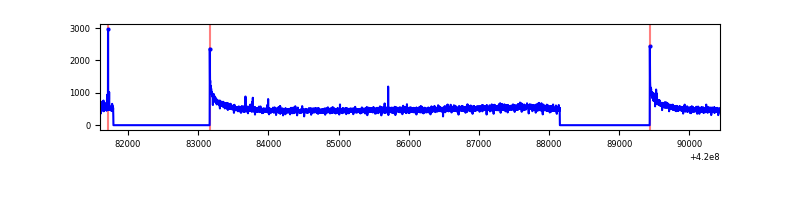 |
| B | 8834 | 6181 | 8 | 8 | 0.09% | 0.13% | 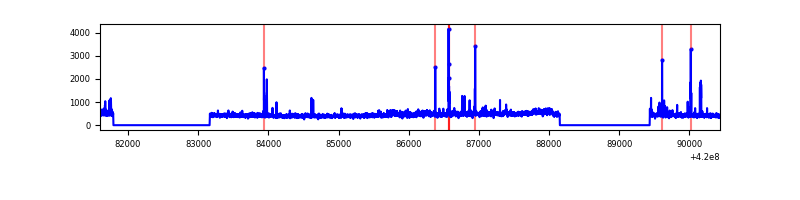 |
| C | 8834 | 6181 | 21 | 21 | 0.24% | 0.34% | 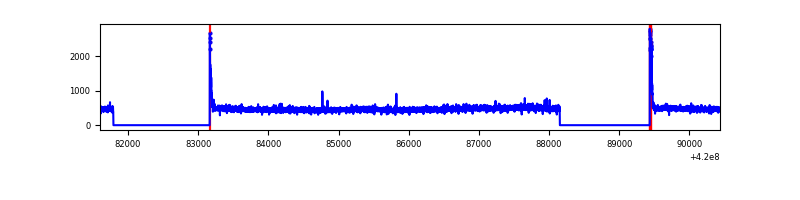 |
| D | 8834 | 6181 | 170 | 170 | 1.92% | 2.75% | 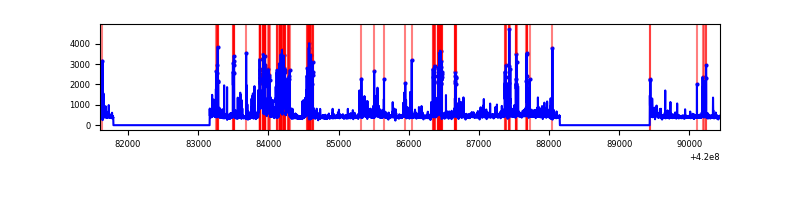 |
Top three noisy pixels from each quadrant. If the there are fewer than three noisy pixels in the level2.evt file, extra rows are filled as -1
| Pixel properties | Quadrant properties | ||||||
|---|---|---|---|---|---|---|---|
| Quadrant | DetID | PixID | Counts | Sigma | Mean | Median | Sigma |
| A | 10 | 83 | 560338 | 4067.33 | 668 | 653 | 137.6 |
| A | 13 | 248 | 12140 | 83.48 | 668 | 653 | 137.6 |
| A | 13 | 254 | 7990 | 53.32 | 668 | 653 | 137.6 |
| B | 5 | 255 | 112130 | 858.77 | 662 | 642 | 129.8 |
| B | 0 | 229 | 96924 | 741.64 | 662 | 642 | 129.8 |
| B | 0 | 190 | 35124 | 265.61 | 662 | 642 | 129.8 |
| C | 15 | 214 | 287319 | 1871.37 | 653 | 656 | 153.2 |
| C | 0 | 10 | 90325 | 585.37 | 653 | 656 | 153.2 |
| C | 14 | 83 | 24409 | 155.06 | 653 | 656 | 153.2 |
| D | 13 | 249 | 538852 | 3400.92 | 646 | 628 | 158.3 |
| D | 2 | 249 | 249995 | 1575.69 | 646 | 628 | 158.3 |
| D | 13 | 171 | 153714 | 967.32 | 646 | 628 | 158.3 |
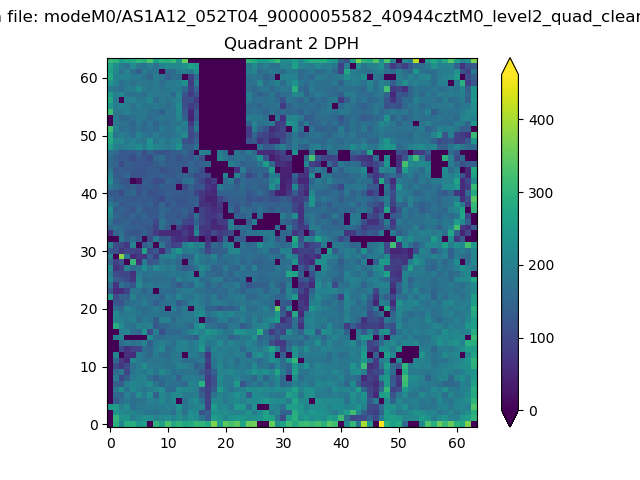
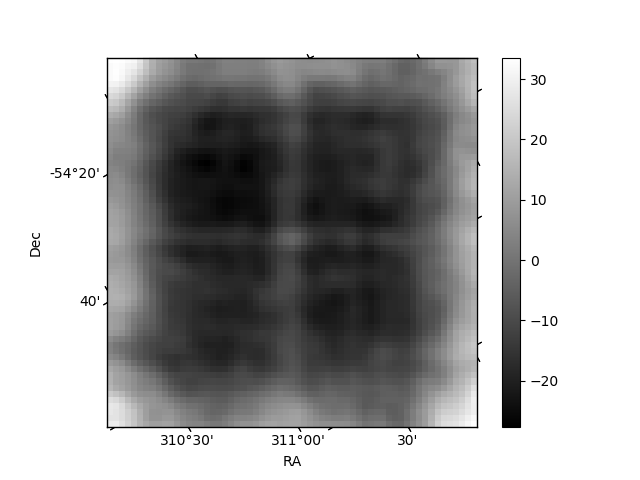
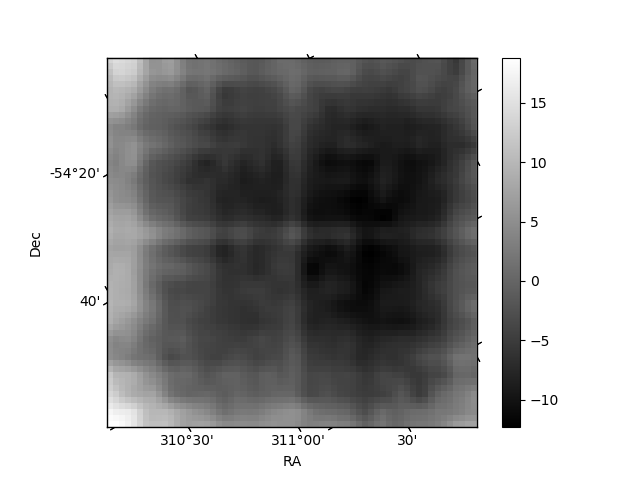
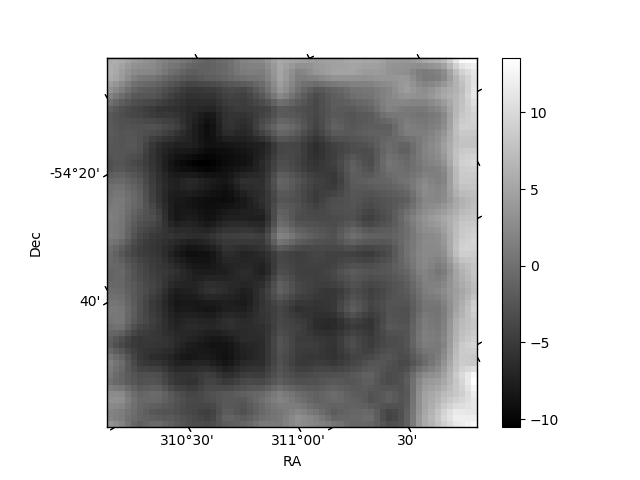
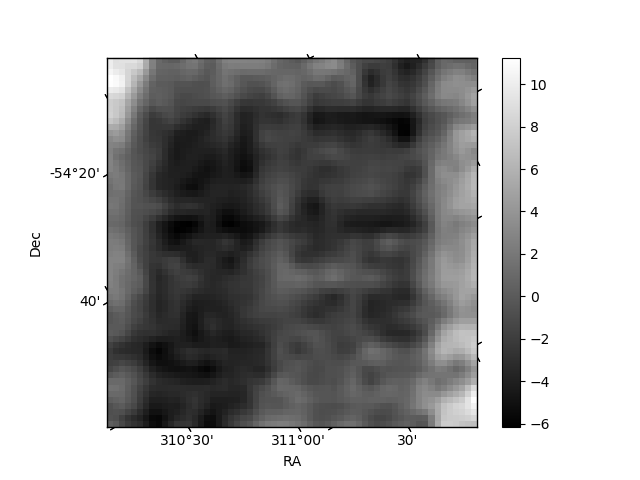
Histogram calculated using DETX and DETY for each event in the final _common_clean file
| Quadrant A | 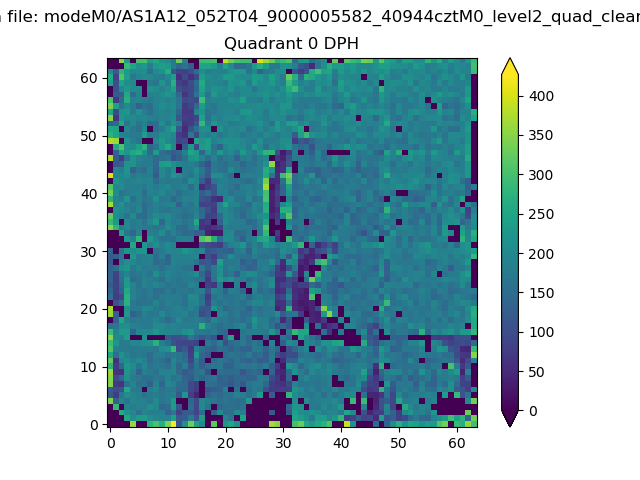 |
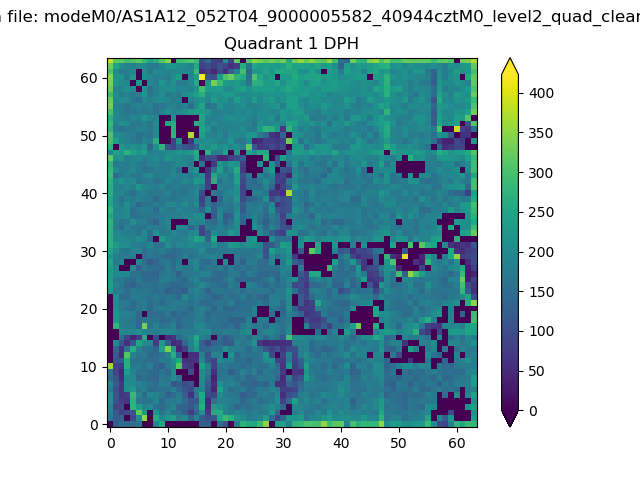 |
Quadrant B |
|---|---|---|---|
| Quadrant D | 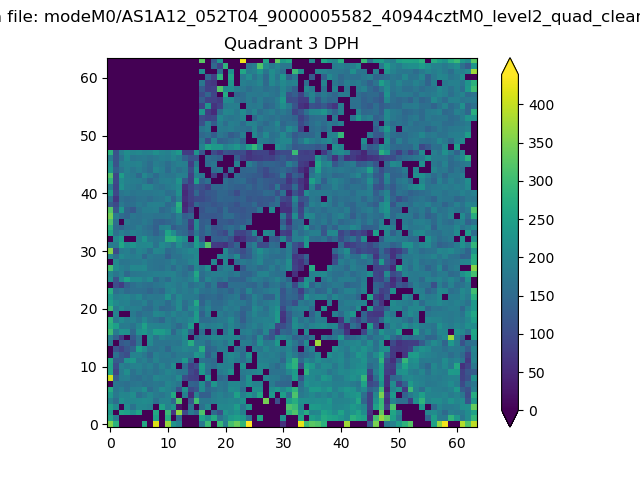 |
 |
Quadrant C |
| Plot type | Count rate plots | Images |
|---|---|---|
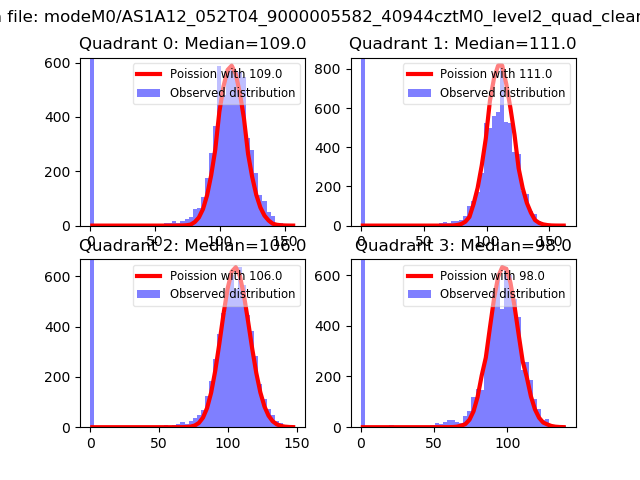
| Comparison with Poisson distribution Blue bars denote a histogram of data divided into 1 sec bins. Red curve is a Poisson curve with rate = median count rate of data. |
 |
 |
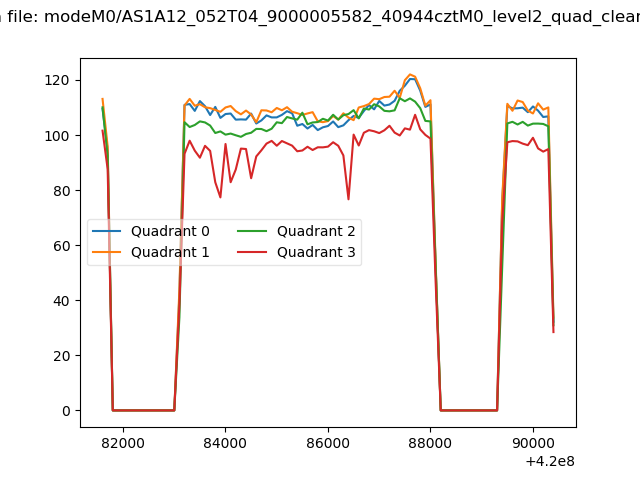
| Quadrant-wise count rates Data is divided into 100 sec bins |
 |
|
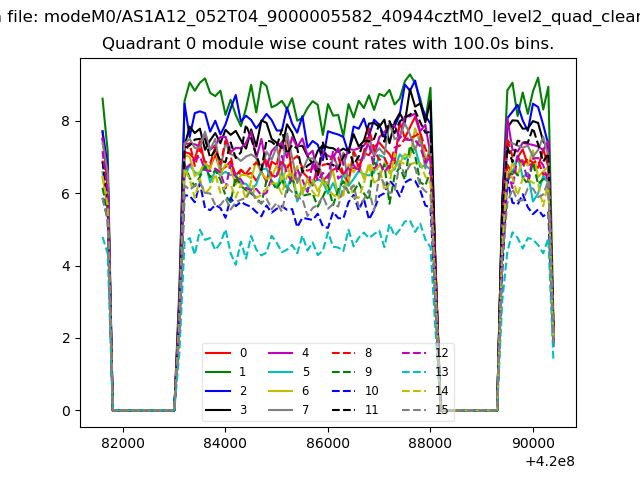
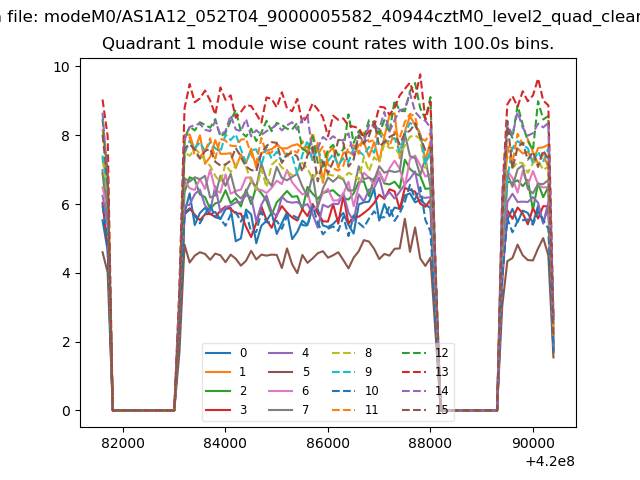
| Module-wise count rates for Quadrant A Data is divided into 100 sec bins |
 |
 |
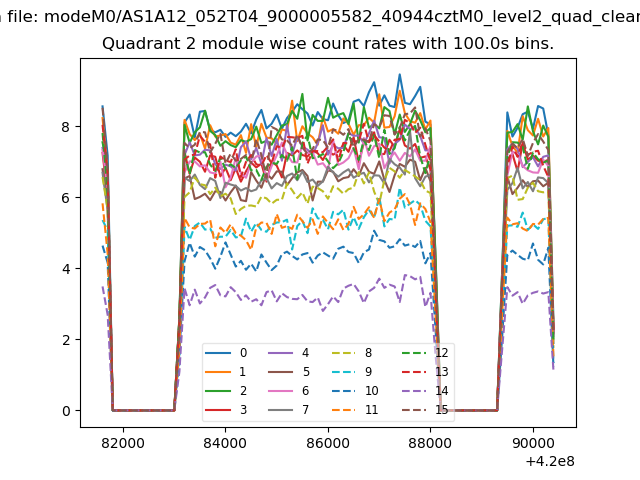
| Module-wise count rates for Quadrant B Data is divided into 100 sec bins |
 |
 |
| Module-wise count rates for Quadrant C Data is divided into 100 sec bins |
 |
 |
| Module-wise count rates for Quadrant D Data is divided into 100 sec bins |
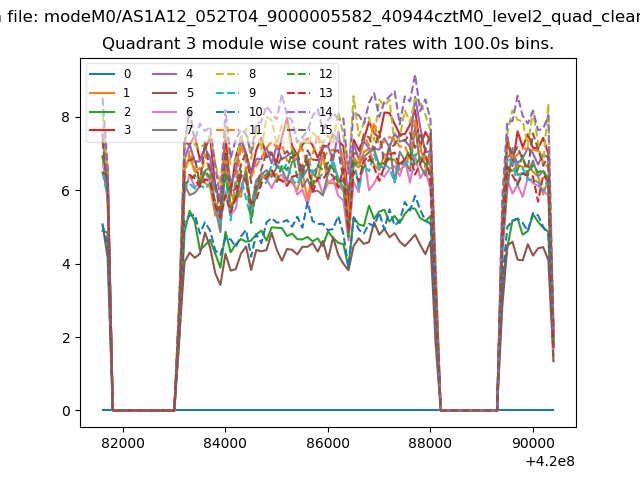 |
 |
| Parameter | Plot |
|---|---|
| CZT HV Monitor | 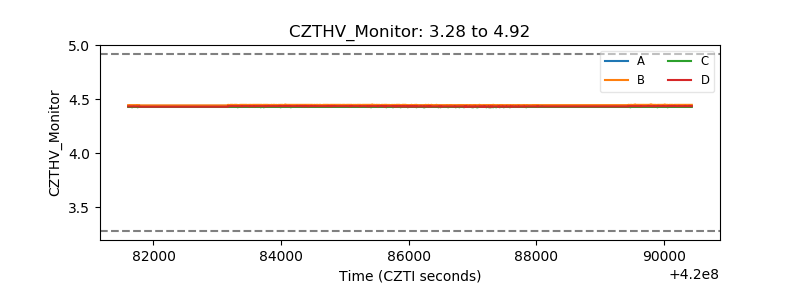 |
| D_VDD | 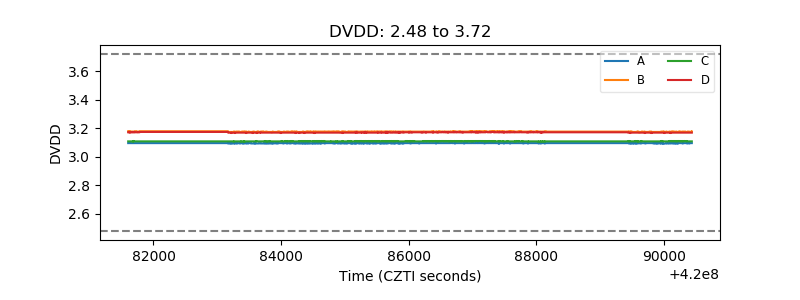 |
| Temperature 1 | 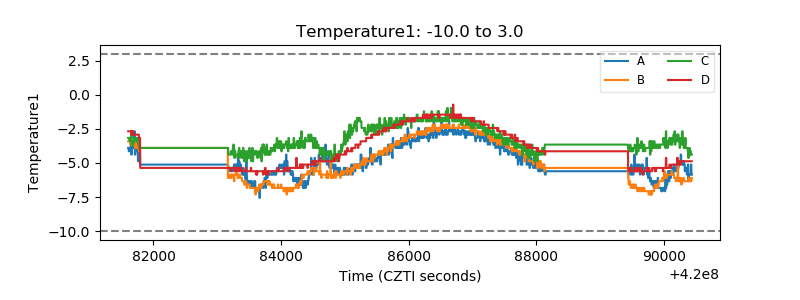 |
| Veto HV Monitor | 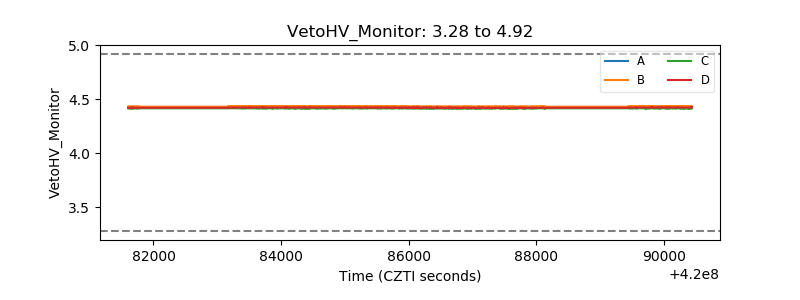 |
| Veto LLD | 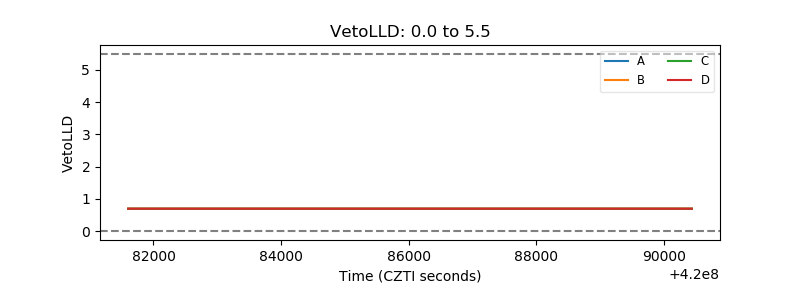 |
| Alpha Counter | 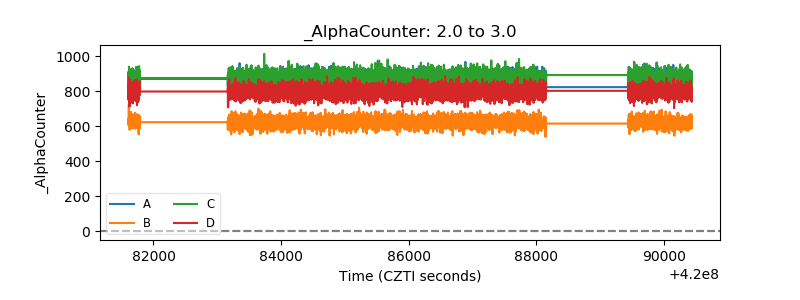 |
| _CPM_Rate | 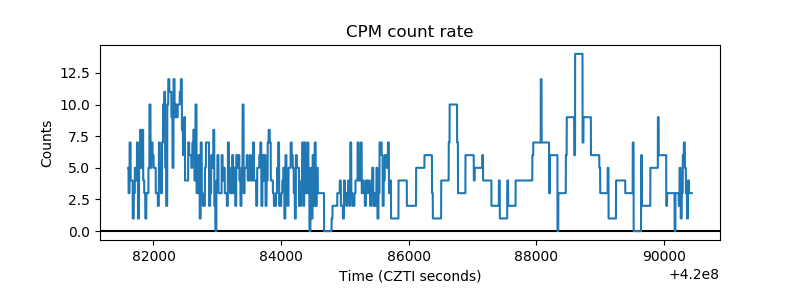 |
| CZT Counter | 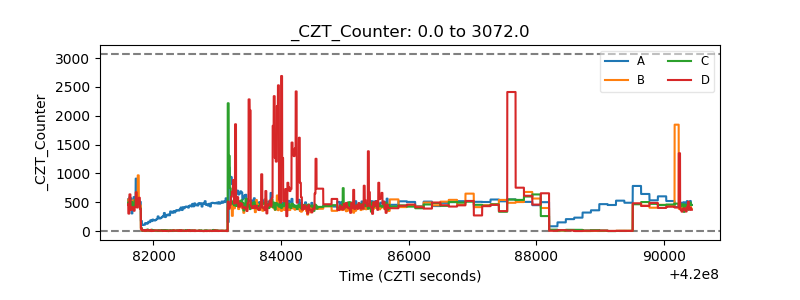 |
| +2.5 Volts monitor |  |
| +5 Volts monitor | 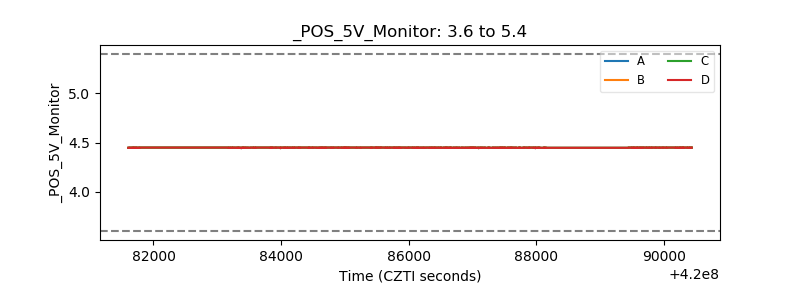 |
| _ROLL_ROT | 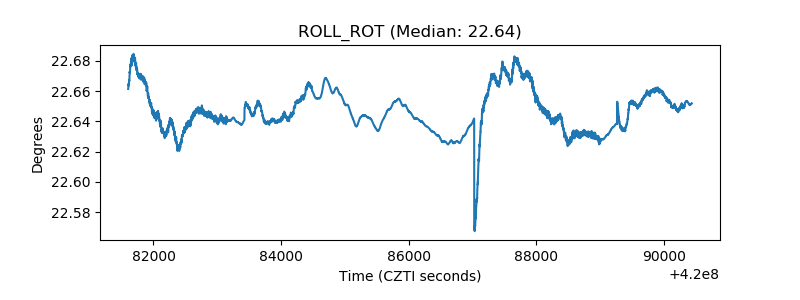 |
| _Roll_DEC | 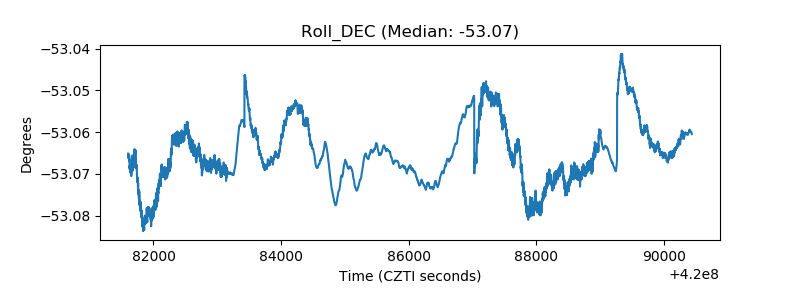 |
| _Roll_RA | 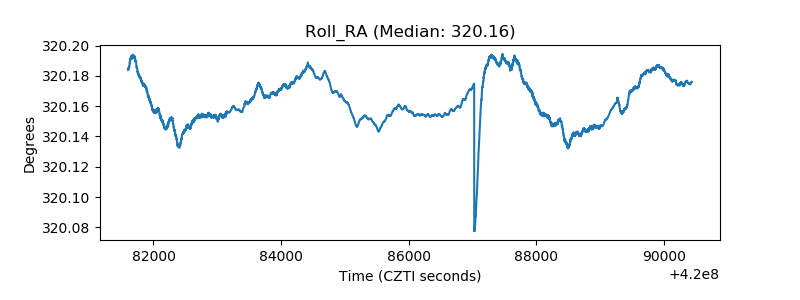 |
| Veto Counter | 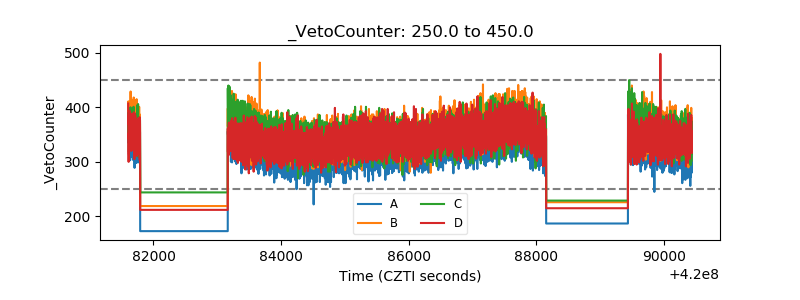 |