| Param | Original file | Final file |
|---|---|---|
| Filename | modeM0/AS1A12_052T04_9000005582_40947cztM0_level2.fits | modeM0/AS1A12_052T04_9000005582_40947cztM0_level2_quad_clean.evt |
| Size (bytes) | 671,705,280 | 187,260,480 |
| Size | 640.6 MB | 178.6 MB |
| Events in quadrant A | 5,953,565 | 1,249,610 |
| Events in quadrant B | 5,221,390 | 1,275,915 |
| Events in quadrant C | 5,729,652 | 1,210,060 |
| Events in quadrant D | 7,047,720 | 1,121,538 |
| Mode M9 | |||
|---|---|---|---|
| Quadrant | BADHDUFLAG | Total packets | Discarded packets |
| A | 0 | 39 | 0 |
| B | 0 | 39 | 0 |
| C | 0 | 39 | 0 |
| D | 0 | 39 | 0 |
| Mode SS | |||
|---|---|---|---|
| Quadrant | BADHDUFLAG | Total packets | Discarded packets |
| A | 0 | 238 | 0 |
| B | 0 | 238 | 0 |
| C | 0 | 238 | 0 |
| D | 0 | 238 | 0 |
| Mode M0 | |||
|---|---|---|---|
| Quadrant | BADHDUFLAG | Total packets | Discarded packets |
| A | 0 | 24733 | 4 |
| B | 0 | 24164 | 3 |
| C | 0 | 24292 | 3 |
| D | 0 | 29268 | 3 |
| Quadrant | Total seconds | Saturated seconds | Saturation percentage |
|---|---|---|---|
| A | 11754 | 15 | 0.127616% |
| B | 11754 | 57 | 0.484941% |
| C | 11754 | 73 | 0.621065% |
| D | 11754 | 291 | 2.475753% |
Noise dominated data is calculated using 1-second bins in cleaned event files. If a bin has >2000 counts, and if more than 50% of those come from <1% of pixels, then it is considered to be noise-dominated and hence unusable.
| Quadrant | # 1 sec bins | Bins with >0 counts | Bins with >2000 counts | High rate bins dominated by noise | Noise dominated (total time) | Noise dominated (detector-on time) | Marked lightcurve |
|---|---|---|---|---|---|---|---|
| A | 14470 | 11756 | 7 | 7 | 0.05% | 0.06% | 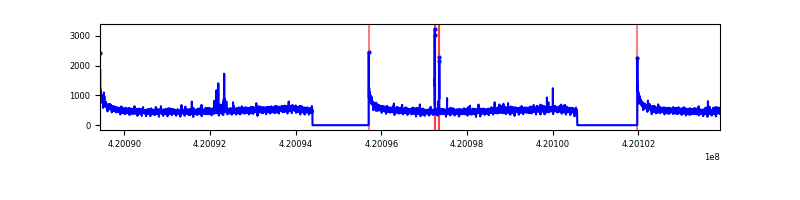 |
| B | 14470 | 11756 | 26 | 26 | 0.18% | 0.22% | 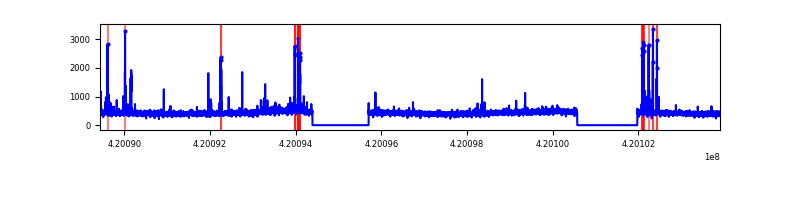 |
| C | 14470 | 11756 | 63 | 63 | 0.44% | 0.54% | 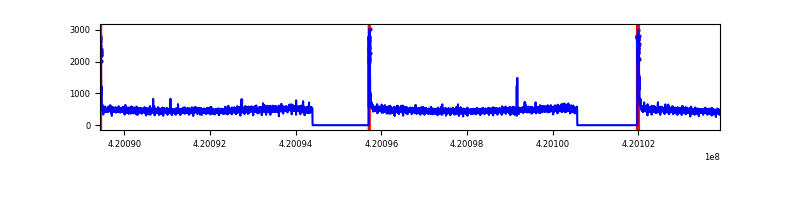 |
| D | 14470 | 11756 | 238 | 238 | 1.64% | 2.02% | 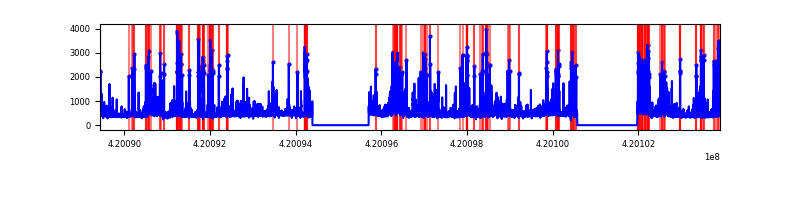 |
Top three noisy pixels from each quadrant. If the there are fewer than three noisy pixels in the level2.evt file, extra rows are filled as -1
| Pixel properties | Quadrant properties | ||||||
|---|---|---|---|---|---|---|---|
| Quadrant | DetID | PixID | Counts | Sigma | Mean | Median | Sigma |
| A | 10 | 83 | 961081 | 3716.57 | 1270 | 1242 | 258.3 |
| A | 12 | 189 | 36868 | 137.94 | 1270 | 1242 | 258.3 |
| A | 10 | 255 | 22740 | 83.24 | 1270 | 1242 | 258.3 |
| B | 5 | 255 | 203945 | 833.77 | 1252 | 1212 | 243.2 |
| B | 0 | 190 | 48230 | 193.37 | 1252 | 1212 | 243.2 |
| B | 12 | 111 | 30957 | 122.33 | 1252 | 1212 | 243.2 |
| C | 15 | 214 | 541883 | 1887.25 | 1238 | 1243 | 286.5 |
| C | 0 | 10 | 220595 | 765.71 | 1238 | 1243 | 286.5 |
| C | 14 | 83 | 97420 | 335.73 | 1238 | 1243 | 286.5 |
| D | 13 | 249 | 1456470 | 4842.99 | 1237 | 1201 | 300.5 |
| D | 2 | 249 | 294642 | 976.54 | 1237 | 1201 | 300.5 |
| D | 1 | 52 | 119571 | 393.92 | 1237 | 1201 | 300.5 |
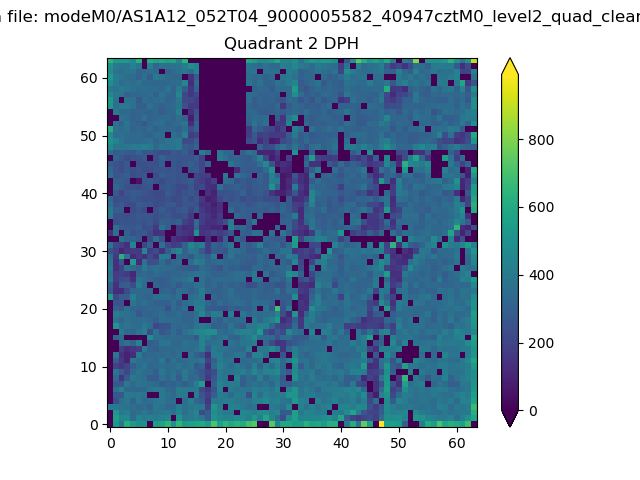
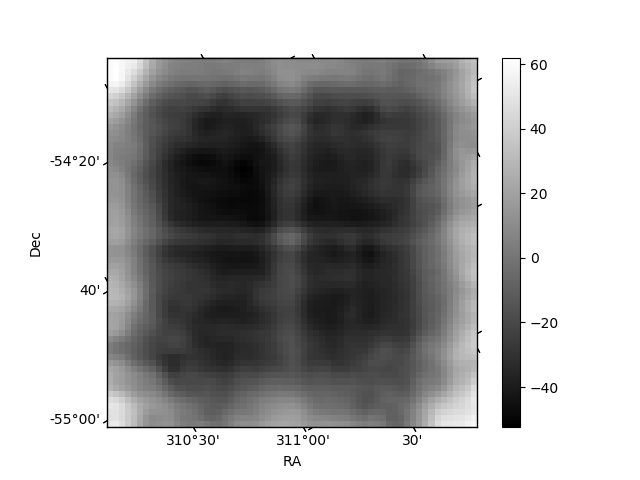
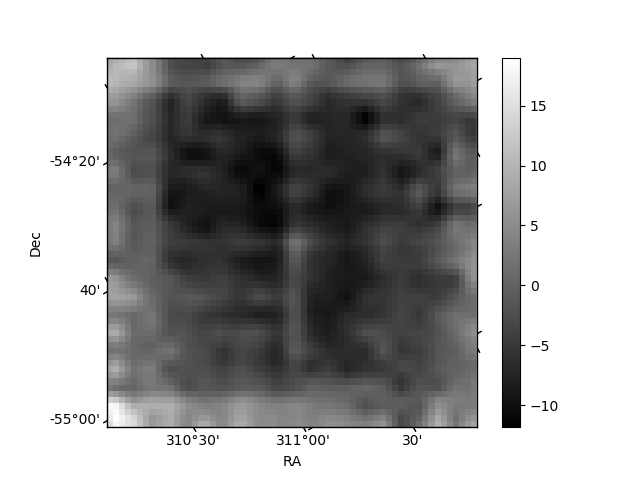
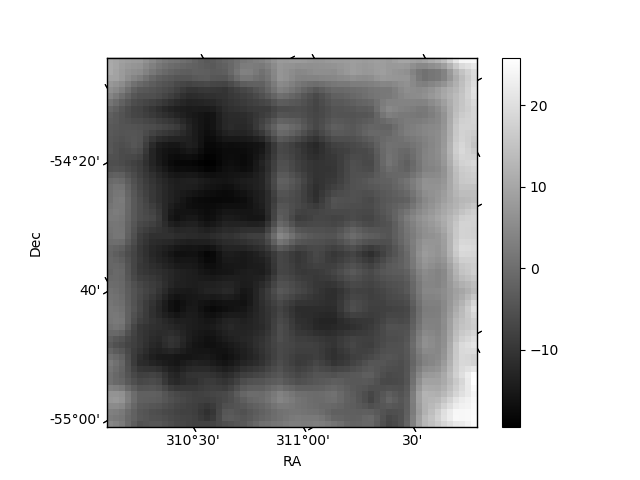
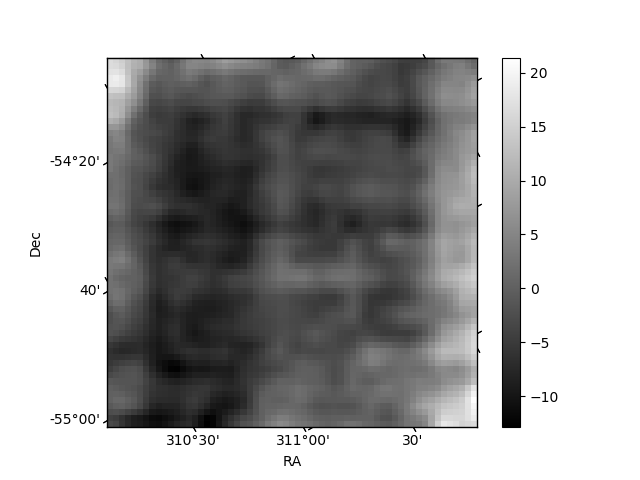
Histogram calculated using DETX and DETY for each event in the final _common_clean file
| Quadrant A | 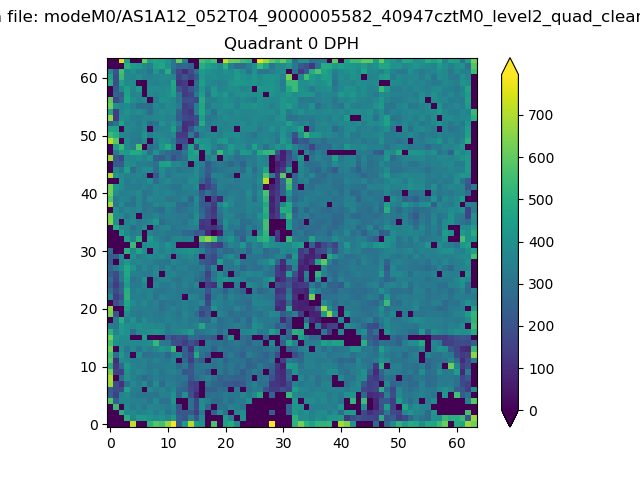 |
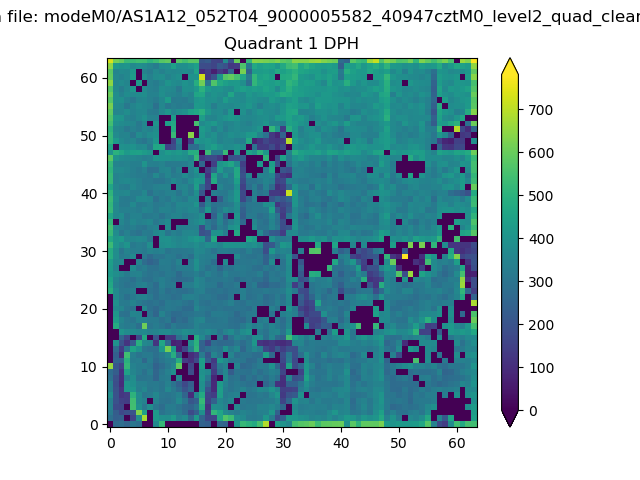 |
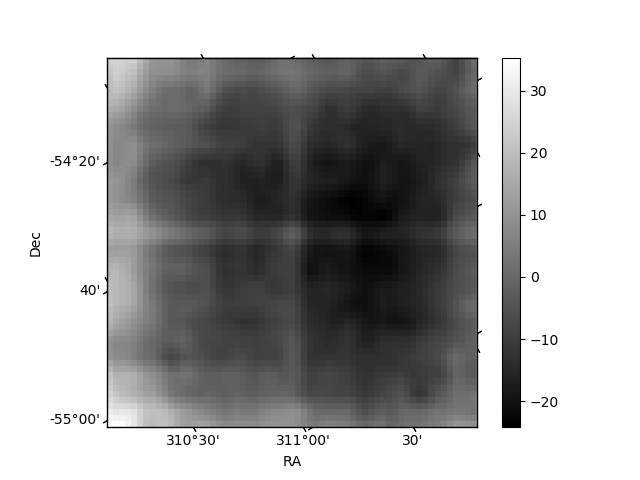
Quadrant B |
|---|---|---|---|
| Quadrant D | 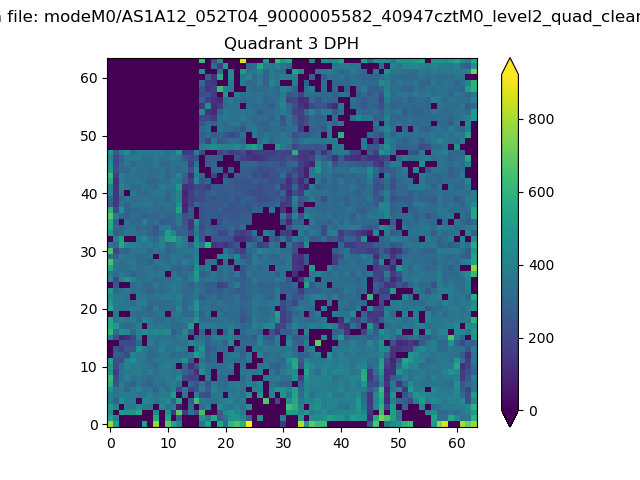 |
 |
Quadrant C |
| Plot type | Count rate plots | Images |
|---|---|---|
| Comparison with Poisson distribution Blue bars denote a histogram of data divided into 1 sec bins. Red curve is a Poisson curve with rate = median count rate of data. |
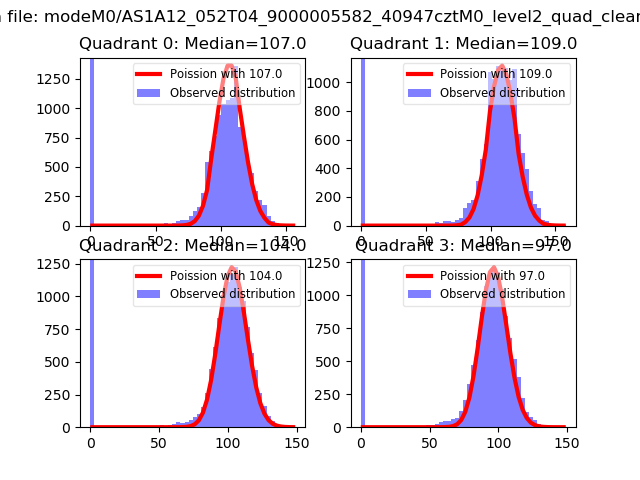 |
 |
| Quadrant-wise count rates Data is divided into 100 sec bins |
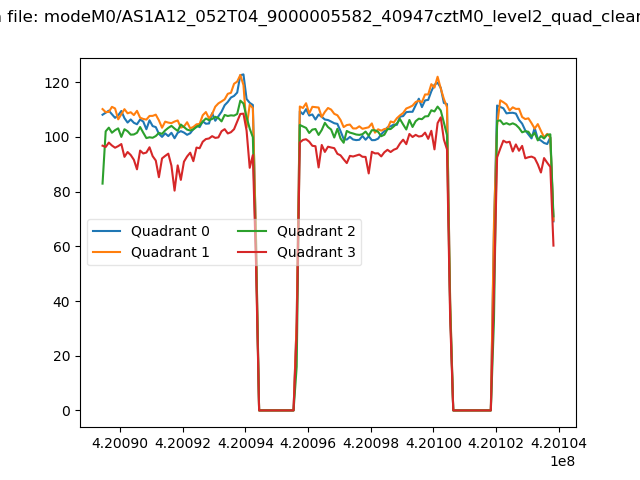 |
|
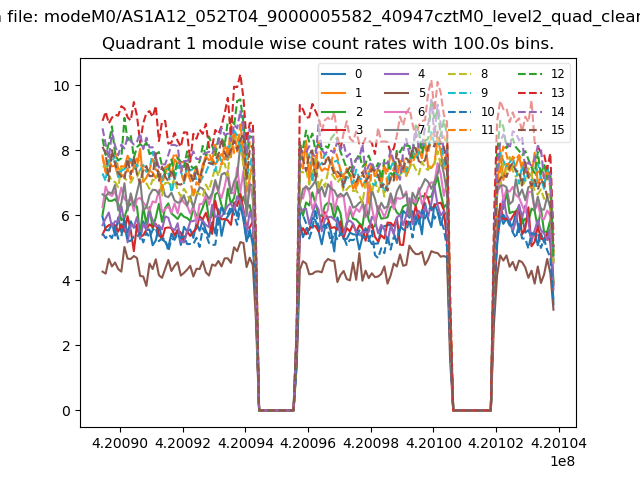
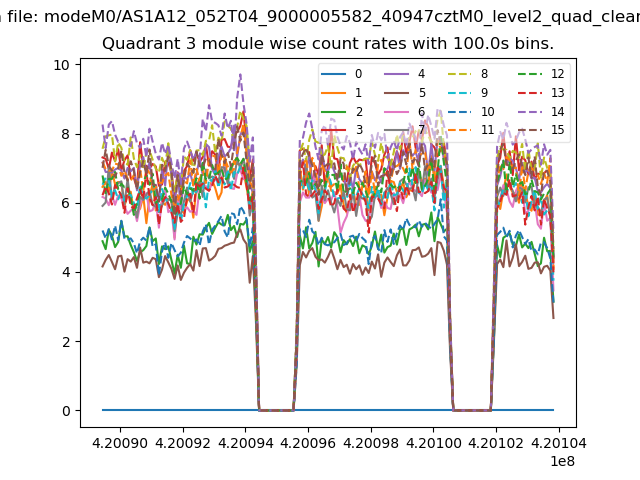
| Module-wise count rates for Quadrant A Data is divided into 100 sec bins |
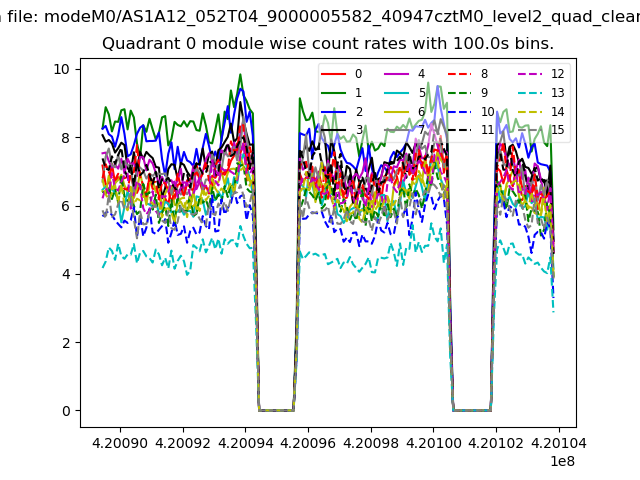 |
 |
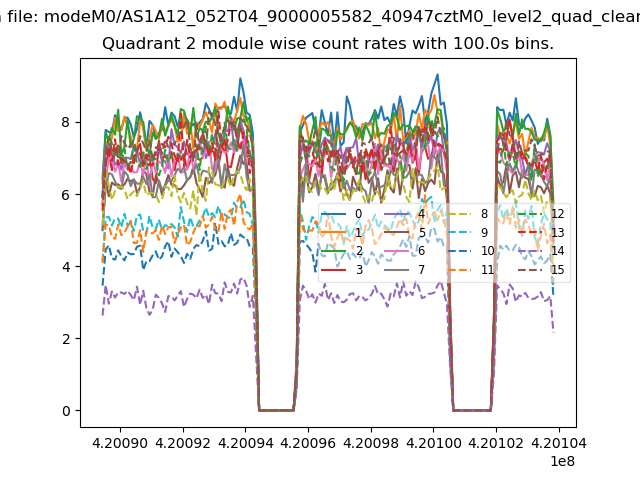
| Module-wise count rates for Quadrant B Data is divided into 100 sec bins |
 |
 |
| Module-wise count rates for Quadrant C Data is divided into 100 sec bins |
 |
 |
| Module-wise count rates for Quadrant D Data is divided into 100 sec bins |
 |
 |
| Parameter | Plot |
|---|---|
| CZT HV Monitor |  |
| D_VDD | 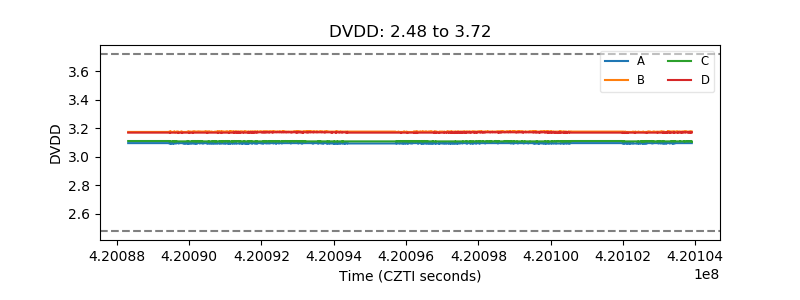 |
| Temperature 1 | 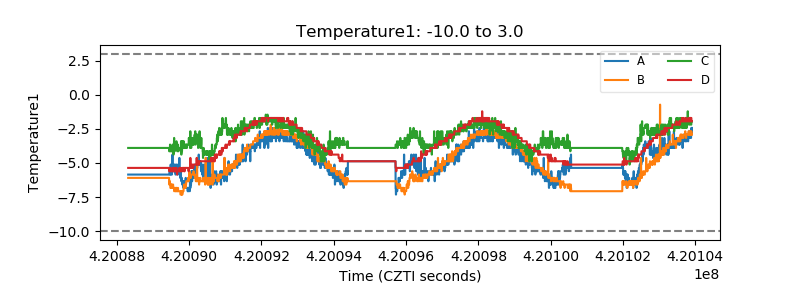 |
| Veto HV Monitor | 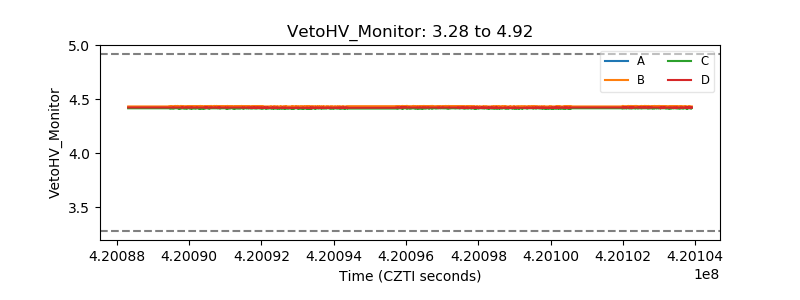 |
| Veto LLD | 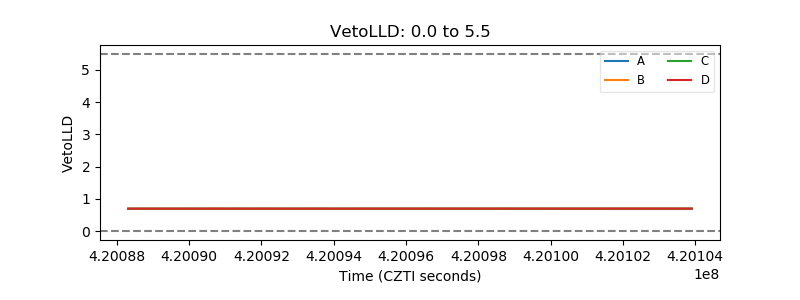 |
| Alpha Counter | 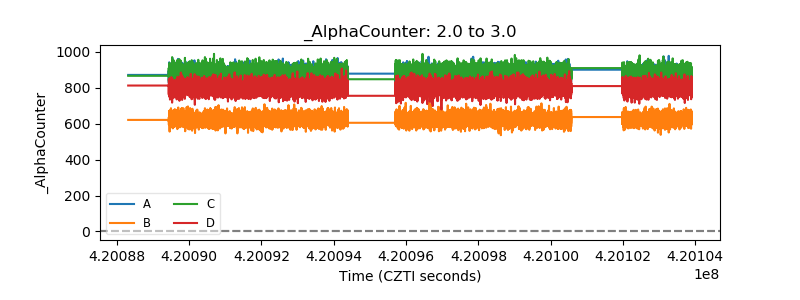 |
| _CPM_Rate | 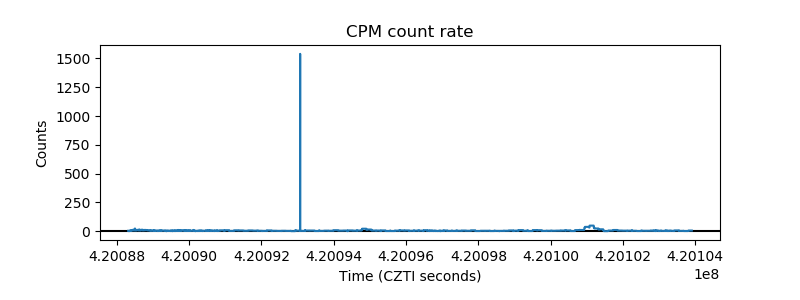 |
| CZT Counter | 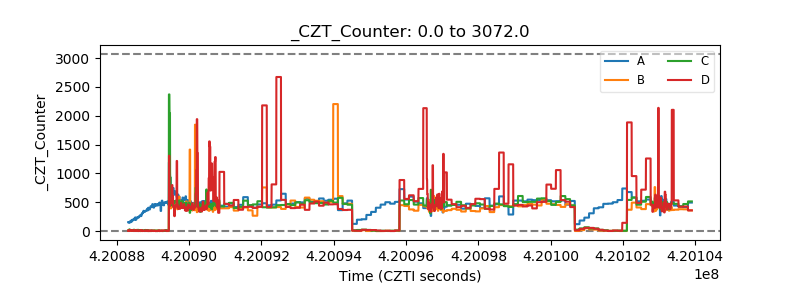 |
| +2.5 Volts monitor | 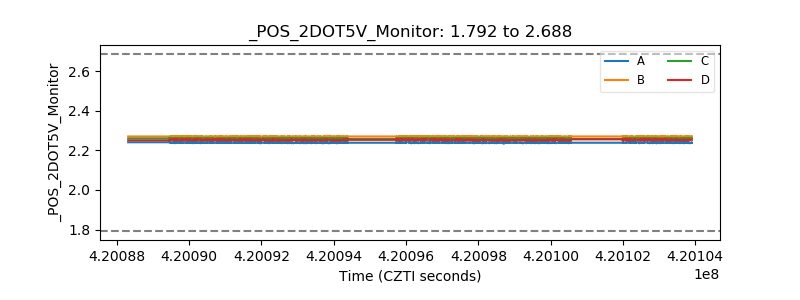 |
| +5 Volts monitor | 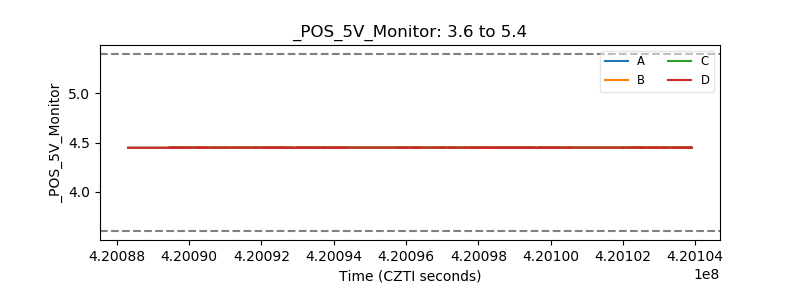 |
| _ROLL_ROT | 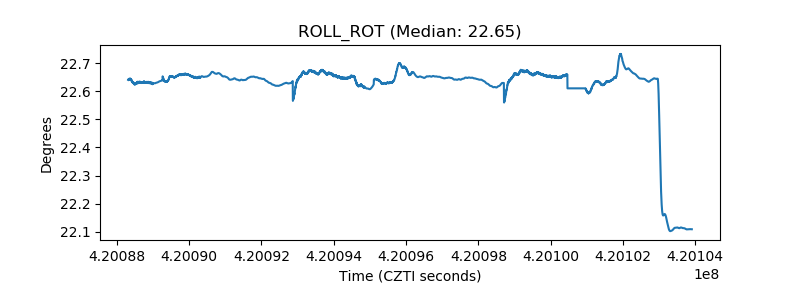 |
| _Roll_DEC | 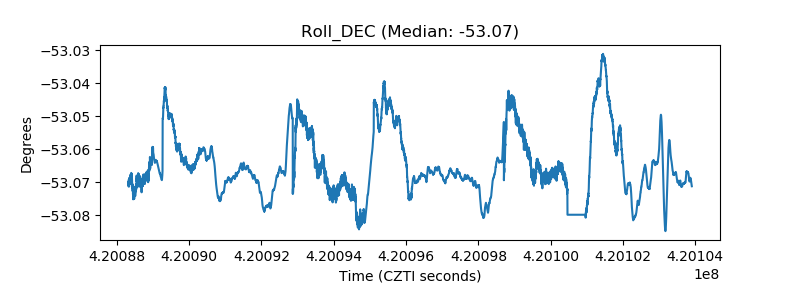 |
| _Roll_RA | 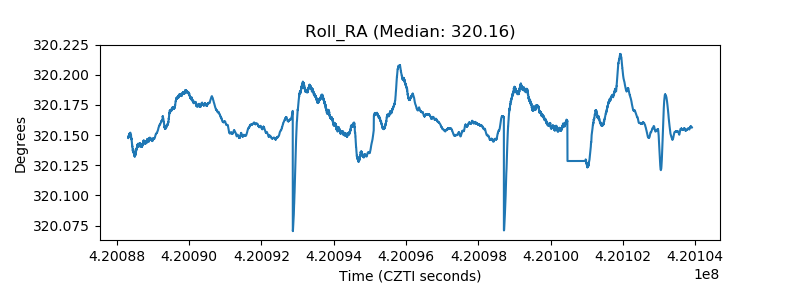 |
| Veto Counter | 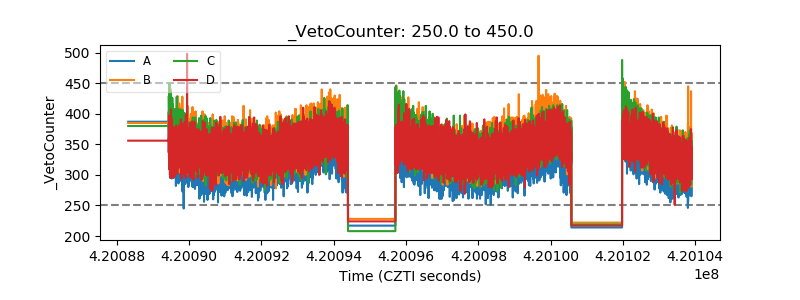 |