| Param | Original file | Final file |
|---|---|---|
| Filename | modeM0/AS1A12_052T04_9000005582_40950cztM0_level2.fits | modeM0/AS1A12_052T04_9000005582_40950cztM0_level2_quad_clean.evt |
| Size (bytes) | 308,701,440 | 89,763,840 |
| Size | 294.4 MB | 85.6 MB |
| Events in quadrant A | 2,834,560 | 605,658 |
| Events in quadrant B | 2,352,157 | 613,939 |
| Events in quadrant C | 2,647,281 | 584,493 |
| Events in quadrant D | 3,171,264 | 535,873 |
| Mode M9 | |||
|---|---|---|---|
| Quadrant | BADHDUFLAG | Total packets | Discarded packets |
| A | 0 | 19 | 0 |
| B | 0 | 19 | 0 |
| C | 0 | 19 | 0 |
| D | 0 | 20 | 0 |
| Mode SS | |||
|---|---|---|---|
| Quadrant | BADHDUFLAG | Total packets | Discarded packets |
| A | 0 | 108 | 0 |
| B | 0 | 108 | 0 |
| C | 0 | 108 | 0 |
| D | 0 | 108 | 0 |
| Mode M0 | |||
|---|---|---|---|
| Quadrant | BADHDUFLAG | Total packets | Discarded packets |
| A | 0 | 11778 | 3 |
| B | 0 | 10850 | 2 |
| C | 0 | 11327 | 2 |
| D | 0 | 13204 | 2 |
| Quadrant | Total seconds | Saturated seconds | Saturation percentage |
|---|---|---|---|
| A | 5410 | 9 | 0.166359% |
| B | 5410 | 6 | 0.110906% |
| C | 5410 | 46 | 0.850277% |
| D | 5410 | 163 | 3.012939% |
Noise dominated data is calculated using 1-second bins in cleaned event files. If a bin has >2000 counts, and if more than 50% of those come from <1% of pixels, then it is considered to be noise-dominated and hence unusable.
| Quadrant | # 1 sec bins | Bins with >0 counts | Bins with >2000 counts | High rate bins dominated by noise | Noise dominated (total time) | Noise dominated (detector-on time) | Marked lightcurve |
|---|---|---|---|---|---|---|---|
| A | 7173 | 5411 | 1 | 1 | 0.01% | 0.02% | 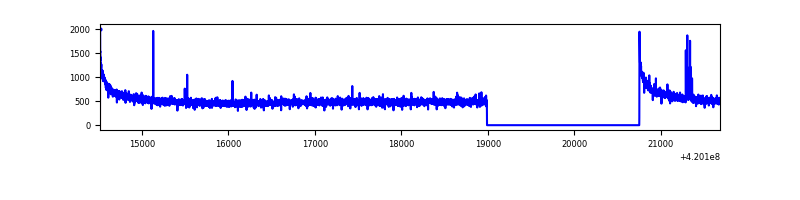 |
| B | 7173 | 5411 | 0 | 0 | 0.00% | 0.00% | 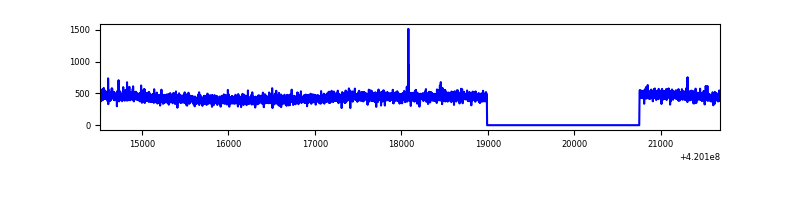 |
| C | 7173 | 5411 | 33 | 33 | 0.46% | 0.61% | 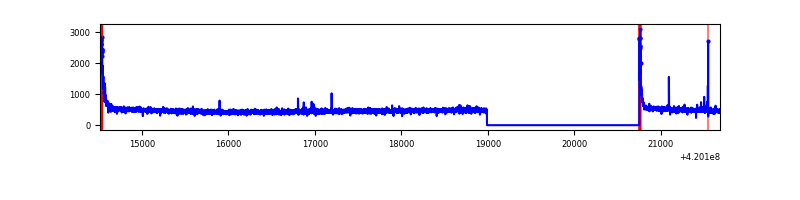 |
| D | 7173 | 5410 | 137 | 137 | 1.91% | 2.53% | 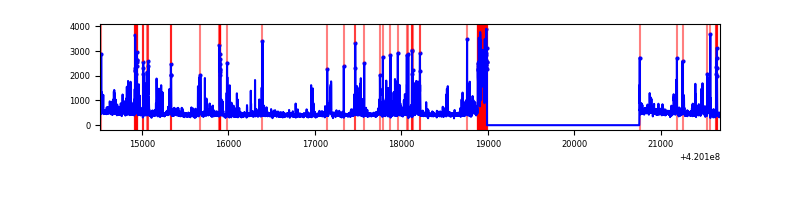 |
Top three noisy pixels from each quadrant. If the there are fewer than three noisy pixels in the level2.evt file, extra rows are filled as -1
| Pixel properties | Quadrant properties | ||||||
|---|---|---|---|---|---|---|---|
| Quadrant | DetID | PixID | Counts | Sigma | Mean | Median | Sigma |
| A | 10 | 83 | 504638 | 4117.41 | 596 | 583 | 122.4 |
| A | 7 | 3 | 15518 | 121.99 | 596 | 583 | 122.4 |
| A | 13 | 254 | 7571 | 57.08 | 596 | 583 | 122.4 |
| B | 3 | 112 | 31827 | 274.45 | 587 | 569 | 113.9 |
| B | 12 | 111 | 14461 | 121.97 | 587 | 569 | 113.9 |
| B | 11 | 111 | 13526 | 113.76 | 587 | 569 | 113.9 |
| C | 15 | 214 | 251359 | 1867.21 | 573 | 576 | 134.3 |
| C | 0 | 10 | 139640 | 1035.4 | 573 | 576 | 134.3 |
| C | 12 | 249 | 17739 | 127.79 | 573 | 576 | 134.3 |
| D | 13 | 249 | 390425 | 2812.19 | 572 | 555 | 138.6 |
| D | 2 | 249 | 281382 | 2025.65 | 572 | 555 | 138.6 |
| D | 12 | 6 | 88785 | 636.42 | 572 | 555 | 138.6 |
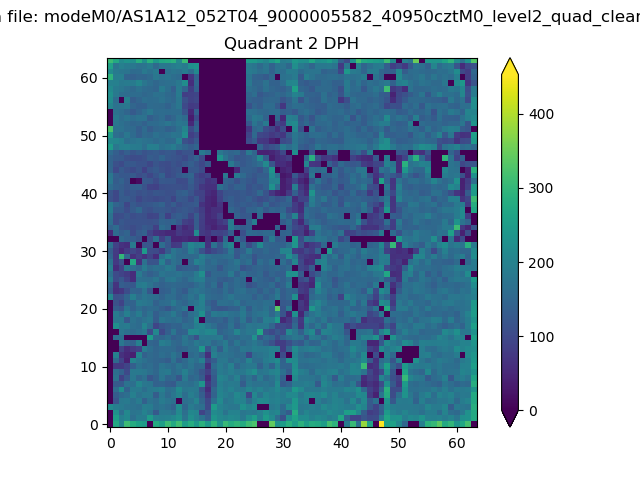
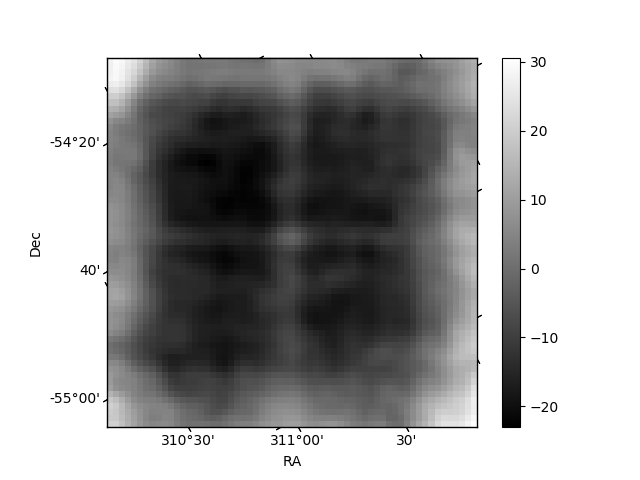
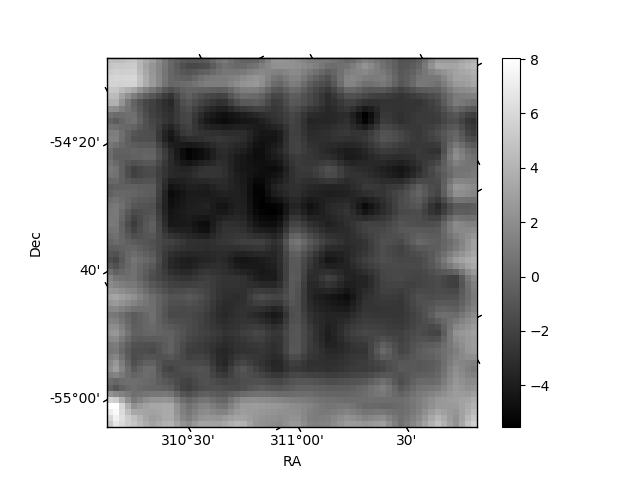
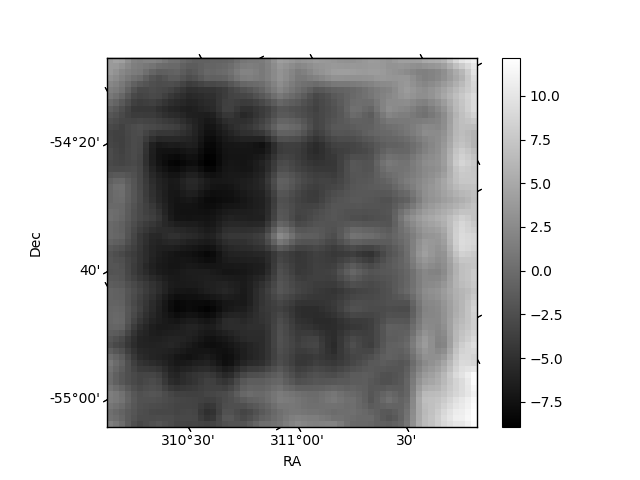
Histogram calculated using DETX and DETY for each event in the final _common_clean file
| Quadrant A | 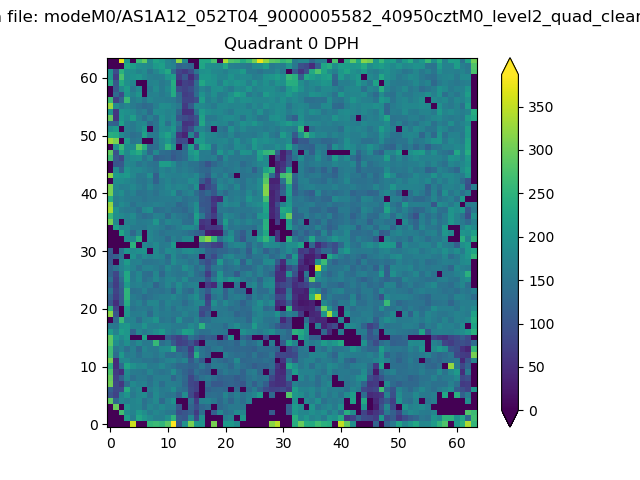 |
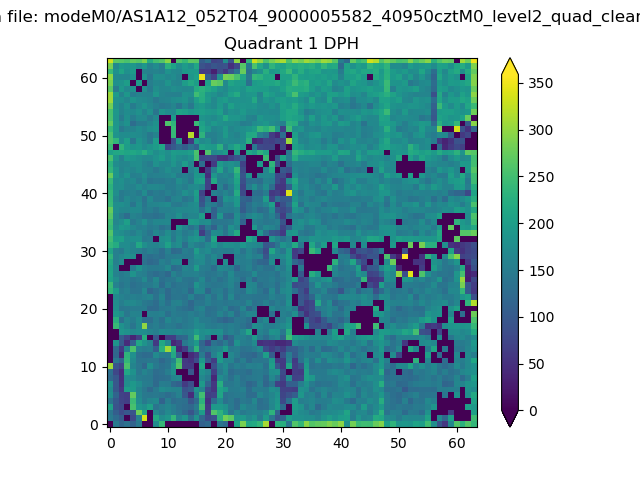 |
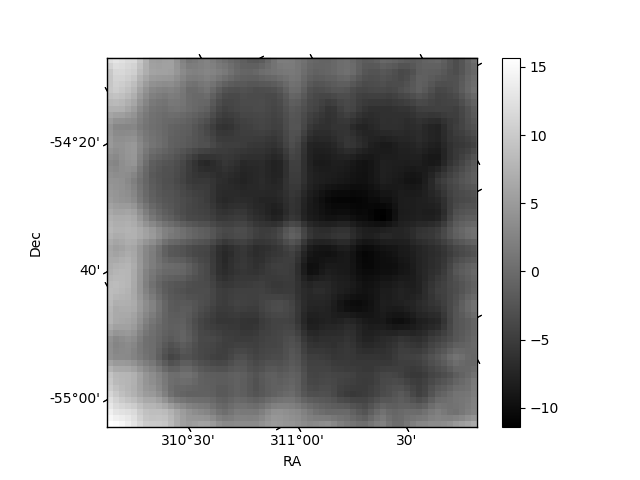
Quadrant B |
|---|---|---|---|
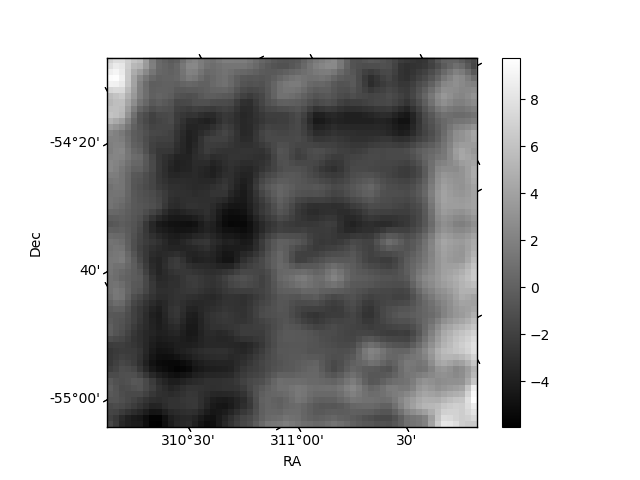
| Quadrant D | 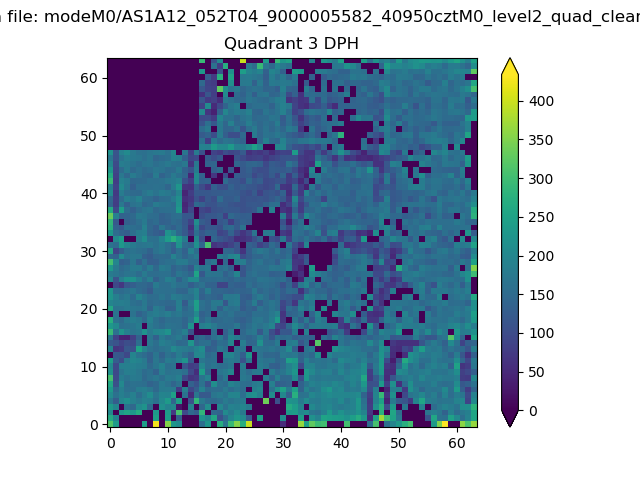 |
 |
Quadrant C |
| Plot type | Count rate plots | Images |
|---|---|---|
| Comparison with Poisson distribution Blue bars denote a histogram of data divided into 1 sec bins. Red curve is a Poisson curve with rate = median count rate of data. |
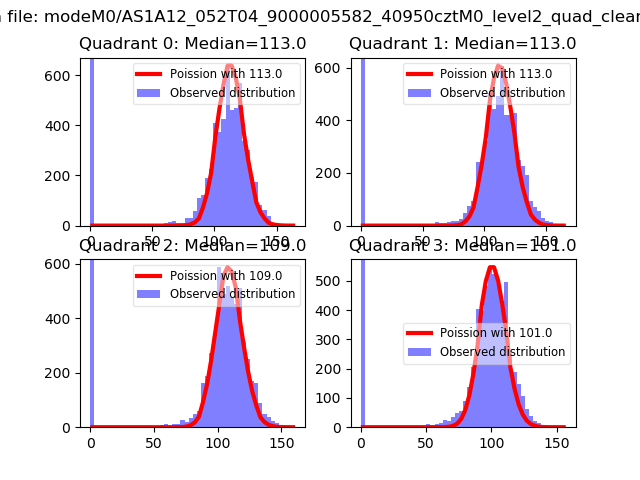 |
 |
| Quadrant-wise count rates Data is divided into 100 sec bins |
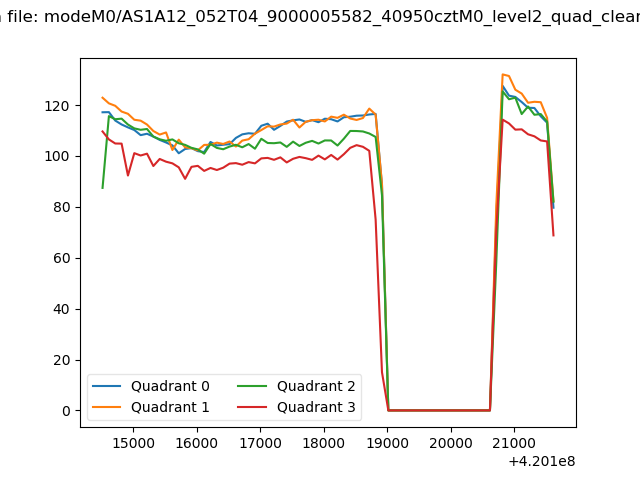 |
|
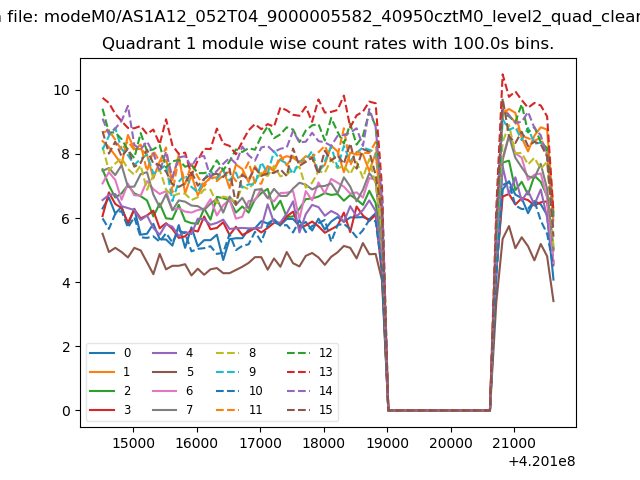
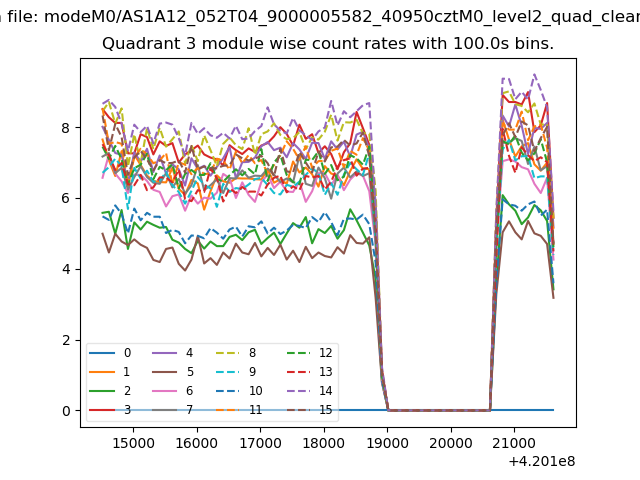
| Module-wise count rates for Quadrant A Data is divided into 100 sec bins |
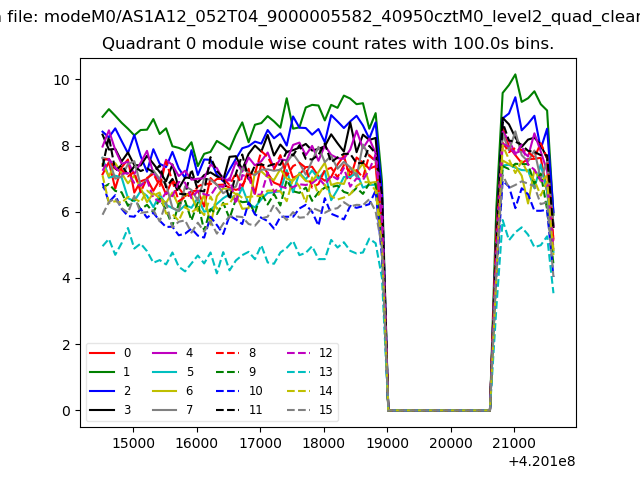 |
 |
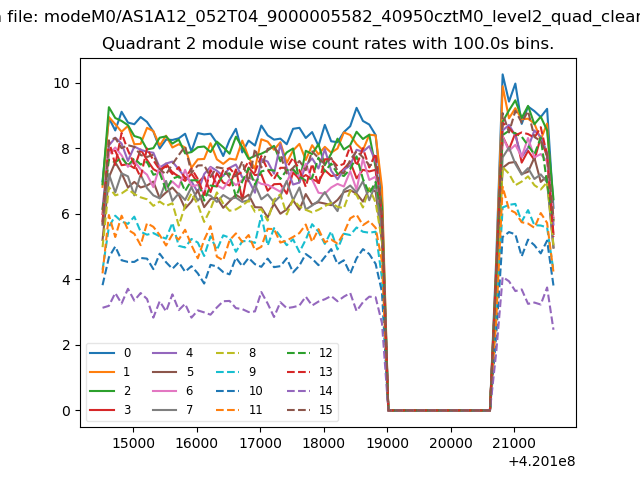
| Module-wise count rates for Quadrant B Data is divided into 100 sec bins |
 |
 |
| Module-wise count rates for Quadrant C Data is divided into 100 sec bins |
 |
 |
| Module-wise count rates for Quadrant D Data is divided into 100 sec bins |
 |
 |
| Parameter | Plot |
|---|---|
| CZT HV Monitor | 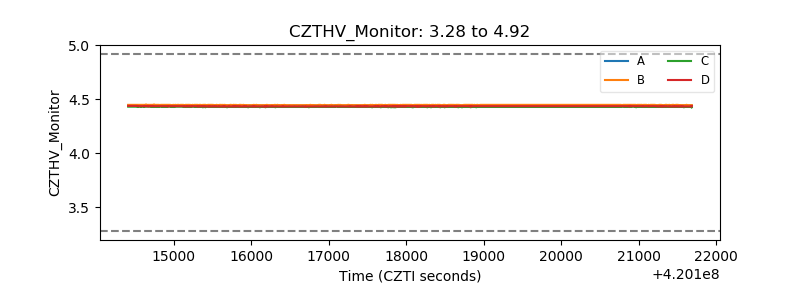 |
| D_VDD | 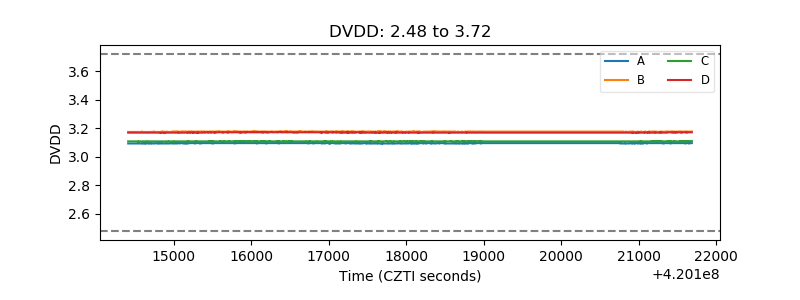 |
| Temperature 1 | 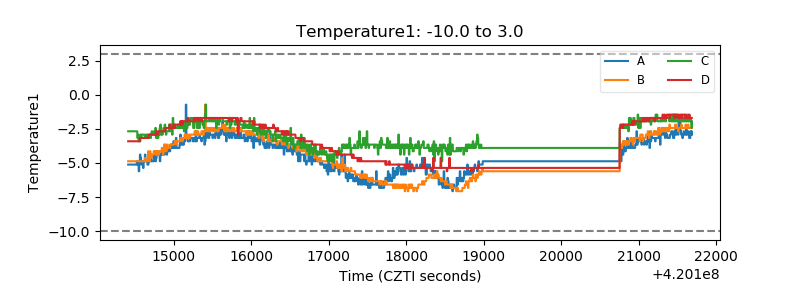 |
| Veto HV Monitor | 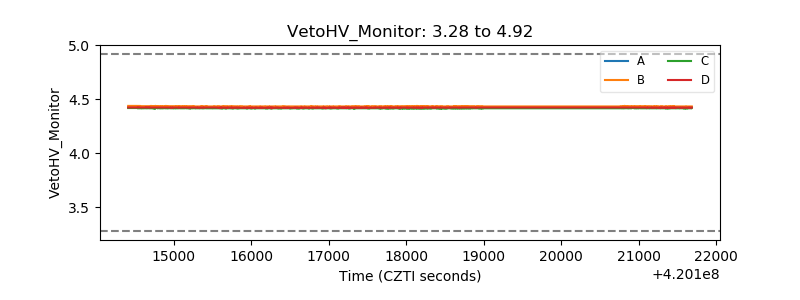 |
| Veto LLD | 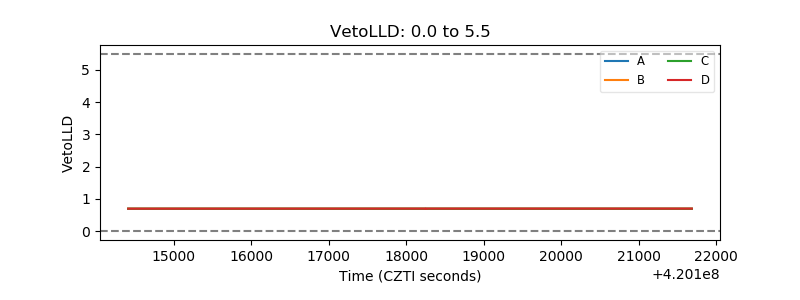 |
| Alpha Counter | 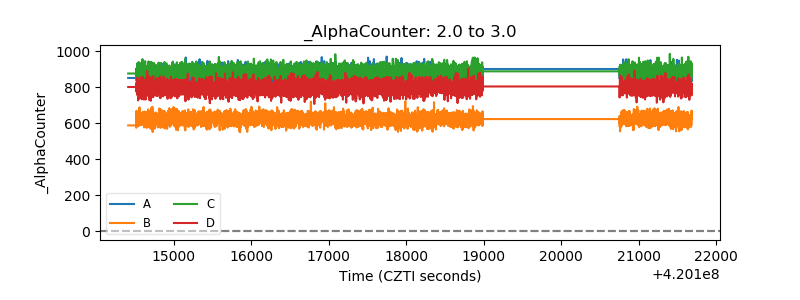 |
| _CPM_Rate |  |
| CZT Counter | 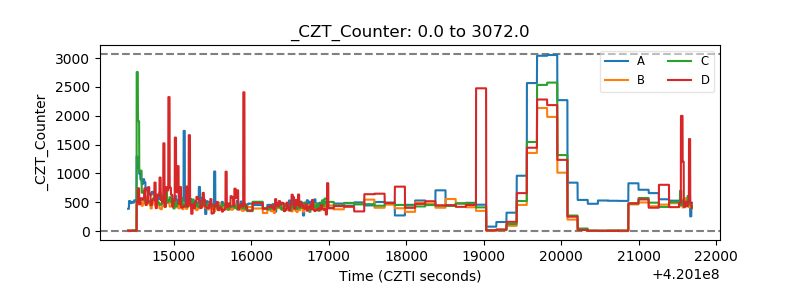 |
| +2.5 Volts monitor | 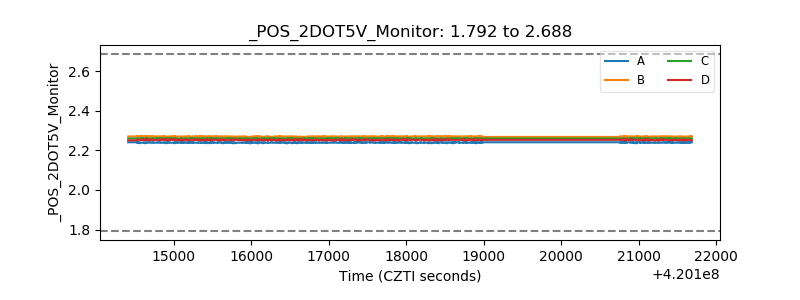 |
| +5 Volts monitor | 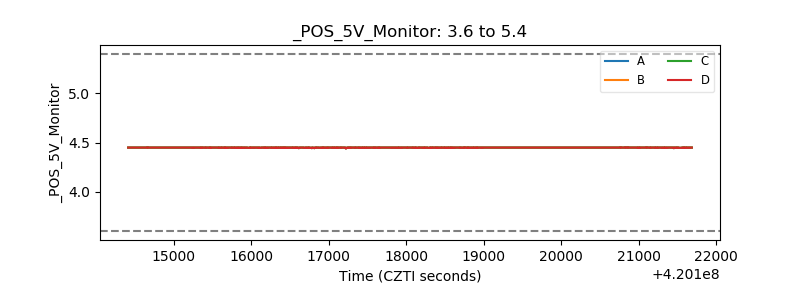 |
| _ROLL_ROT | 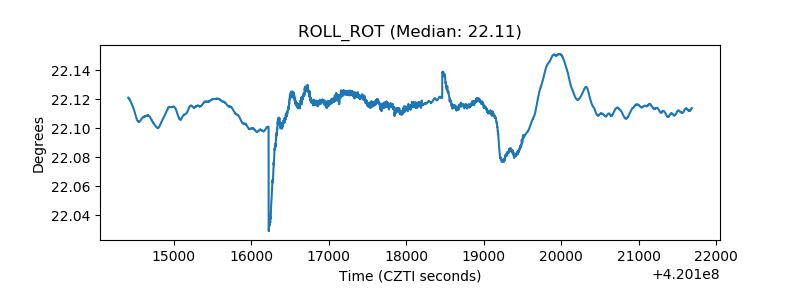 |
| _Roll_DEC | 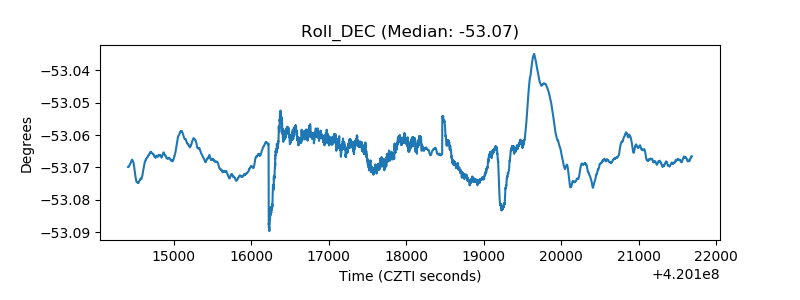 |
| _Roll_RA | 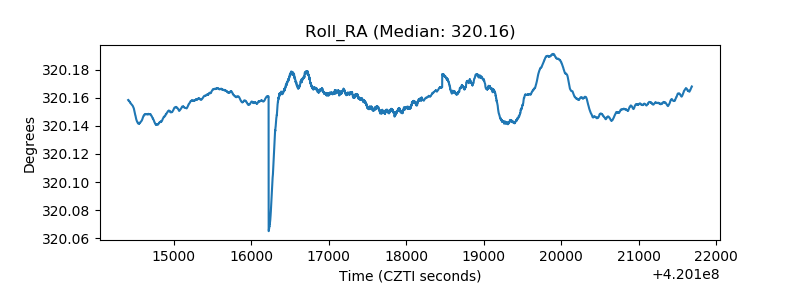 |
| Veto Counter | 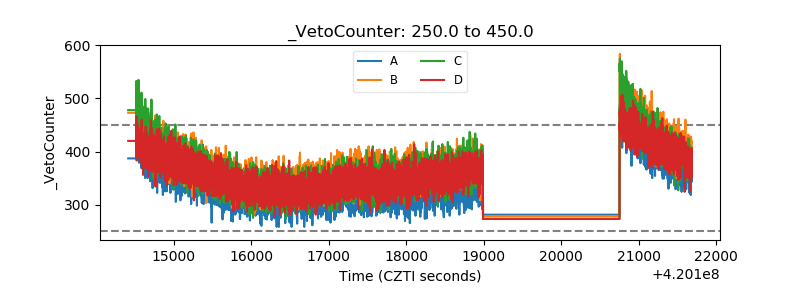 |