| Param | Original file | Final file |
|---|---|---|
| Filename | modeM0/AS1A12_052T04_9000005582_40951cztM0_level2.fits | modeM0/AS1A12_052T04_9000005582_40951cztM0_level2_quad_clean.evt |
| Size (bytes) | 310,898,880 | 92,946,240 |
| Size | 296.5 MB | 88.6 MB |
| Events in quadrant A | 2,857,483 | 633,682 |
| Events in quadrant B | 2,413,012 | 642,537 |
| Events in quadrant C | 2,791,466 | 604,112 |
| Events in quadrant D | 3,026,053 | 557,140 |
| Mode M9 | |||
|---|---|---|---|
| Quadrant | BADHDUFLAG | Total packets | Discarded packets |
| A | 0 | 19 | 0 |
| B | 0 | 19 | 0 |
| C | 0 | 19 | 0 |
| D | 0 | 19 | 0 |
| Mode SS | |||
|---|---|---|---|
| Quadrant | BADHDUFLAG | Total packets | Discarded packets |
| A | 0 | 108 | 0 |
| B | 0 | 108 | 0 |
| C | 0 | 108 | 0 |
| D | 0 | 108 | 0 |
| Mode M0 | |||
|---|---|---|---|
| Quadrant | BADHDUFLAG | Total packets | Discarded packets |
| A | 0 | 11753 | 2 |
| B | 0 | 10832 | 1 |
| C | 0 | 11603 | 1 |
| D | 0 | 12831 | 1 |
| Quadrant | Total seconds | Saturated seconds | Saturation percentage |
|---|---|---|---|
| A | 5393 | 6 | 0.111255% |
| B | 5393 | 4 | 0.074170% |
| C | 5393 | 48 | 0.890043% |
| D | 5393 | 141 | 2.614500% |
Noise dominated data is calculated using 1-second bins in cleaned event files. If a bin has >2000 counts, and if more than 50% of those come from <1% of pixels, then it is considered to be noise-dominated and hence unusable.
| Quadrant | # 1 sec bins | Bins with >0 counts | Bins with >2000 counts | High rate bins dominated by noise | Noise dominated (total time) | Noise dominated (detector-on time) | Marked lightcurve |
|---|---|---|---|---|---|---|---|
| A | 7274 | 5394 | 1 | 1 | 0.01% | 0.02% | 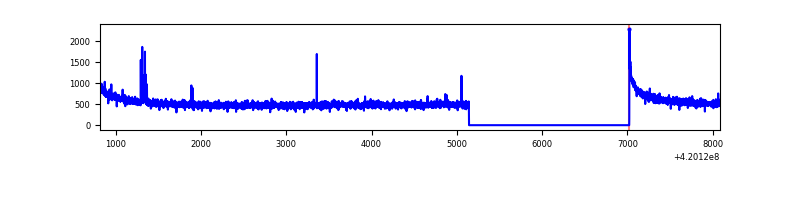 |
| B | 7274 | 5394 | 0 | 0 | 0.00% | 0.00% | 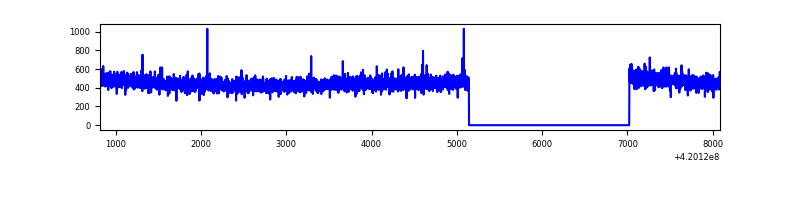 |
| C | 7274 | 5394 | 45 | 45 | 0.62% | 0.83% | 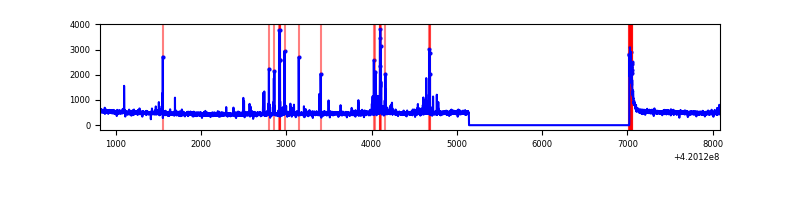 |
| D | 7274 | 5394 | 134 | 134 | 1.84% | 2.48% | 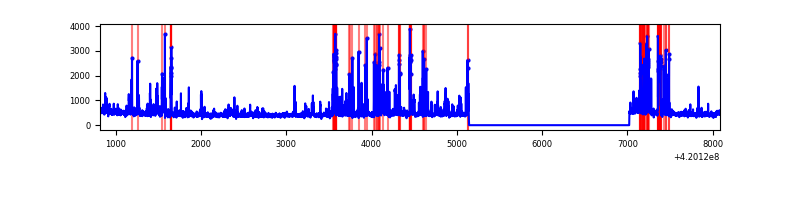 |
Top three noisy pixels from each quadrant. If the there are fewer than three noisy pixels in the level2.evt file, extra rows are filled as -1
| Pixel properties | Quadrant properties | ||||||
|---|---|---|---|---|---|---|---|
| Quadrant | DetID | PixID | Counts | Sigma | Mean | Median | Sigma |
| A | 10 | 83 | 479778 | 3837.13 | 610 | 598 | 124.9 |
| A | 7 | 3 | 15881 | 122.38 | 610 | 598 | 124.9 |
| A | 13 | 254 | 7640 | 56.39 | 610 | 598 | 124.9 |
| B | 3 | 112 | 34890 | 298.55 | 602 | 587 | 114.9 |
| B | 0 | 190 | 16890 | 141.89 | 602 | 587 | 114.9 |
| B | 12 | 111 | 14477 | 120.89 | 602 | 587 | 114.9 |
| C | 15 | 214 | 247070 | 1821.67 | 582 | 586 | 135.3 |
| C | 12 | 249 | 134197 | 987.47 | 582 | 586 | 135.3 |
| C | 0 | 10 | 84882 | 623.0 | 582 | 586 | 135.3 |
| D | 13 | 249 | 575677 | 4075.55 | 580 | 563 | 141.1 |
| D | 2 | 249 | 77652 | 546.29 | 580 | 563 | 141.1 |
| D | 1 | 52 | 32700 | 227.74 | 580 | 563 | 141.1 |
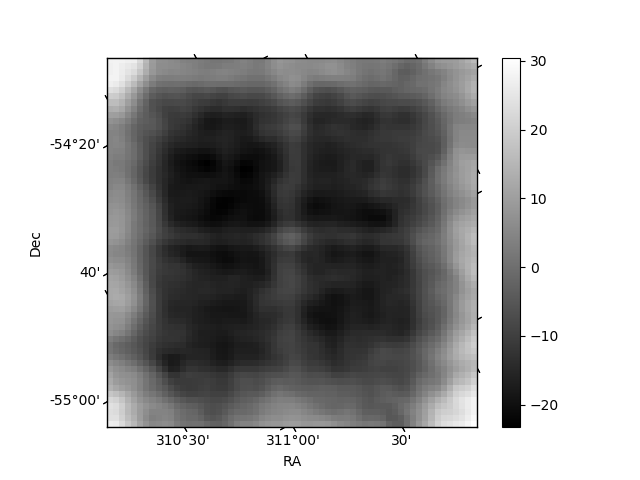
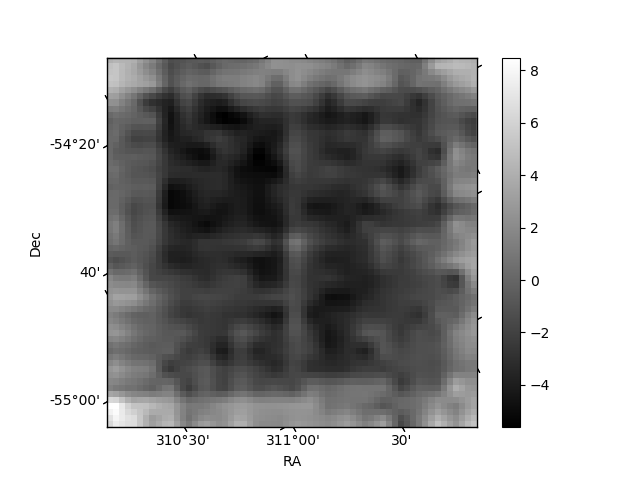
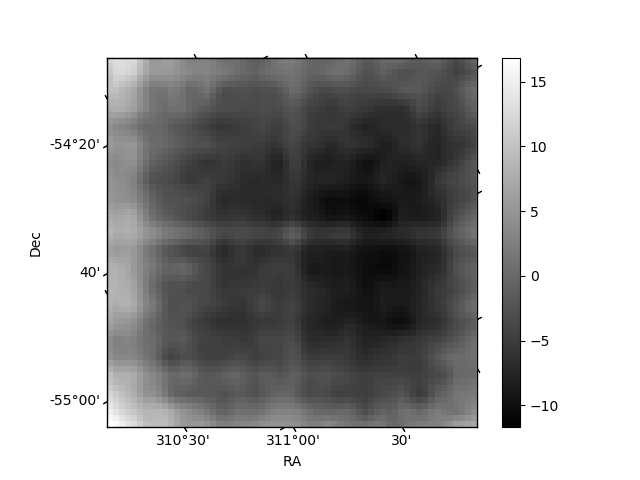
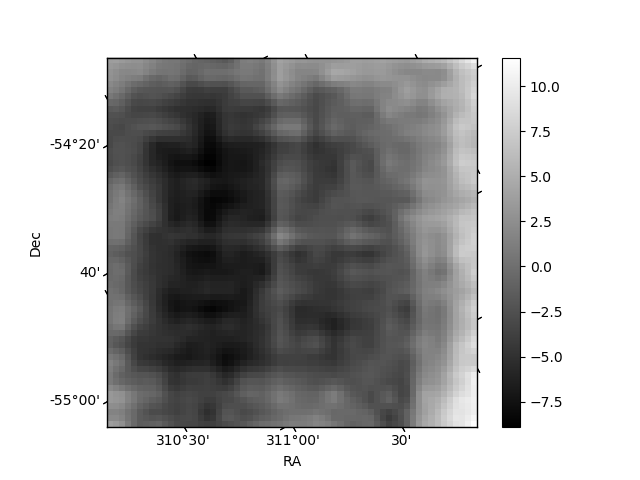
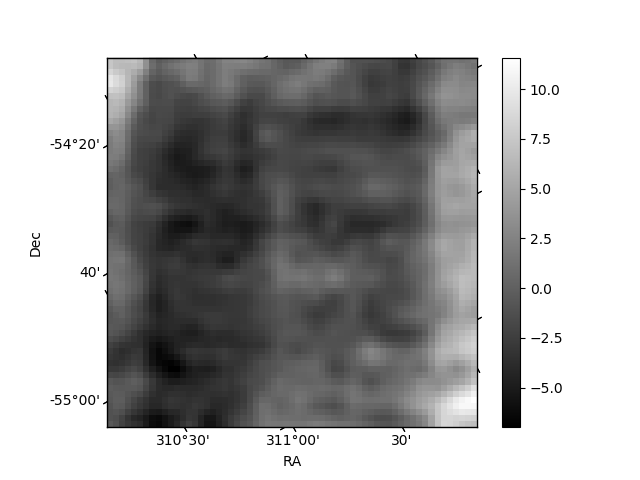
Histogram calculated using DETX and DETY for each event in the final _common_clean file
| Quadrant A | 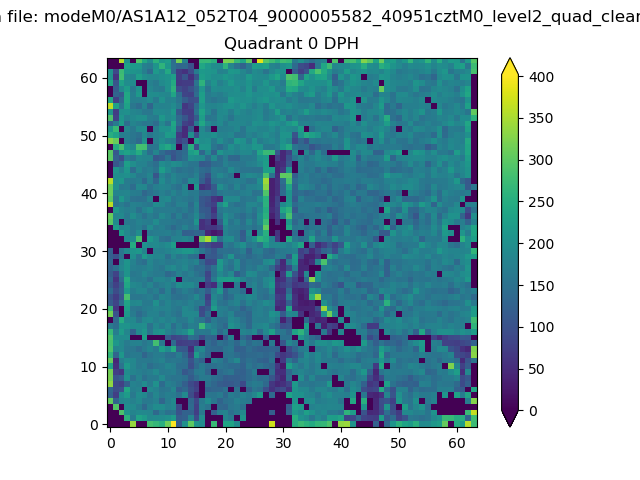 |
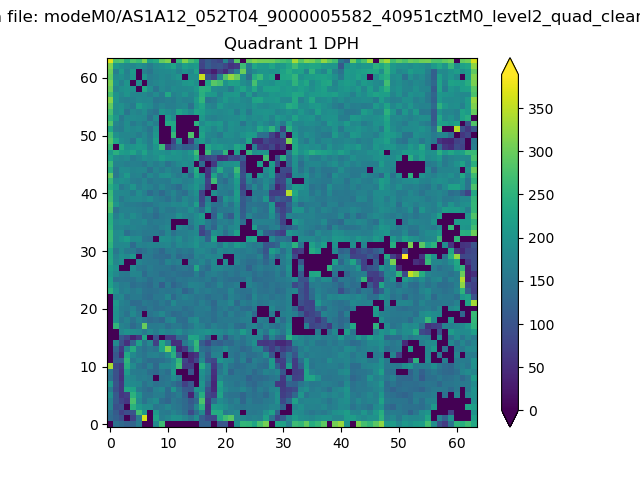 |
Quadrant B |
|---|---|---|---|
| Quadrant D | 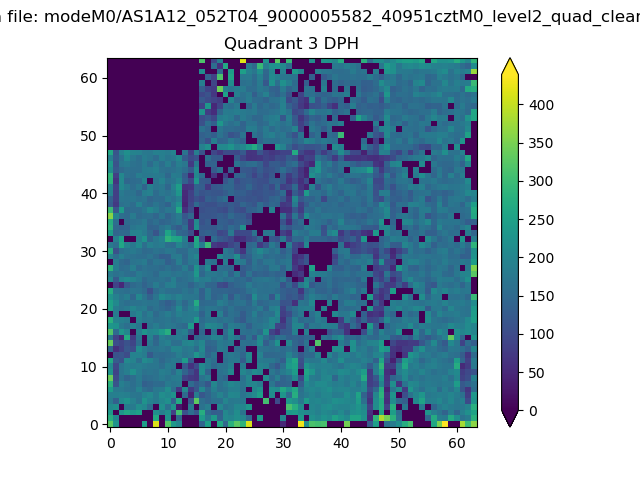 |
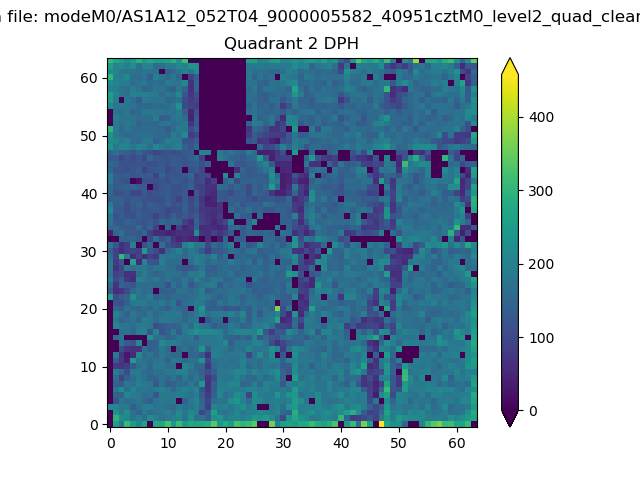 |
Quadrant C |
| Plot type | Count rate plots | Images |
|---|---|---|
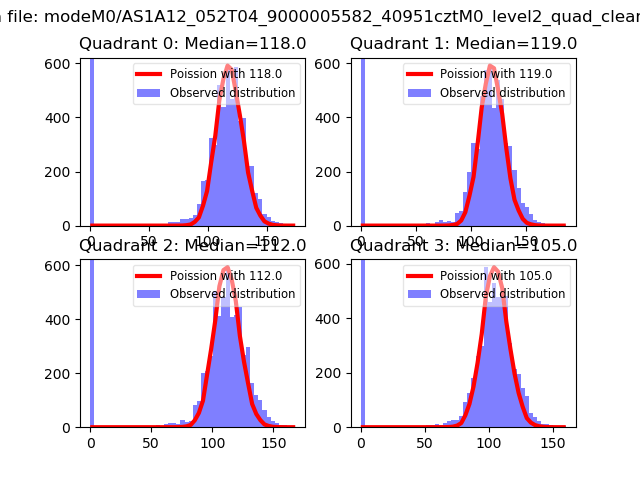
| Comparison with Poisson distribution Blue bars denote a histogram of data divided into 1 sec bins. Red curve is a Poisson curve with rate = median count rate of data. |
 |
 |
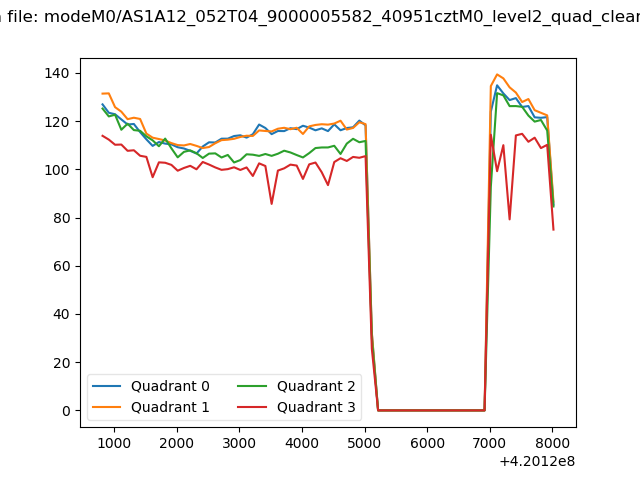
| Quadrant-wise count rates Data is divided into 100 sec bins |
 |
|
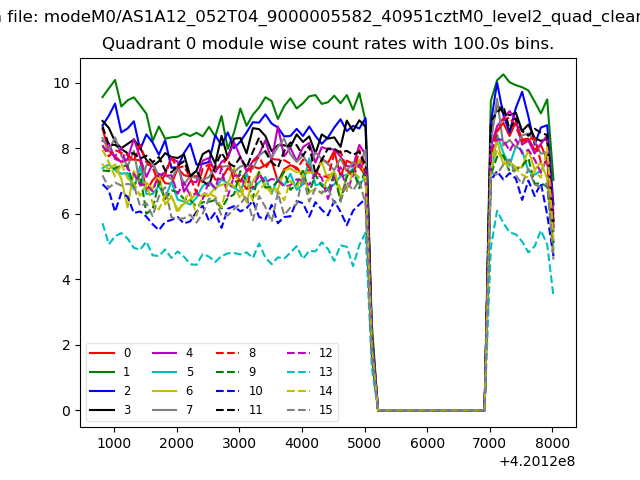
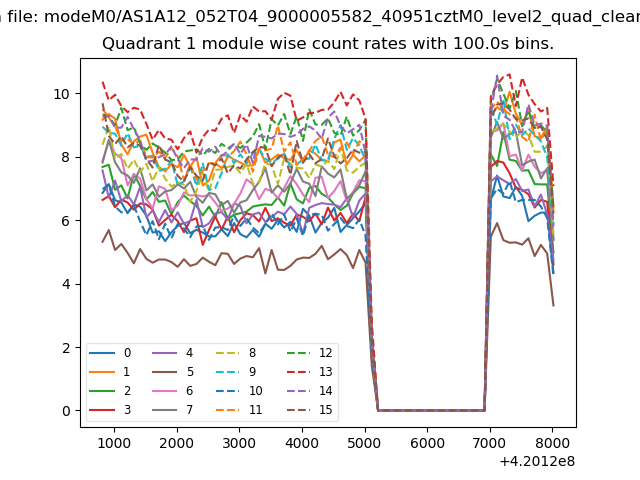
| Module-wise count rates for Quadrant A Data is divided into 100 sec bins |
 |
 |
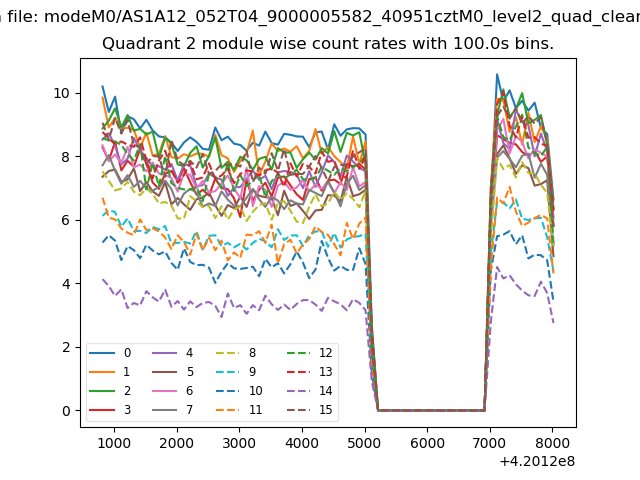
| Module-wise count rates for Quadrant B Data is divided into 100 sec bins |
 |
 |
| Module-wise count rates for Quadrant C Data is divided into 100 sec bins |
 |
 |
| Module-wise count rates for Quadrant D Data is divided into 100 sec bins |
 |
 |
| Parameter | Plot |
|---|---|
| CZT HV Monitor | 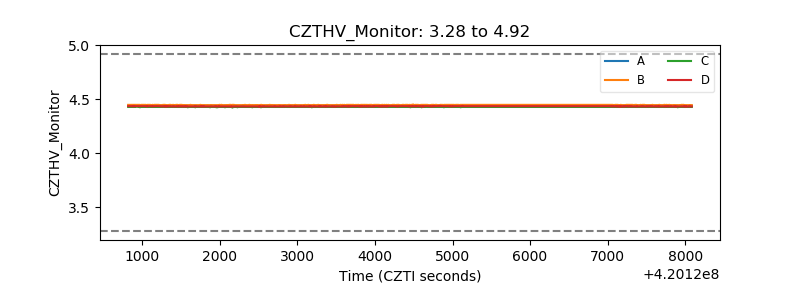 |
| D_VDD | 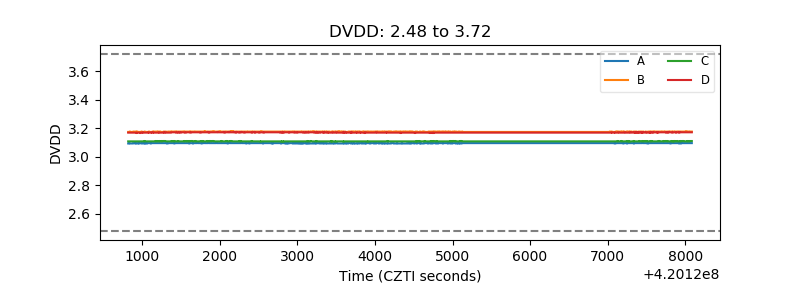 |
| Temperature 1 | 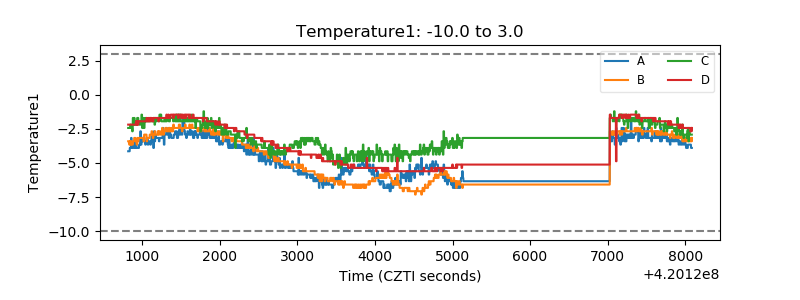 |
| Veto HV Monitor |  |
| Veto LLD | 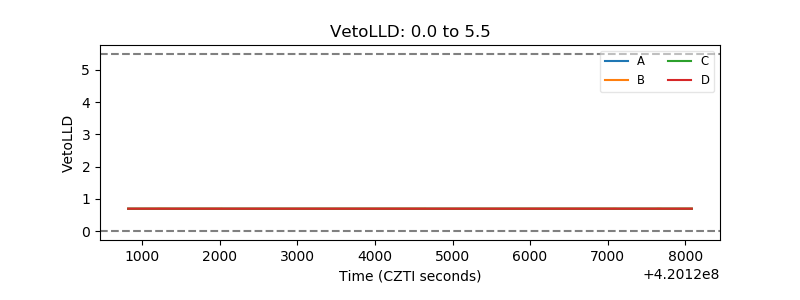 |
| Alpha Counter | 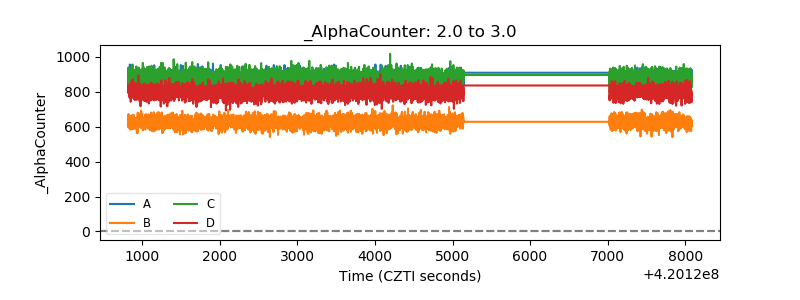 |
| _CPM_Rate | 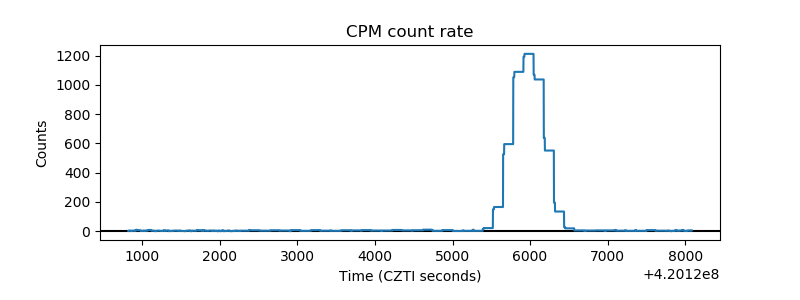 |
| CZT Counter | 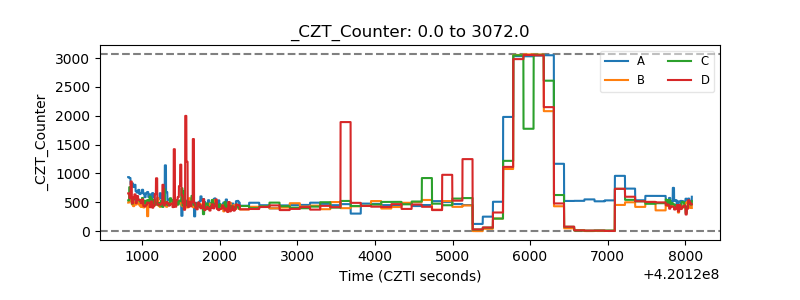 |
| +2.5 Volts monitor | 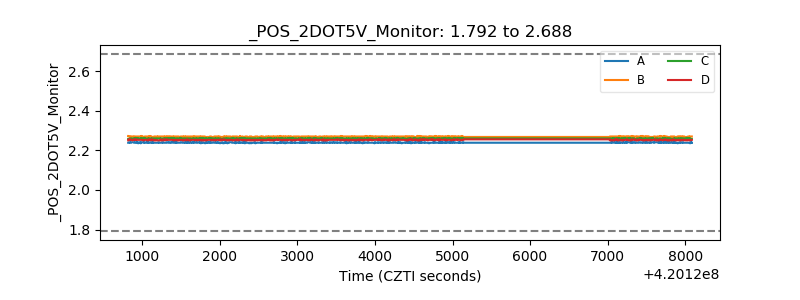 |
| +5 Volts monitor | 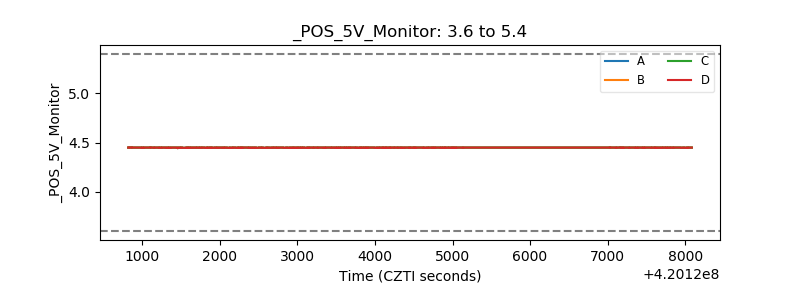 |
| _ROLL_ROT | 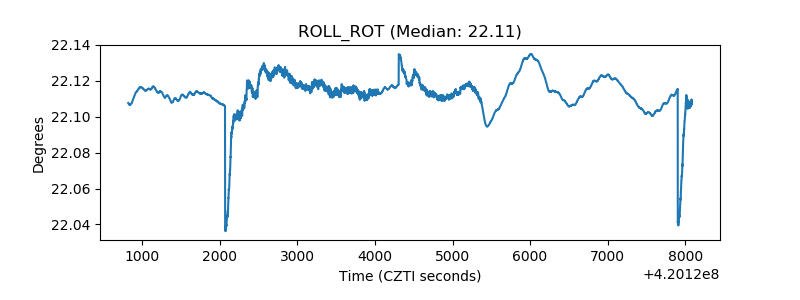 |
| _Roll_DEC | 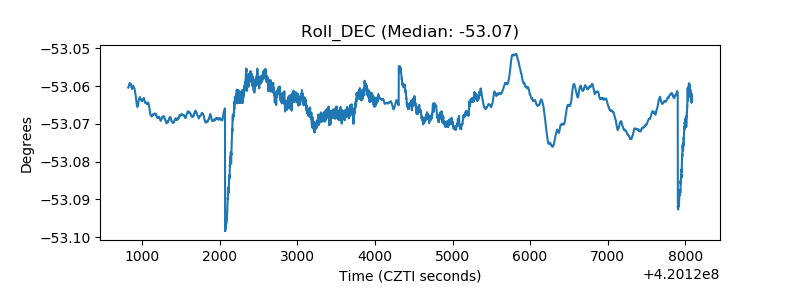 |
| _Roll_RA | 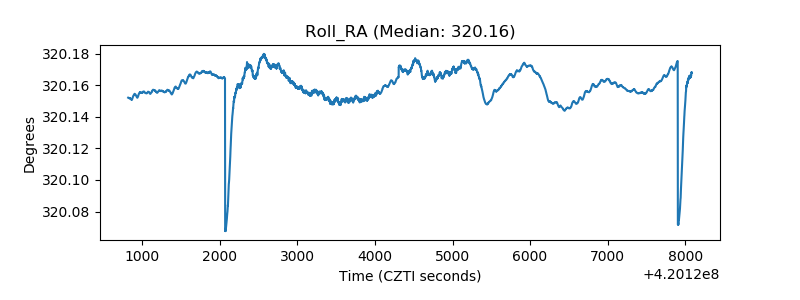 |
| Veto Counter | 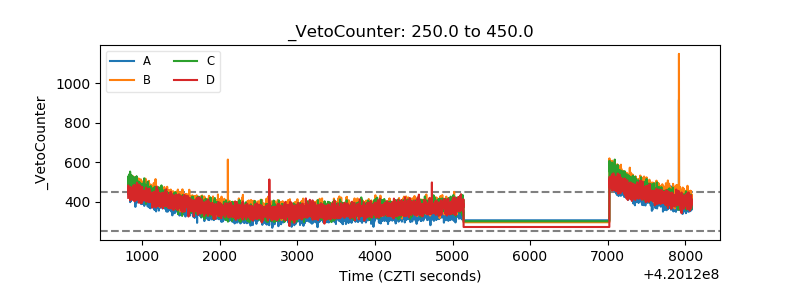 |