| Param | Original file | Final file |
|---|---|---|
| Filename | modeM0/AS1A12_052T04_9000005582_40952cztM0_level2.fits | modeM0/AS1A12_052T04_9000005582_40952cztM0_level2_quad_clean.evt |
| Size (bytes) | 297,846,720 | 91,926,720 |
| Size | 284.0 MB | 87.7 MB |
| Events in quadrant A | 2,797,778 | 633,173 |
| Events in quadrant B | 2,347,940 | 644,439 |
| Events in quadrant C | 2,740,486 | 592,940 |
| Events in quadrant D | 2,738,173 | 553,304 |
| Mode M9 | |||
|---|---|---|---|
| Quadrant | BADHDUFLAG | Total packets | Discarded packets |
| A | 0 | 27 | 0 |
| B | 0 | 27 | 0 |
| C | 0 | 27 | 0 |
| D | 0 | 28 | 0 |
| Mode SS | |||
|---|---|---|---|
| Quadrant | BADHDUFLAG | Total packets | Discarded packets |
| A | 0 | 104 | 0 |
| B | 0 | 104 | 0 |
| C | 0 | 104 | 0 |
| D | 0 | 104 | 0 |
| Mode M0 | |||
|---|---|---|---|
| Quadrant | BADHDUFLAG | Total packets | Discarded packets |
| A | 0 | 11390 | 3 |
| B | 0 | 10325 | 2 |
| C | 0 | 11192 | 2 |
| D | 0 | 11744 | 2 |
| Quadrant | Total seconds | Saturated seconds | Saturation percentage |
|---|---|---|---|
| A | 5139 | 8 | 0.155672% |
| B | 5139 | 5 | 0.097295% |
| C | 5139 | 82 | 1.595641% |
| D | 5139 | 134 | 2.607511% |
Noise dominated data is calculated using 1-second bins in cleaned event files. If a bin has >2000 counts, and if more than 50% of those come from <1% of pixels, then it is considered to be noise-dominated and hence unusable.
| Quadrant | # 1 sec bins | Bins with >0 counts | Bins with >2000 counts | High rate bins dominated by noise | Noise dominated (total time) | Noise dominated (detector-on time) | Marked lightcurve |
|---|---|---|---|---|---|---|---|
| A | 7143 | 5140 | 3 | 3 | 0.04% | 0.06% | 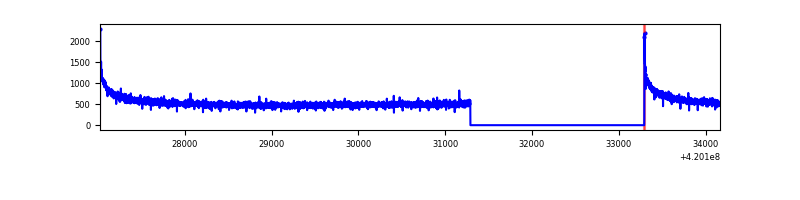 |
| B | 7143 | 5140 | 0 | 0 | 0.00% | 0.00% | 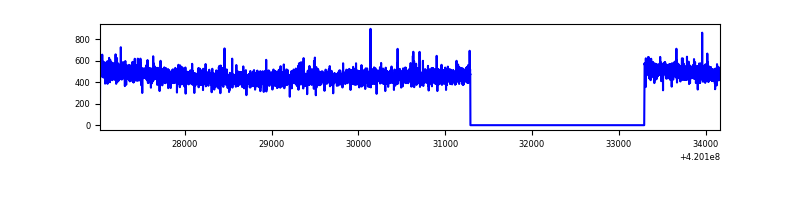 |
| C | 7143 | 5140 | 85 | 85 | 1.19% | 1.65% | 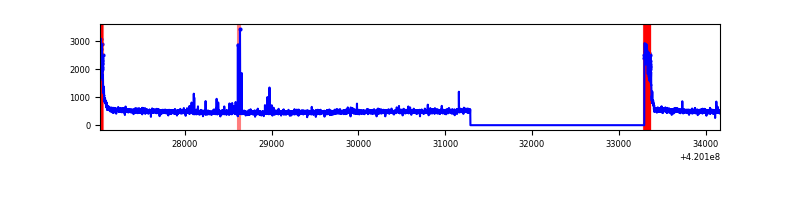 |
| D | 7143 | 5140 | 122 | 122 | 1.71% | 2.37% | 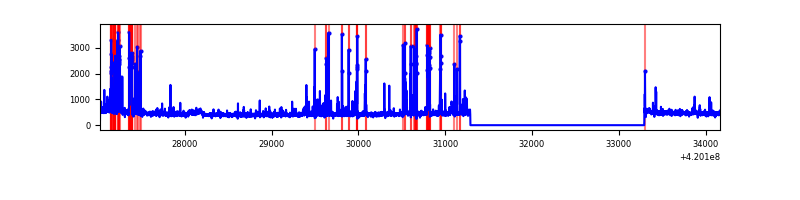 |
Top three noisy pixels from each quadrant. If the there are fewer than three noisy pixels in the level2.evt file, extra rows are filled as -1
| Pixel properties | Quadrant properties | ||||||
|---|---|---|---|---|---|---|---|
| Quadrant | DetID | PixID | Counts | Sigma | Mean | Median | Sigma |
| A | 10 | 83 | 495434 | 4075.8 | 595 | 583 | 121.4 |
| A | 13 | 254 | 7548 | 57.36 | 595 | 583 | 121.4 |
| A | 3 | 137 | 6311 | 47.17 | 595 | 583 | 121.4 |
| B | 0 | 190 | 21638 | 187.26 | 589 | 573 | 112.5 |
| B | 3 | 112 | 16613 | 142.59 | 589 | 573 | 112.5 |
| B | 12 | 111 | 13952 | 118.93 | 589 | 573 | 112.5 |
| C | 0 | 10 | 247553 | 1873.75 | 566 | 570 | 131.8 |
| C | 15 | 214 | 235750 | 1784.21 | 566 | 570 | 131.8 |
| C | 14 | 254 | 26238 | 194.73 | 566 | 570 | 131.8 |
| D | 13 | 249 | 421756 | 3080.58 | 565 | 549 | 136.7 |
| D | 2 | 249 | 50509 | 365.39 | 565 | 549 | 136.7 |
| D | 12 | 6 | 37577 | 270.81 | 565 | 549 | 136.7 |
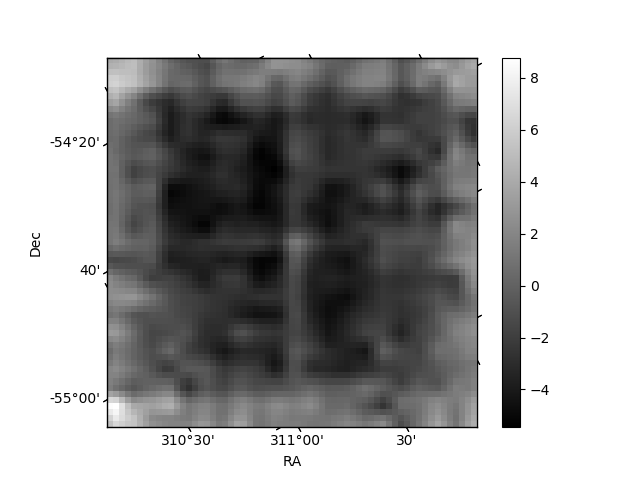
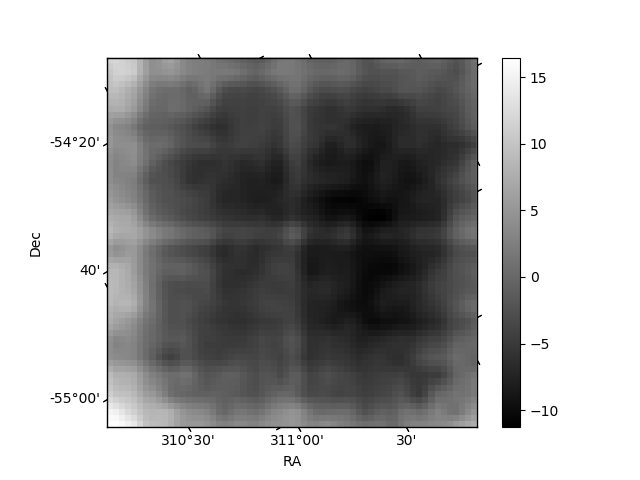
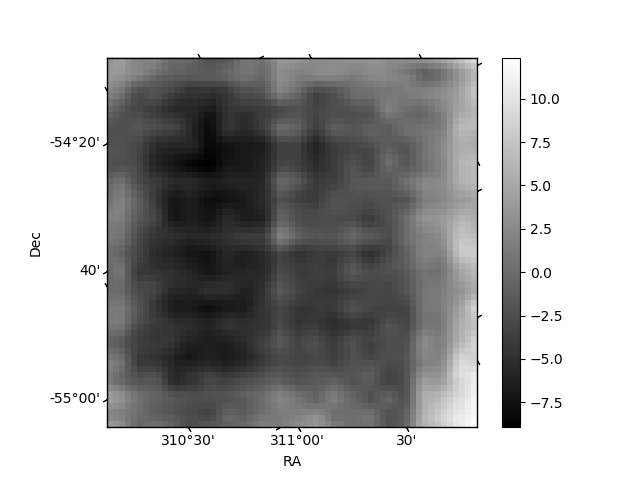
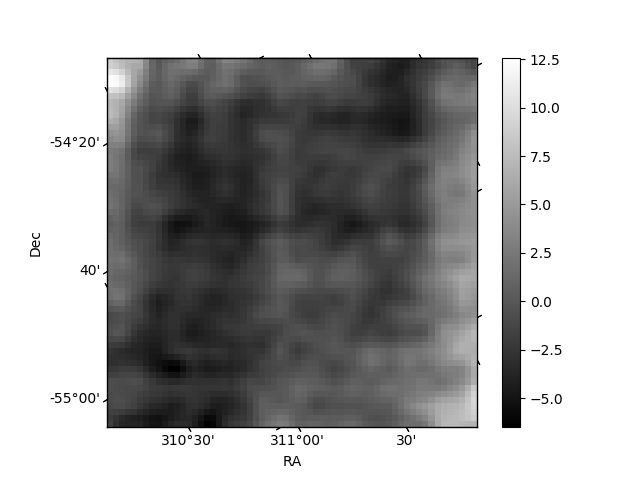
Histogram calculated using DETX and DETY for each event in the final _common_clean file
| Quadrant A | 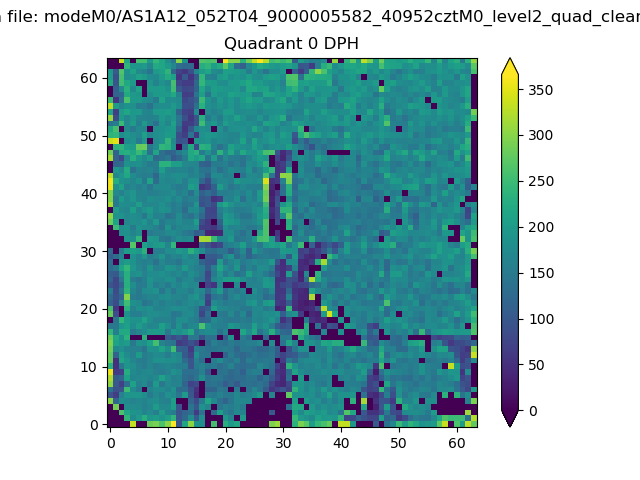 |
 |
Quadrant B |
|---|---|---|---|
| Quadrant D |  |
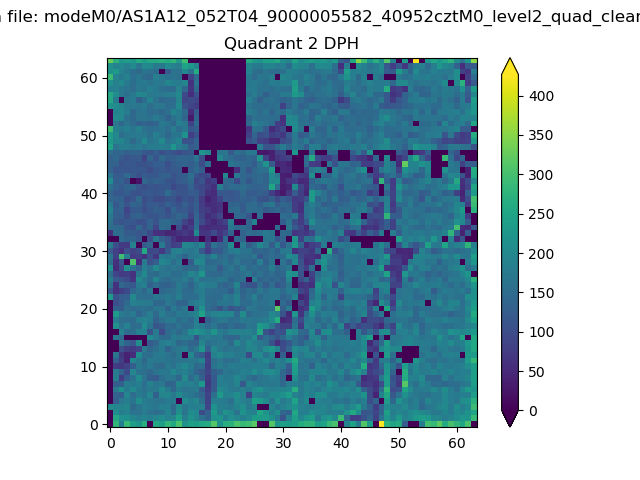 |
Quadrant C |
| Plot type | Count rate plots | Images |
|---|---|---|
| Comparison with Poisson distribution Blue bars denote a histogram of data divided into 1 sec bins. Red curve is a Poisson curve with rate = median count rate of data. |
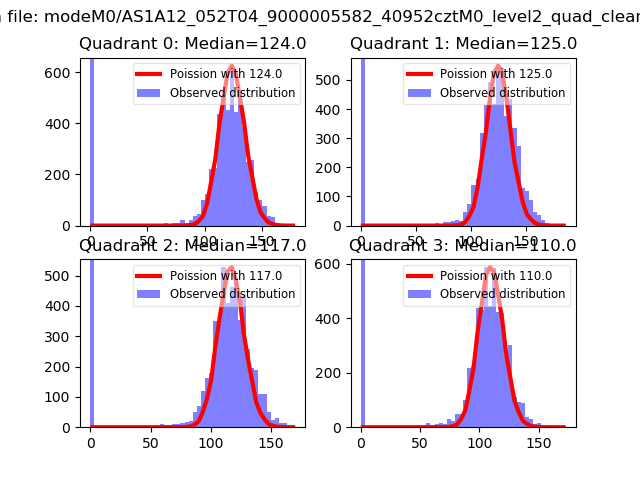 |
 |
| Quadrant-wise count rates Data is divided into 100 sec bins |
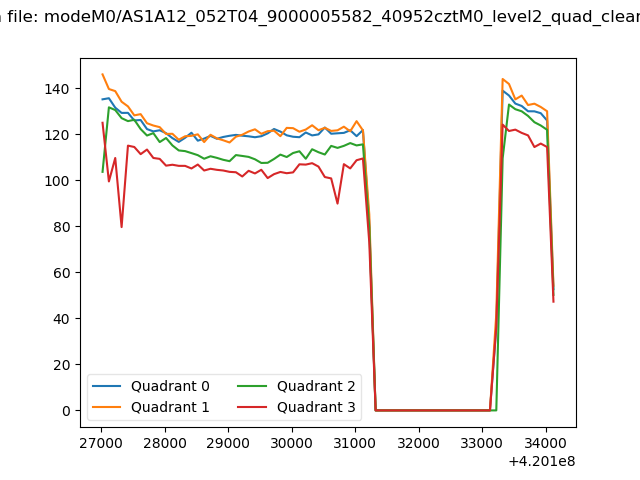 |
|
| Module-wise count rates for Quadrant A Data is divided into 100 sec bins |
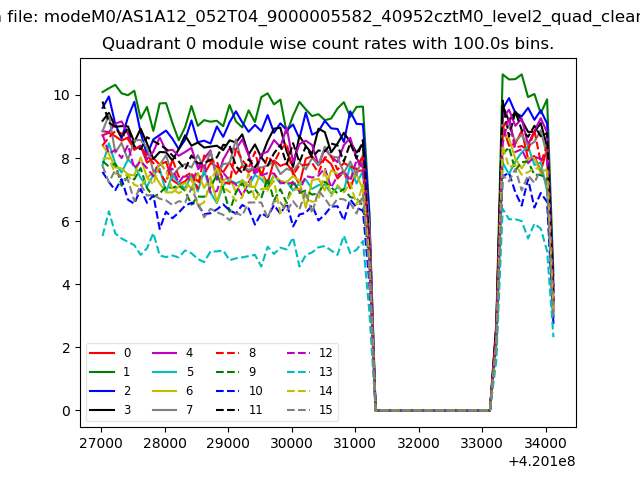 |
 |
| Module-wise count rates for Quadrant B Data is divided into 100 sec bins |
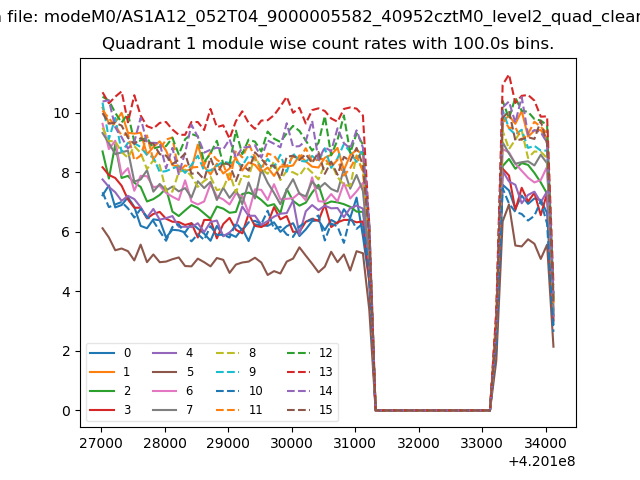 |
 |
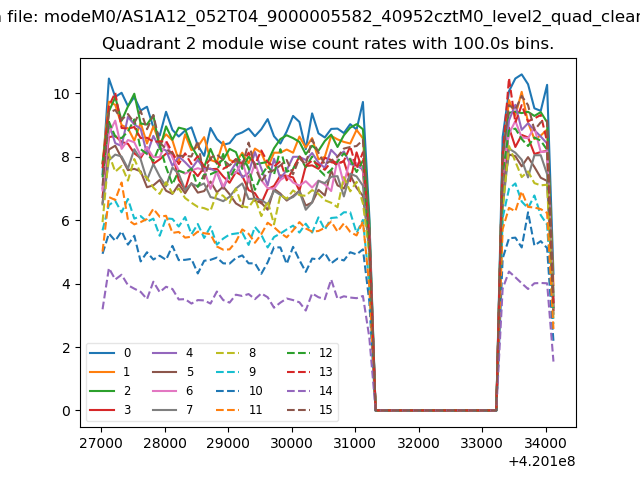
| Module-wise count rates for Quadrant C Data is divided into 100 sec bins |
 |
 |
| Module-wise count rates for Quadrant D Data is divided into 100 sec bins |
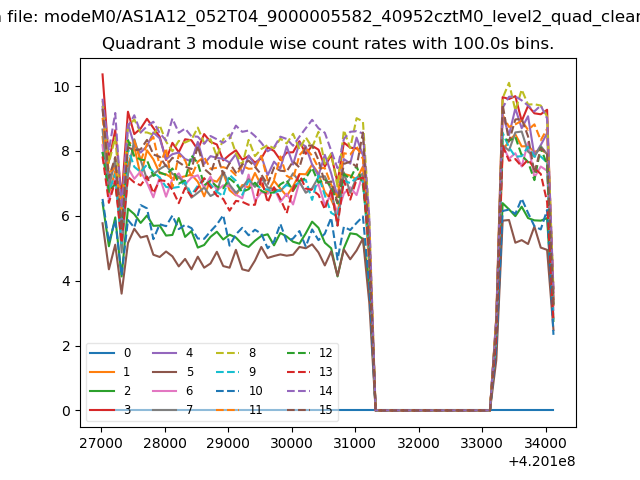 |
 |
| Parameter | Plot |
|---|---|
| CZT HV Monitor | 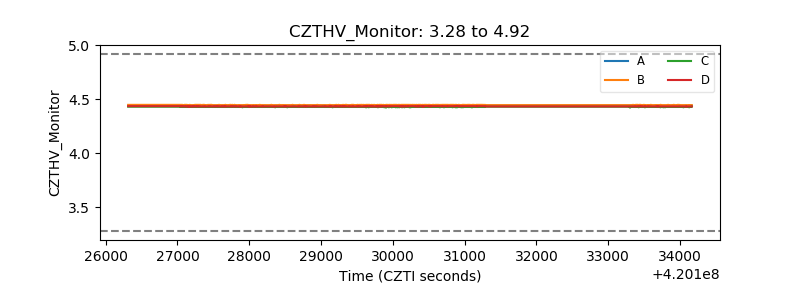 |
| D_VDD | 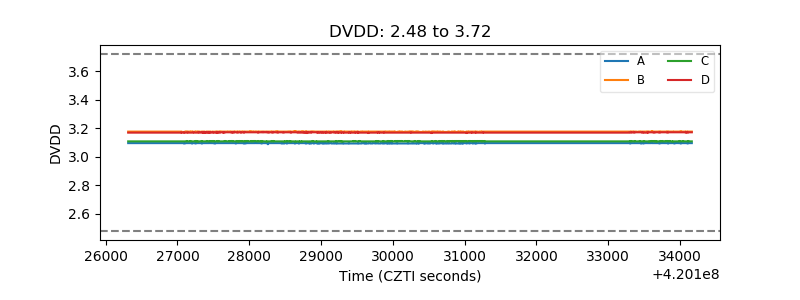 |
| Temperature 1 | 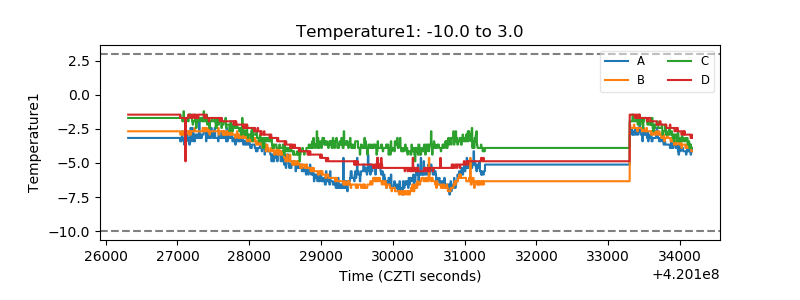 |
| Veto HV Monitor |  |
| Veto LLD | 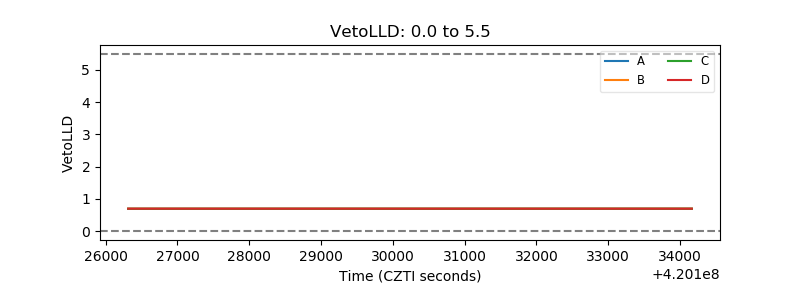 |
| Alpha Counter | 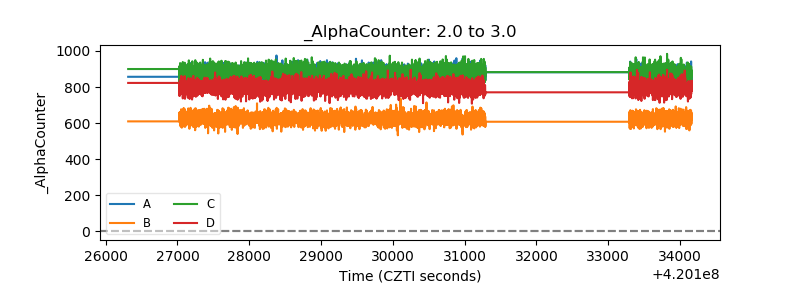 |
| _CPM_Rate | 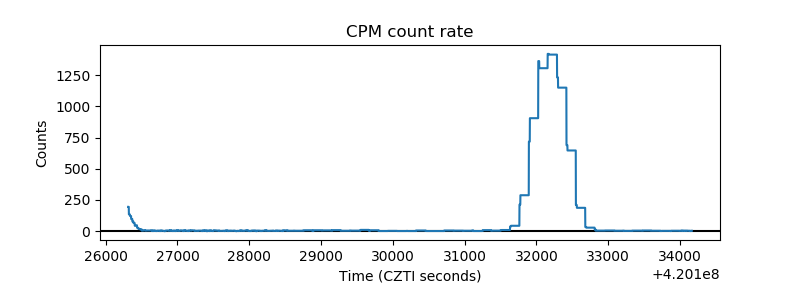 |
| CZT Counter | 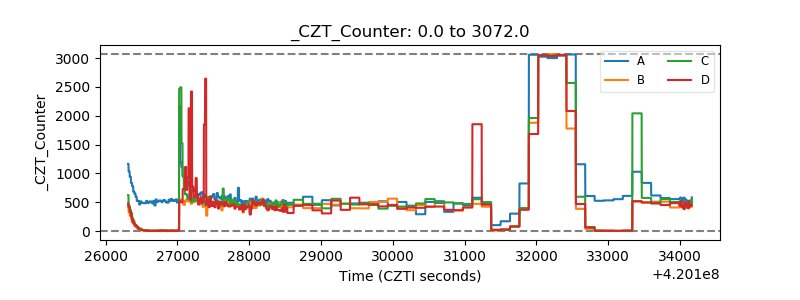 |
| +2.5 Volts monitor | 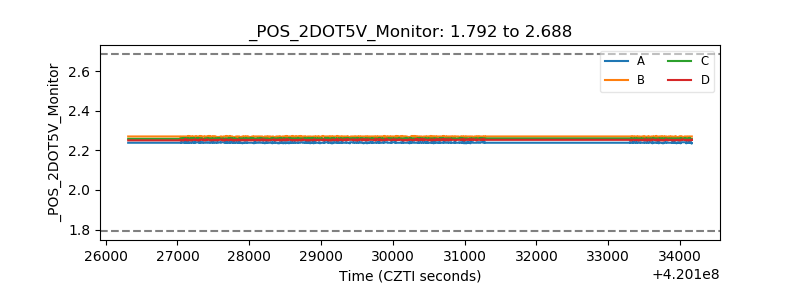 |
| +5 Volts monitor | 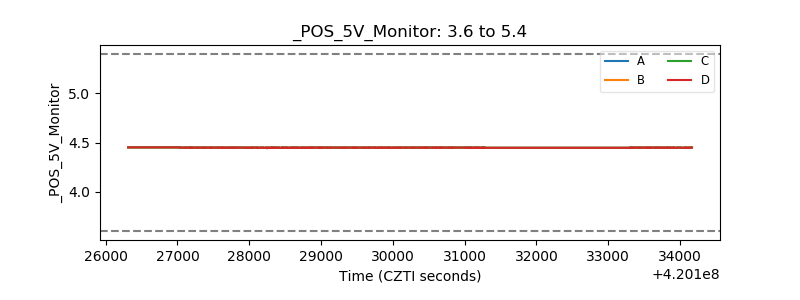 |
| _ROLL_ROT | 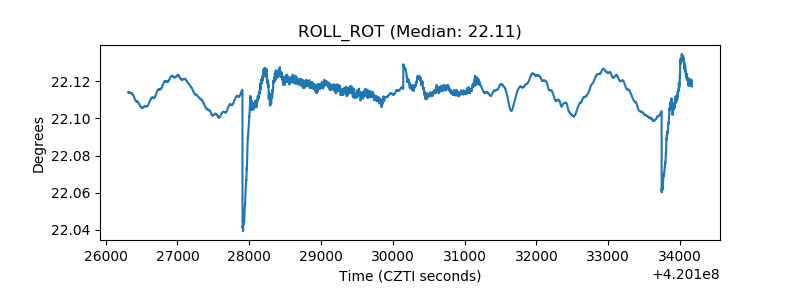 |
| _Roll_DEC | 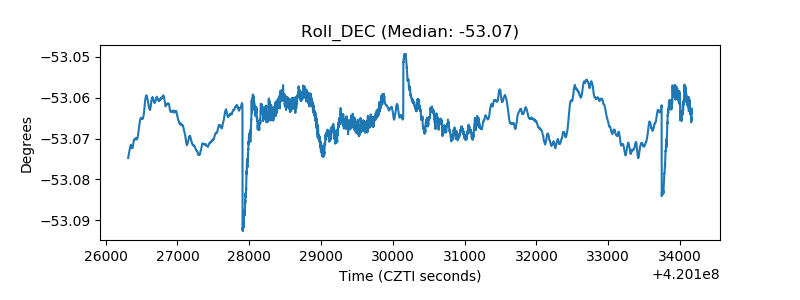 |
| _Roll_RA | 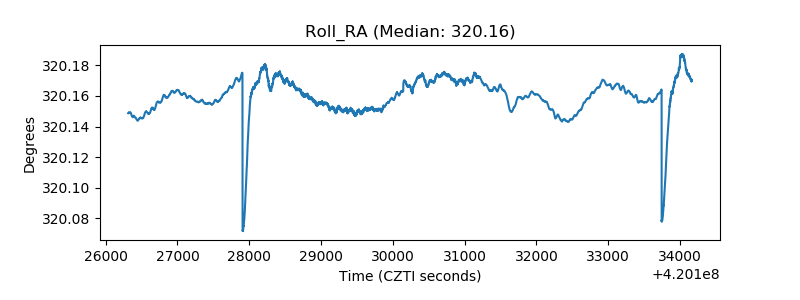 |
| Veto Counter | 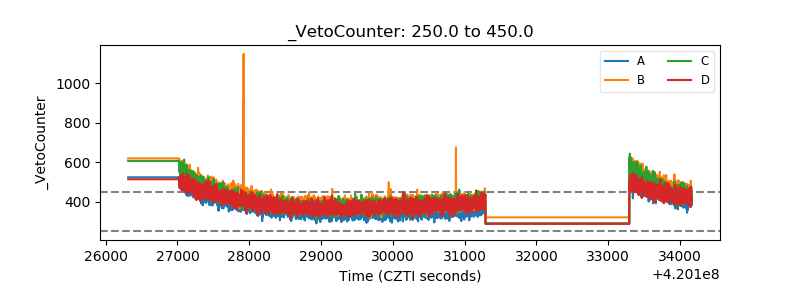 |