| Param | Original file | Final file |
|---|---|---|
| Filename | modeM0/AS1A12_052T04_9000005582_40953cztM0_level2.fits | modeM0/AS1A12_052T04_9000005582_40953cztM0_level2_quad_clean.evt |
| Size (bytes) | 297,613,440 | 88,666,560 |
| Size | 283.8 MB | 84.6 MB |
| Events in quadrant A | 2,792,155 | 614,803 |
| Events in quadrant B | 2,274,759 | 626,111 |
| Events in quadrant C | 2,694,484 | 571,743 |
| Events in quadrant D | 2,871,626 | 527,316 |
| Mode M9 | |||
|---|---|---|---|
| Quadrant | BADHDUFLAG | Total packets | Discarded packets |
| A | 0 | 26 | 0 |
| B | 0 | 26 | 0 |
| C | 0 | 26 | 0 |
| D | 0 | 27 | 0 |
| Mode SS | |||
|---|---|---|---|
| Quadrant | BADHDUFLAG | Total packets | Discarded packets |
| A | 0 | 100 | 0 |
| B | 0 | 100 | 0 |
| C | 0 | 100 | 0 |
| D | 0 | 100 | 0 |
| Mode M0 | |||
|---|---|---|---|
| Quadrant | BADHDUFLAG | Total packets | Discarded packets |
| A | 0 | 11218 | 3 |
| B | 0 | 9912 | 2 |
| C | 0 | 10938 | 2 |
| D | 0 | 11976 | 2 |
| Quadrant | Total seconds | Saturated seconds | Saturation percentage |
|---|---|---|---|
| A | 4919 | 16 | 0.325269% |
| B | 4919 | 6 | 0.121976% |
| C | 4919 | 91 | 1.849970% |
| D | 4919 | 208 | 4.228502% |
Noise dominated data is calculated using 1-second bins in cleaned event files. If a bin has >2000 counts, and if more than 50% of those come from <1% of pixels, then it is considered to be noise-dominated and hence unusable.
| Quadrant | # 1 sec bins | Bins with >0 counts | Bins with >2000 counts | High rate bins dominated by noise | Noise dominated (total time) | Noise dominated (detector-on time) | Marked lightcurve |
|---|---|---|---|---|---|---|---|
| A | 7011 | 4920 | 6 | 6 | 0.09% | 0.12% | 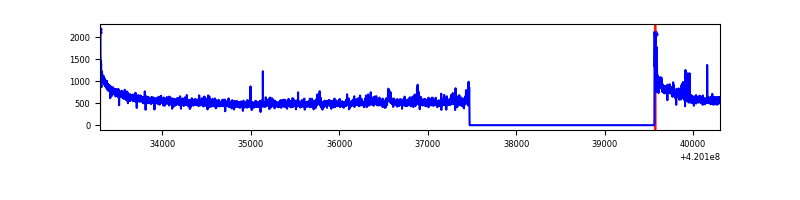 |
| B | 7011 | 4920 | 0 | 0 | 0.00% | 0.00% | 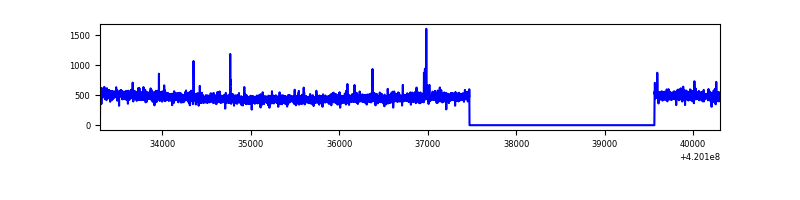 |
| C | 7011 | 4920 | 92 | 92 | 1.31% | 1.87% | 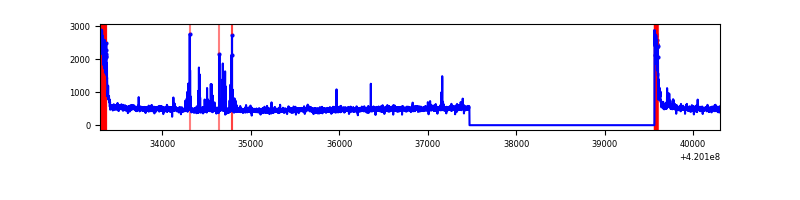 |
| D | 7011 | 4920 | 180 | 180 | 2.57% | 3.66% | 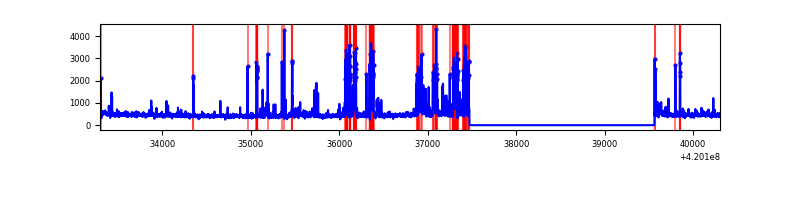 |
Top three noisy pixels from each quadrant. If the there are fewer than three noisy pixels in the level2.evt file, extra rows are filled as -1
| Pixel properties | Quadrant properties | ||||||
|---|---|---|---|---|---|---|---|
| Quadrant | DetID | PixID | Counts | Sigma | Mean | Median | Sigma |
| A | 10 | 83 | 480550 | 4155.55 | 571 | 559 | 115.5 |
| A | 12 | 189 | 98578 | 848.61 | 571 | 559 | 115.5 |
| A | 13 | 254 | 8969 | 72.81 | 571 | 559 | 115.5 |
| B | 0 | 190 | 26792 | 241.83 | 567 | 553 | 108.5 |
| B | 3 | 112 | 23614 | 212.54 | 567 | 553 | 108.5 |
| B | 12 | 111 | 13412 | 118.51 | 567 | 553 | 108.5 |
| C | 0 | 10 | 262085 | 2080.95 | 543 | 546 | 125.7 |
| C | 15 | 214 | 227493 | 1805.72 | 543 | 546 | 125.7 |
| C | 14 | 254 | 51348 | 404.21 | 543 | 546 | 125.7 |
| D | 13 | 249 | 543671 | 4147.98 | 539 | 524 | 130.9 |
| D | 12 | 233 | 151947 | 1156.41 | 539 | 524 | 130.9 |
| D | 2 | 234 | 26096 | 195.29 | 539 | 524 | 130.9 |
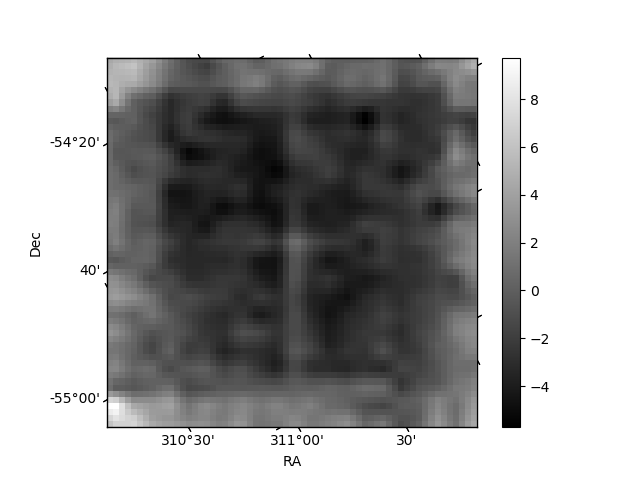
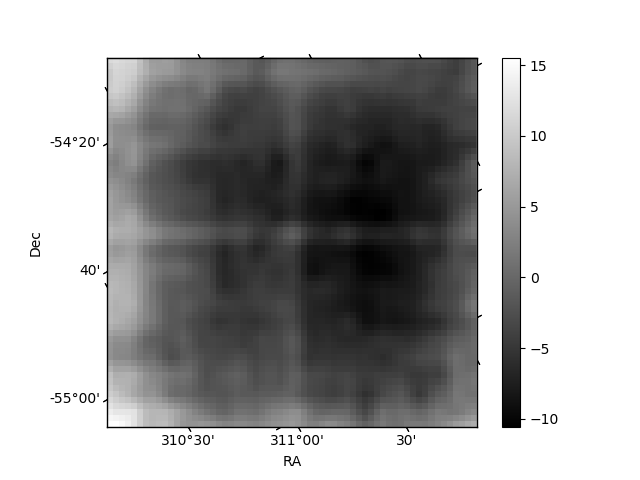
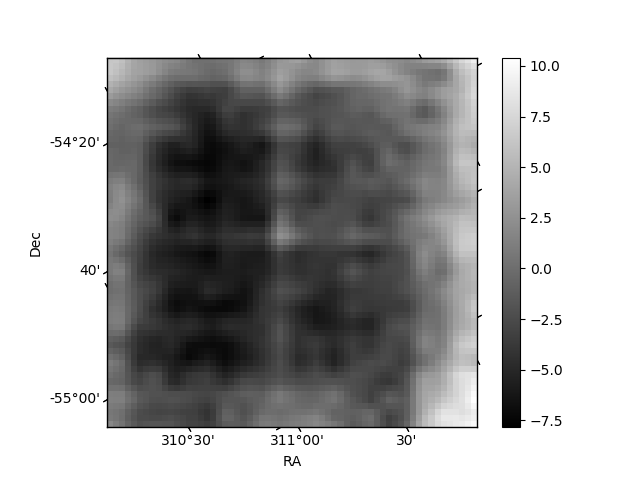
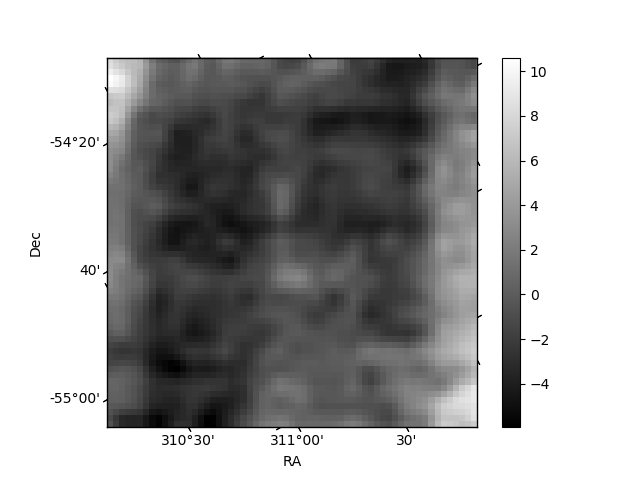
Histogram calculated using DETX and DETY for each event in the final _common_clean file
| Quadrant A | 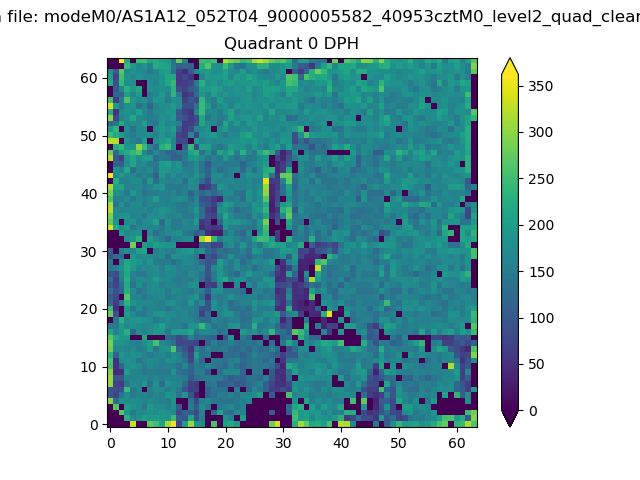 |
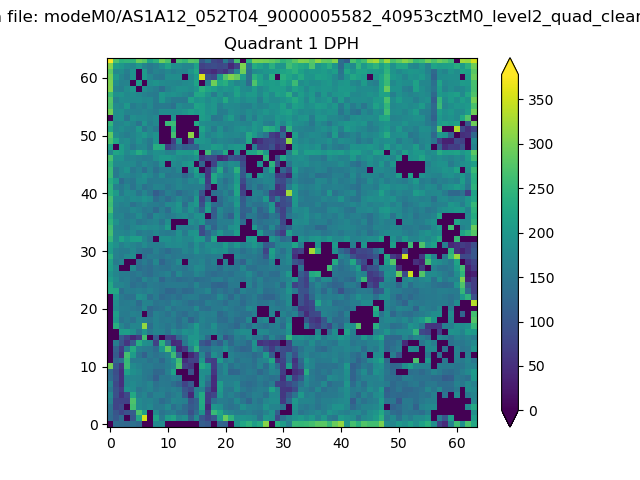 |
Quadrant B |
|---|---|---|---|
| Quadrant D | 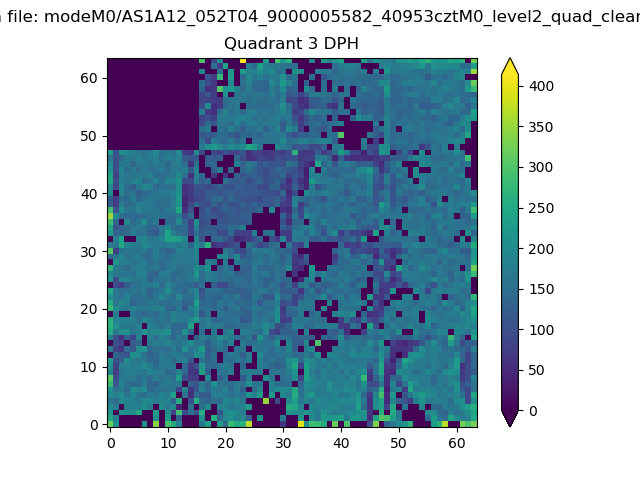 |
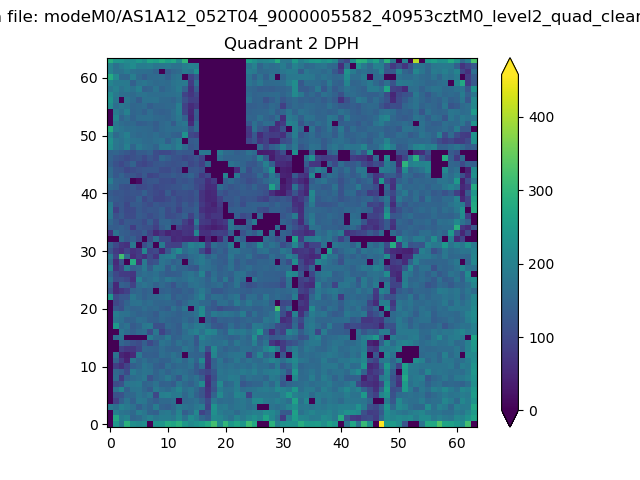 |
Quadrant C |
| Plot type | Count rate plots | Images |
|---|---|---|
| Comparison with Poisson distribution Blue bars denote a histogram of data divided into 1 sec bins. Red curve is a Poisson curve with rate = median count rate of data. |
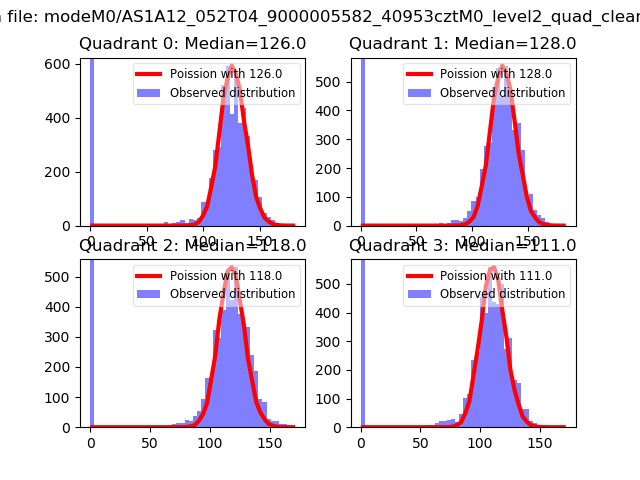 |
 |
| Quadrant-wise count rates Data is divided into 100 sec bins |
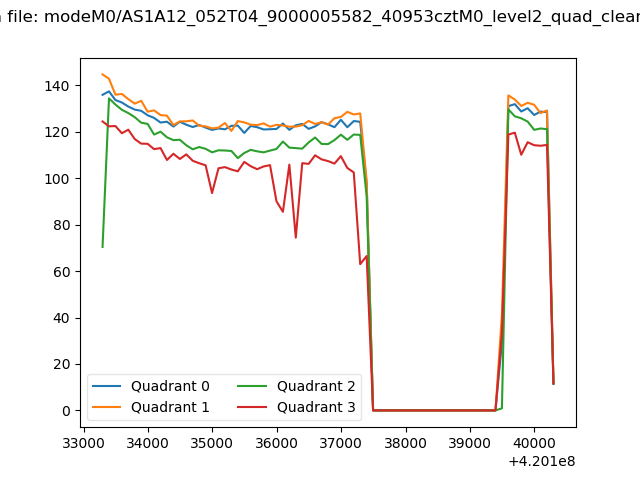 |
|
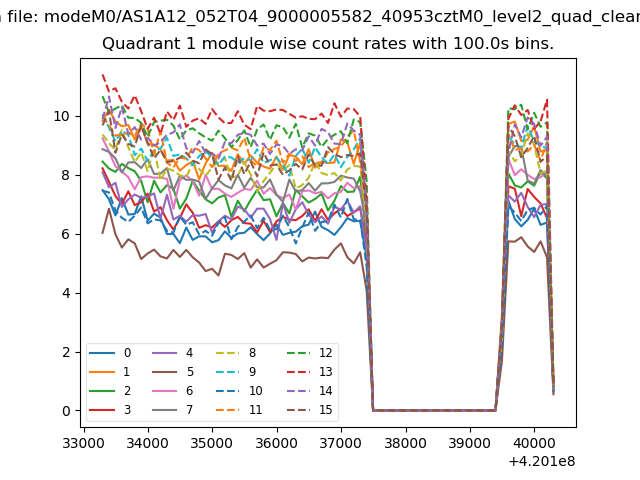
| Module-wise count rates for Quadrant A Data is divided into 100 sec bins |
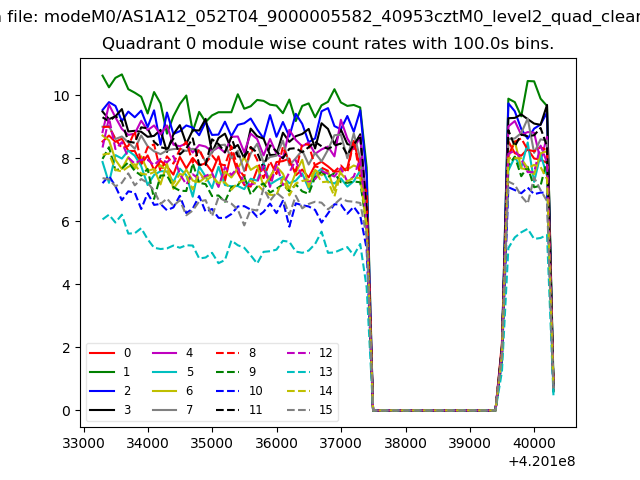 |
 |
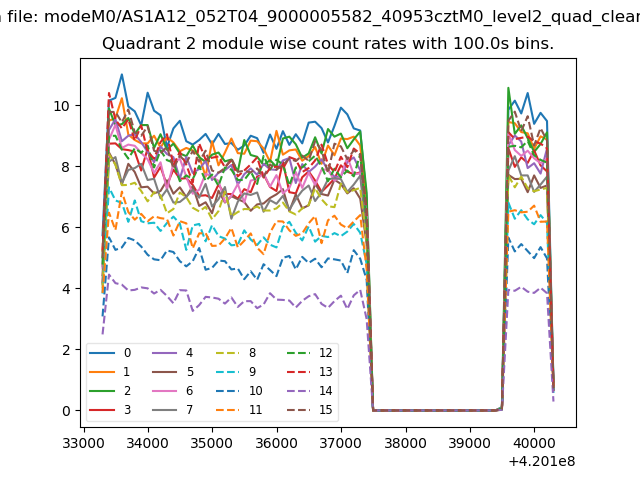
| Module-wise count rates for Quadrant B Data is divided into 100 sec bins |
 |
 |
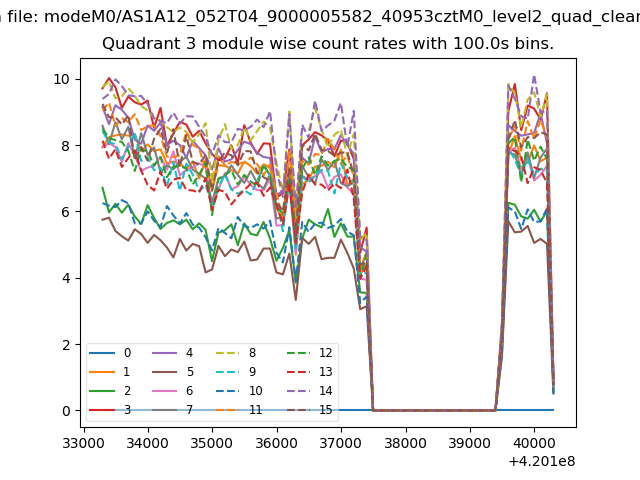
| Module-wise count rates for Quadrant C Data is divided into 100 sec bins |
 |
 |
| Module-wise count rates for Quadrant D Data is divided into 100 sec bins |
 |
 |
| Parameter | Plot |
|---|---|
| CZT HV Monitor | 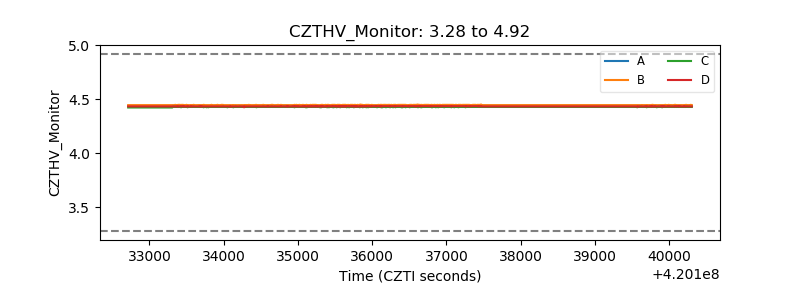 |
| D_VDD | 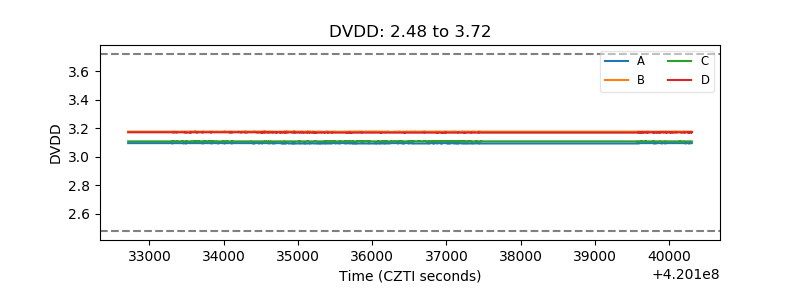 |
| Temperature 1 | 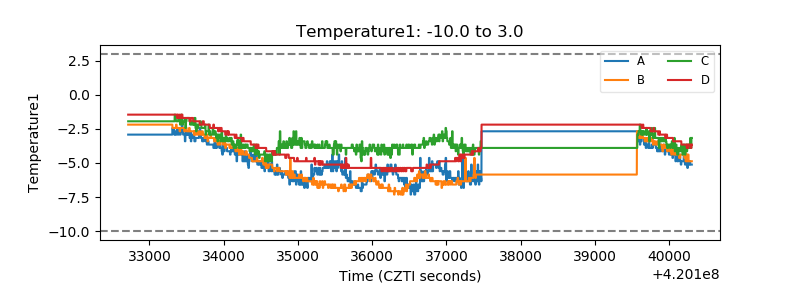 |
| Veto HV Monitor | 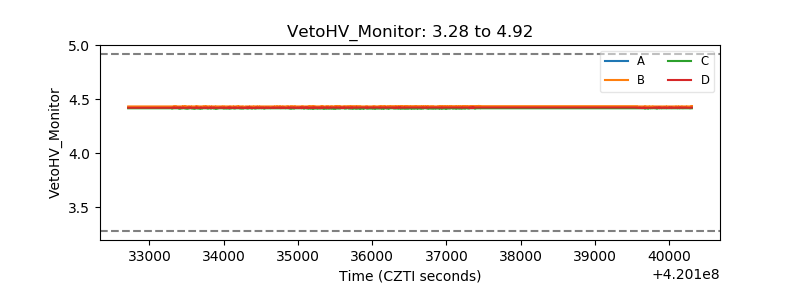 |
| Veto LLD |  |
| Alpha Counter | 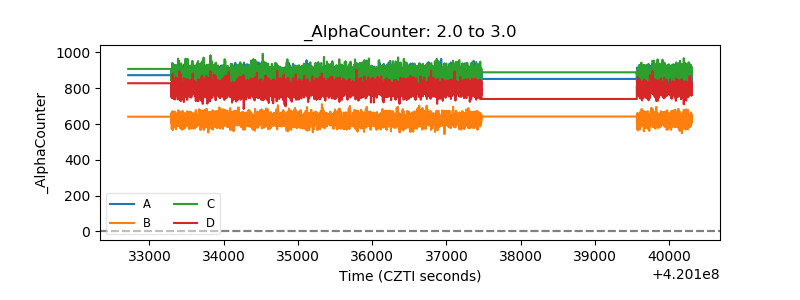 |
| _CPM_Rate | 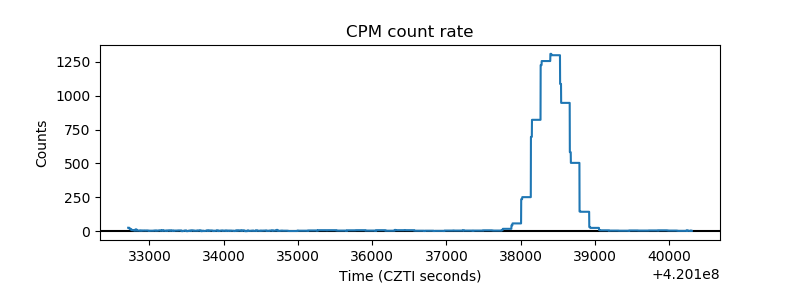 |
| CZT Counter | 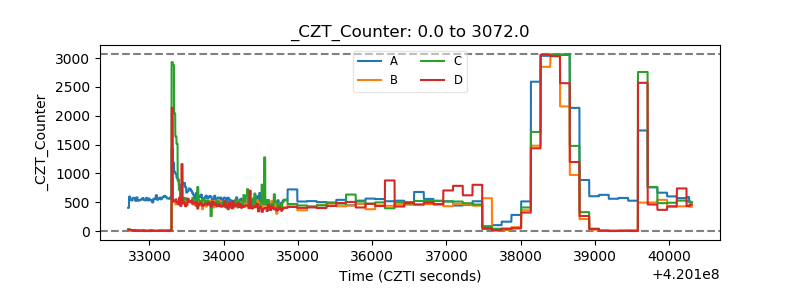 |
| +2.5 Volts monitor | 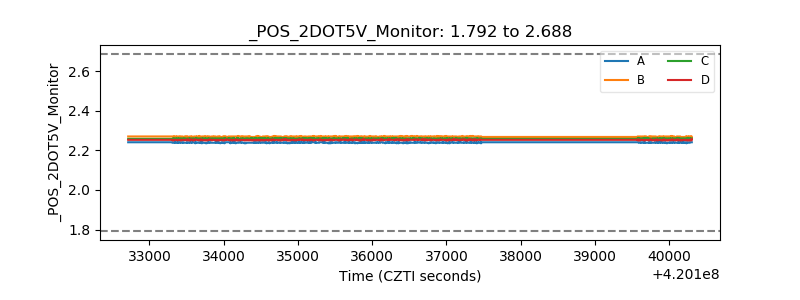 |
| +5 Volts monitor | 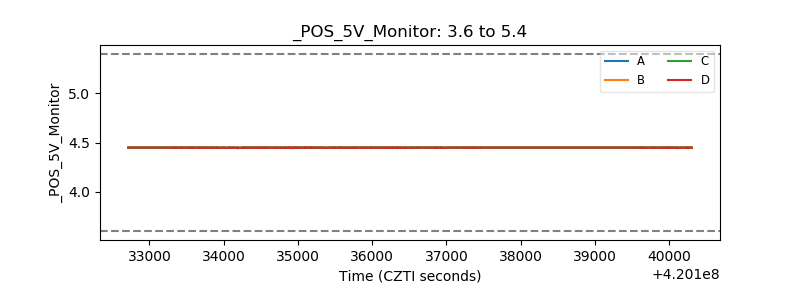 |
| _ROLL_ROT | 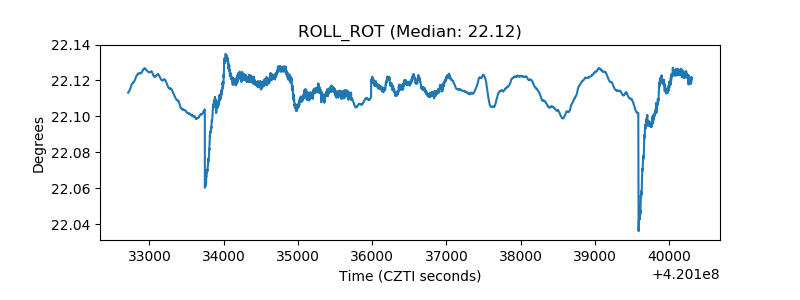 |
| _Roll_DEC | 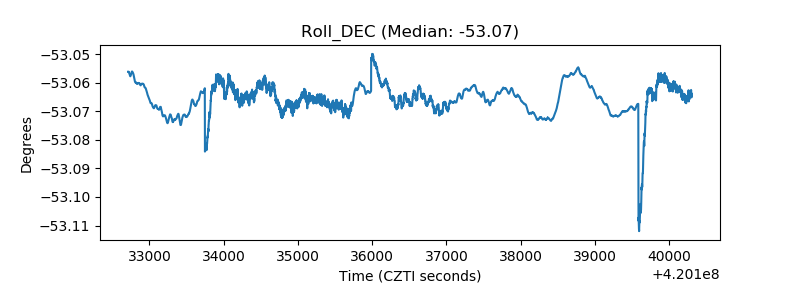 |
| _Roll_RA |  |
| Veto Counter | 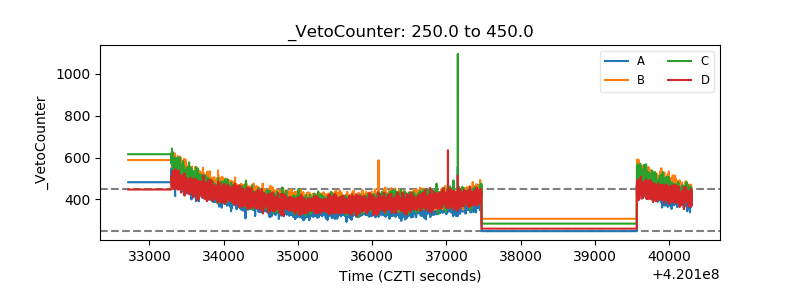 |