| Param | Original file | Final file |
|---|---|---|
| Filename | modeM0/AS1A12_052T04_9000005582_40954cztM0_level2.fits | modeM0/AS1A12_052T04_9000005582_40954cztM0_level2_quad_clean.evt |
| Size (bytes) | 294,724,800 | 87,710,400 |
| Size | 281.1 MB | 83.6 MB |
| Events in quadrant A | 2,768,241 | 604,618 |
| Events in quadrant B | 2,240,337 | 614,264 |
| Events in quadrant C | 2,515,708 | 564,522 |
| Events in quadrant D | 3,000,177 | 526,386 |
| Mode M9 | |||
|---|---|---|---|
| Quadrant | BADHDUFLAG | Total packets | Discarded packets |
| A | 0 | 36 | 0 |
| B | 0 | 36 | 0 |
| C | 0 | 36 | 0 |
| D | 0 | 37 | 0 |
| Mode SS | |||
|---|---|---|---|
| Quadrant | BADHDUFLAG | Total packets | Discarded packets |
| A | 0 | 100 | 0 |
| B | 0 | 100 | 0 |
| C | 0 | 100 | 0 |
| D | 0 | 100 | 0 |
| Mode M0 | |||
|---|---|---|---|
| Quadrant | BADHDUFLAG | Total packets | Discarded packets |
| A | 0 | 11197 | 3 |
| B | 0 | 9914 | 2 |
| C | 0 | 10492 | 2 |
| D | 0 | 12394 | 2 |
| Quadrant | Total seconds | Saturated seconds | Saturation percentage |
|---|---|---|---|
| A | 4940 | 17 | 0.344130% |
| B | 4940 | 3 | 0.060729% |
| C | 4940 | 48 | 0.971660% |
| D | 4940 | 121 | 2.449393% |
Noise dominated data is calculated using 1-second bins in cleaned event files. If a bin has >2000 counts, and if more than 50% of those come from <1% of pixels, then it is considered to be noise-dominated and hence unusable.
| Quadrant | # 1 sec bins | Bins with >0 counts | Bins with >2000 counts | High rate bins dominated by noise | Noise dominated (total time) | Noise dominated (detector-on time) | Marked lightcurve |
|---|---|---|---|---|---|---|---|
| A | 7093 | 4941 | 7 | 7 | 0.10% | 0.14% | 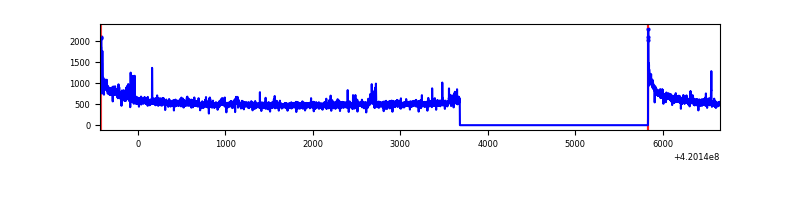 |
| B | 7093 | 4941 | 0 | 0 | 0.00% | 0.00% | 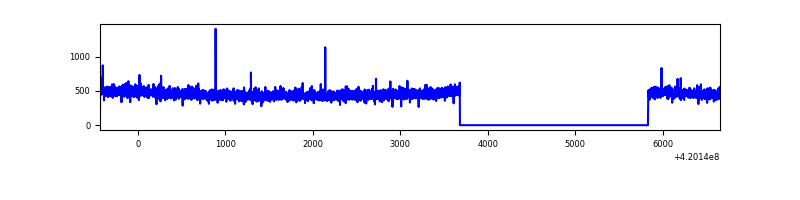 |
| C | 7093 | 4941 | 42 | 42 | 0.59% | 0.85% | 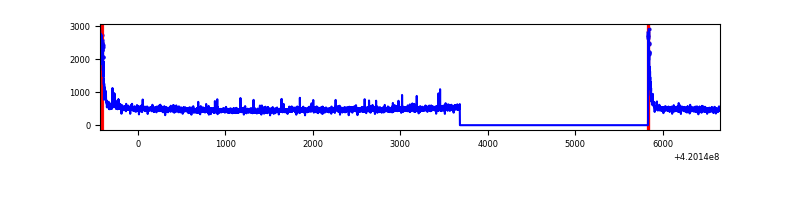 |
| D | 7093 | 4941 | 121 | 121 | 1.71% | 2.45% | 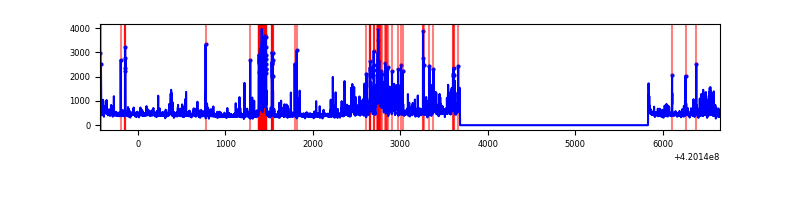 |
Top three noisy pixels from each quadrant. If the there are fewer than three noisy pixels in the level2.evt file, extra rows are filled as -1
| Pixel properties | Quadrant properties | ||||||
|---|---|---|---|---|---|---|---|
| Quadrant | DetID | PixID | Counts | Sigma | Mean | Median | Sigma |
| A | 10 | 83 | 476807 | 4186.52 | 560 | 550 | 113.8 |
| A | 12 | 189 | 118336 | 1035.39 | 560 | 550 | 113.8 |
| A | 13 | 254 | 8449 | 69.44 | 560 | 550 | 113.8 |
| B | 3 | 112 | 38171 | 347.64 | 558 | 544 | 108.2 |
| B | 12 | 111 | 13242 | 117.32 | 558 | 544 | 108.2 |
| B | 0 | 190 | 12770 | 112.96 | 558 | 544 | 108.2 |
| C | 15 | 214 | 231461 | 1866.42 | 538 | 541 | 123.7 |
| C | 0 | 10 | 153933 | 1239.8 | 538 | 541 | 123.7 |
| C | 12 | 249 | 12605 | 97.51 | 538 | 541 | 123.7 |
| D | 13 | 249 | 740100 | 5645.08 | 536 | 522 | 131.0 |
| D | 12 | 16 | 77817 | 589.98 | 536 | 522 | 131.0 |
| D | 2 | 249 | 39071 | 294.24 | 536 | 522 | 131.0 |
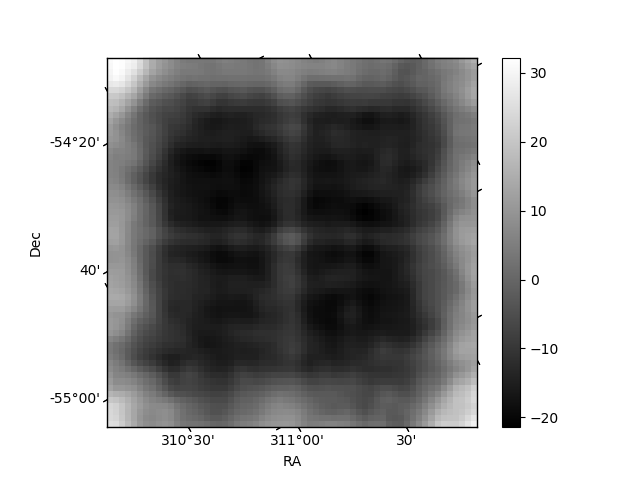
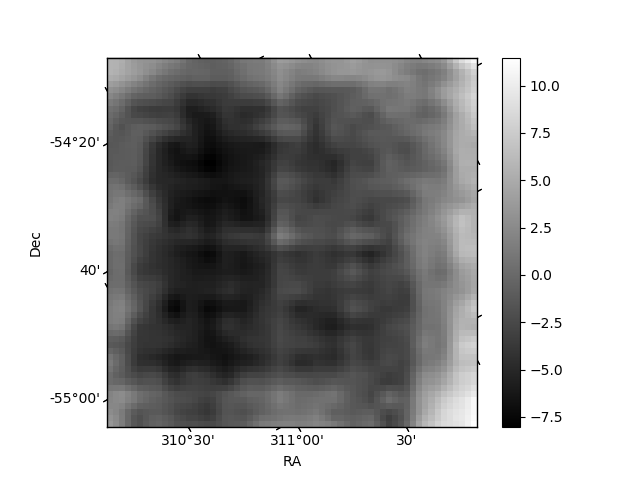
Histogram calculated using DETX and DETY for each event in the final _common_clean file
| Quadrant A | 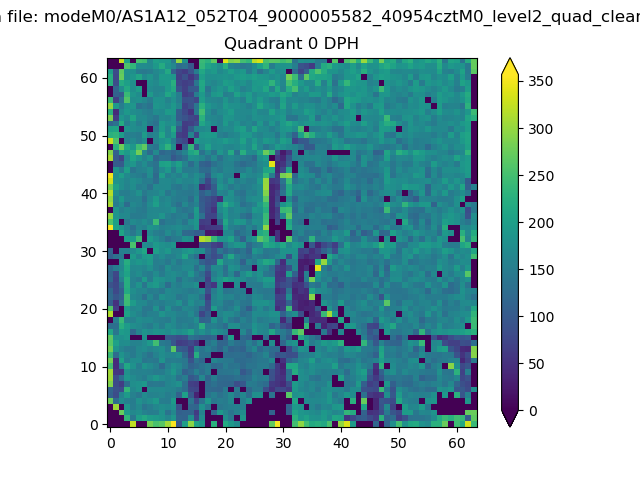 |
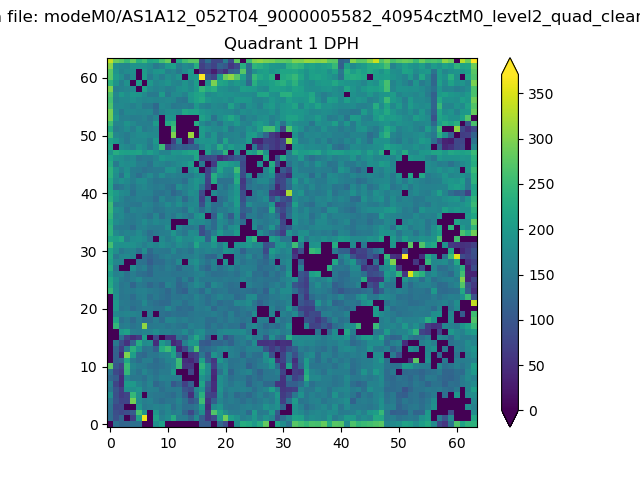 |
Quadrant B |
|---|---|---|---|
| Quadrant D | 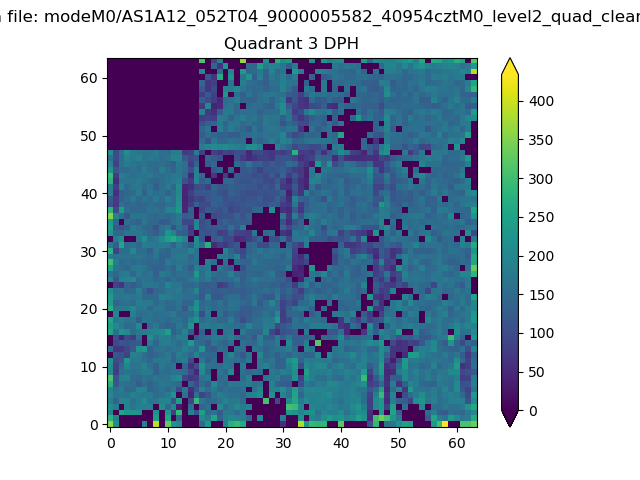 |
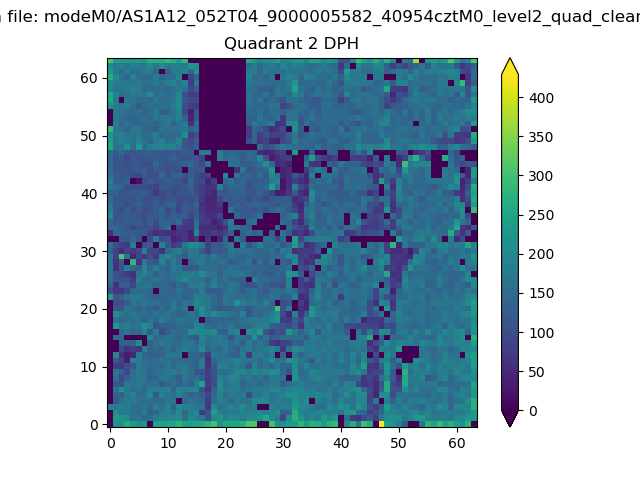 |
Quadrant C |
| Plot type | Count rate plots | Images |
|---|---|---|
| Comparison with Poisson distribution Blue bars denote a histogram of data divided into 1 sec bins. Red curve is a Poisson curve with rate = median count rate of data. |
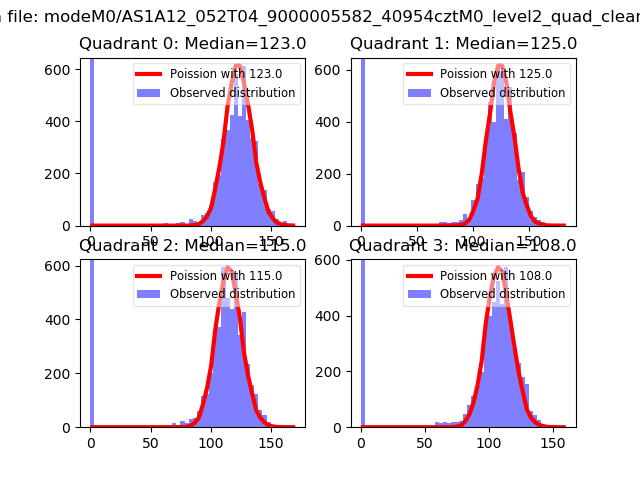 |
 |
| Quadrant-wise count rates Data is divided into 100 sec bins |
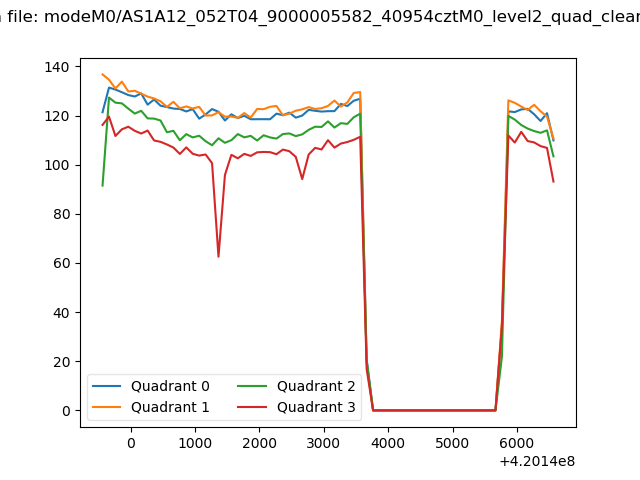 |
|
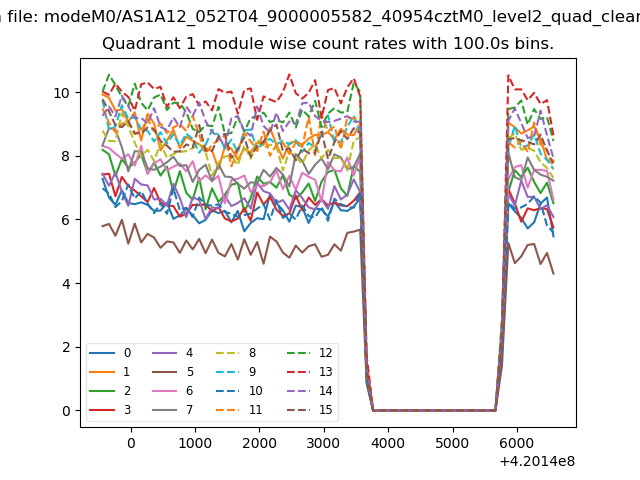
| Module-wise count rates for Quadrant A Data is divided into 100 sec bins |
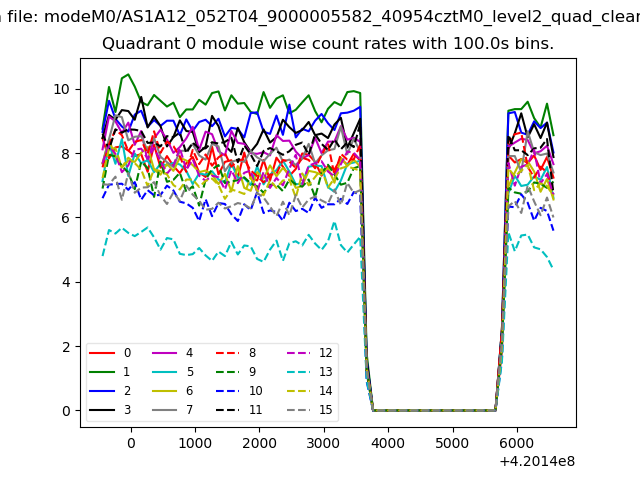 |
 |
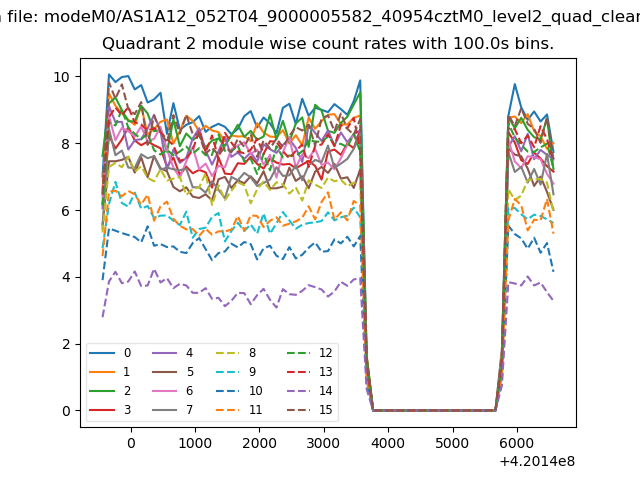
| Module-wise count rates for Quadrant B Data is divided into 100 sec bins |
 |
 |
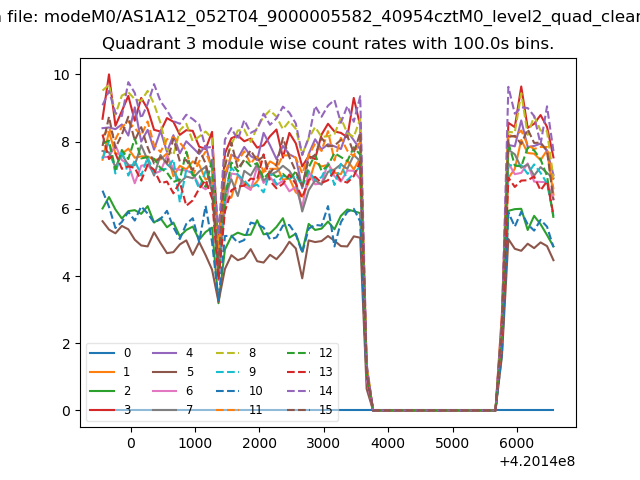
| Module-wise count rates for Quadrant C Data is divided into 100 sec bins |
 |
 |
| Module-wise count rates for Quadrant D Data is divided into 100 sec bins |
 |
 |
| Parameter | Plot |
|---|---|
| CZT HV Monitor | 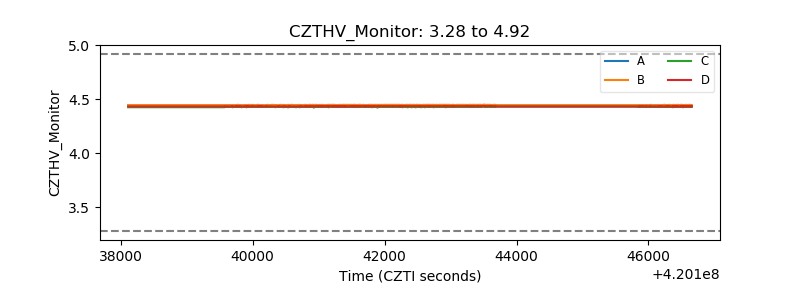 |
| D_VDD | 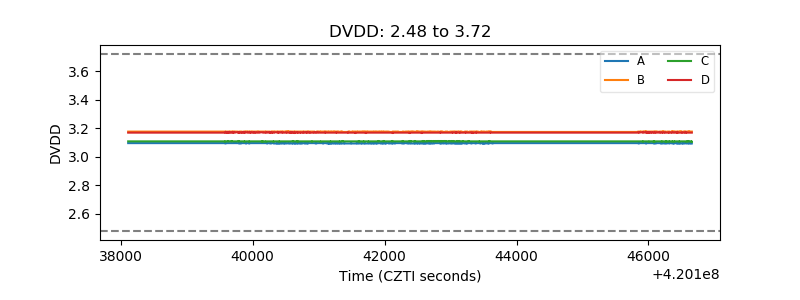 |
| Temperature 1 | 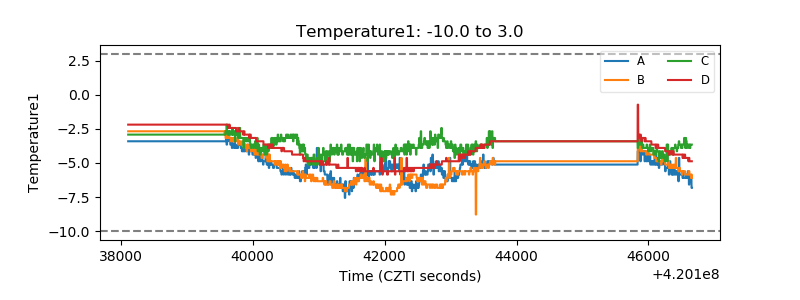 |
| Veto HV Monitor | 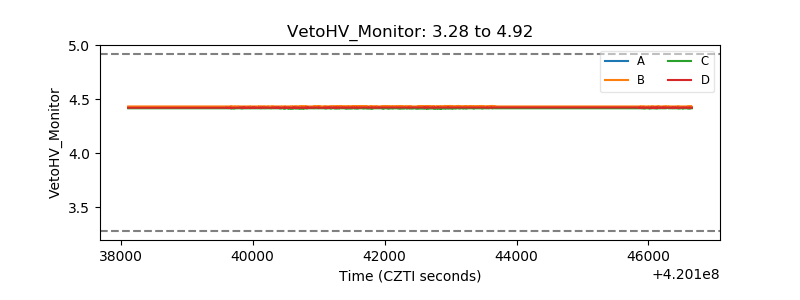 |
| Veto LLD | 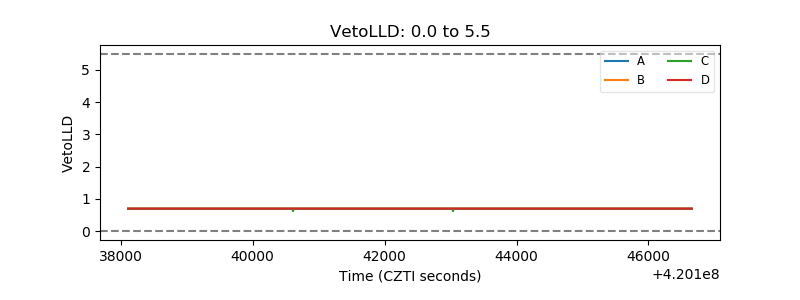 |
| Alpha Counter | 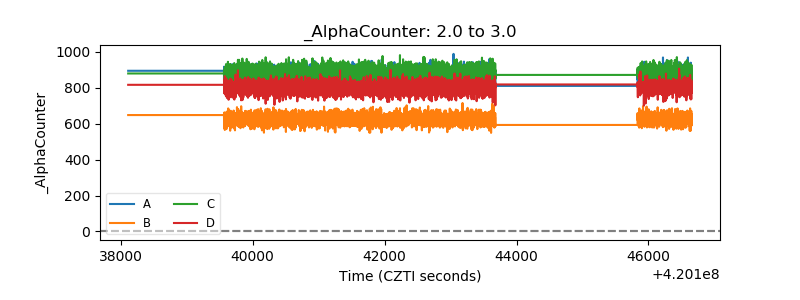 |
| _CPM_Rate | 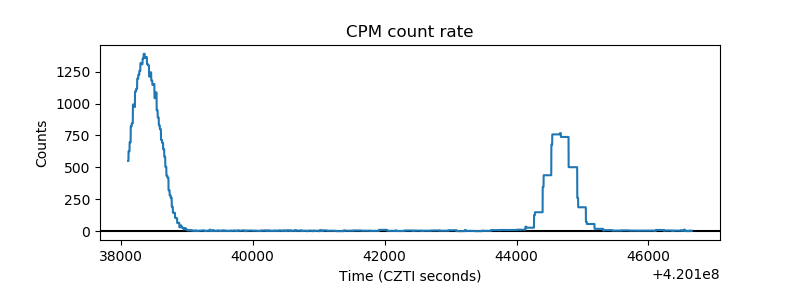 |
| CZT Counter |  |
| +2.5 Volts monitor | 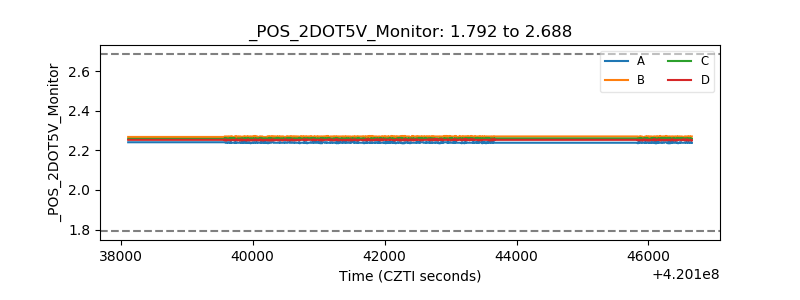 |
| +5 Volts monitor | 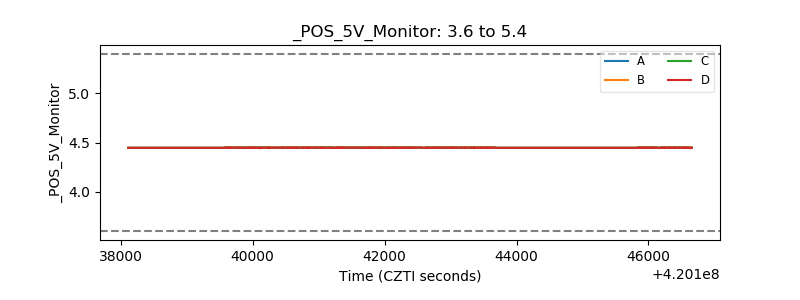 |
| _ROLL_ROT | 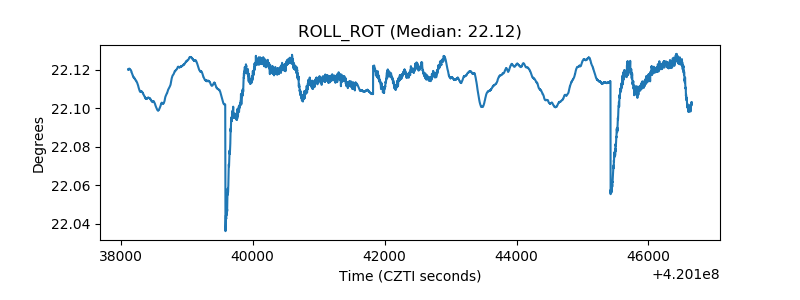 |
| _Roll_DEC | 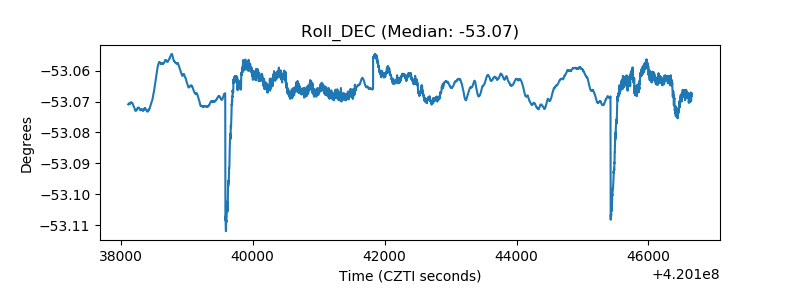 |
| _Roll_RA | 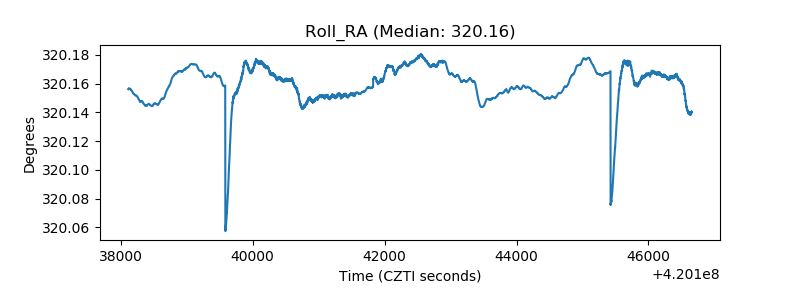 |
| Veto Counter | 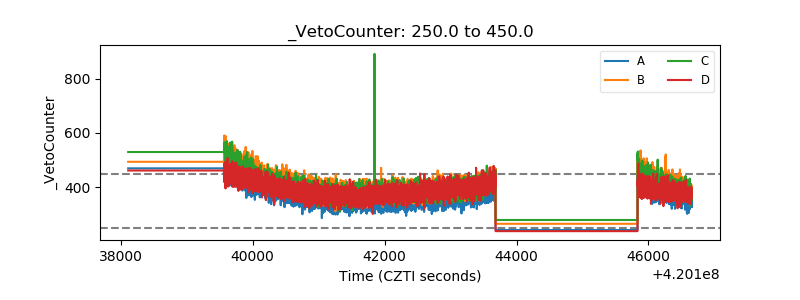 |